In the dynamic semiconductor industry, ON Semiconductor Corporation and QUALCOMM Incorporated stand out as influential players driving innovation and market growth. Both companies focus on cutting-edge technologies, from power solutions and intelligent sensing to wireless communication and 5G advancements. Their overlapping markets and distinct innovation strategies make them compelling candidates for investors seeking exposure to tech-driven growth. This article will help you decide which company presents the most attractive investment opportunity.
Table of contents
Companies Overview
I will begin the comparison between ON Semiconductor Corporation and QUALCOMM Incorporated by providing an overview of these two companies and their main differences.
ON Semiconductor Overview
ON Semiconductor Corporation focuses on providing intelligent sensing and power solutions globally. It plays a significant role in electrification in automotive, fast-charging systems, and sustainable energy sectors. Operating through three segments, ON offers a broad range of semiconductor products and design services, including analog, mixed-signal, radio frequency, and image sensors. The company is headquartered in Scottsdale, Arizona, and employs around 26,400 people.
QUALCOMM Overview
QUALCOMM Incorporated specializes in developing and commercializing foundational wireless technologies worldwide. Its business spans three segments: integrated circuits and software for wireless communications, technology licensing for intellectual property related to wireless standards, and strategic investments in emerging industries like 5G, AI, and IoT. Headquartered in San Diego, California, QUALCOMM employs approximately 49,000 full-time staff and supports government contracts.
Key similarities and differences
Both companies operate in the semiconductor industry with a focus on technology innovation and global markets. ON Semiconductor emphasizes power solutions and sensing technologies primarily for automotive and energy applications, while QUALCOMM centers on wireless communication technologies and intellectual property licensing. QUALCOMM has a larger workforce and market capitalization compared to ON, reflecting its broader industry reach and investment activities in diverse technology sectors.
Income Statement Comparison
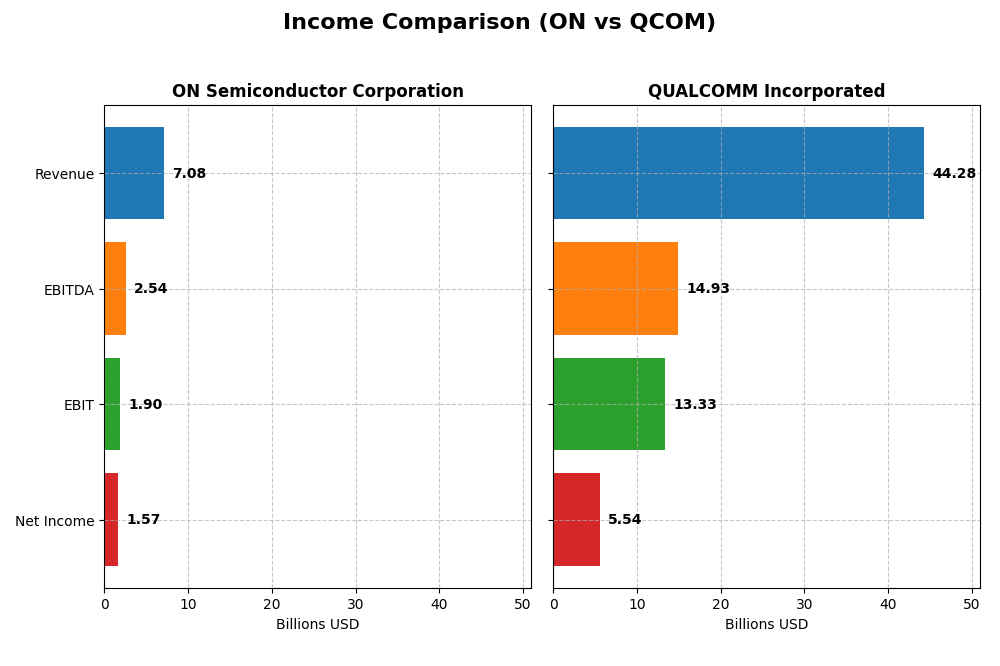
This table presents a straightforward comparison of the latest fiscal year income statement figures for ON Semiconductor Corporation and QUALCOMM Incorporated.
| Metric | ON Semiconductor Corporation | QUALCOMM Incorporated |
|---|---|---|
| Market Cap | 23.2B | 185.3B |
| Revenue | 7.08B | 44.3B |
| EBITDA | 2.54B | 14.9B |
| EBIT | 1.90B | 13.3B |
| Net Income | 1.57B | 5.54B |
| EPS | 3.68 | 5.06 |
| Fiscal Year | 2024 | 2025 |
Income Statement Interpretations
ON Semiconductor Corporation
ON Semiconductor’s revenue grew by 34.77% over 2020–2024, with net income surging 571.56% in the same period. Margins remained favorable, with a gross margin of 45.41% and net margin of 22.21%. However, in 2024, revenue and net income declined by 14.19% and 16.07%, respectively, signaling a recent slowdown despite sustained profitability.
QUALCOMM Incorporated
QUALCOMM’s revenue increased 31.93% from 2021 to 2025, supported by steady margin improvements, including a 55.43% gross margin and 30.09% EBIT margin. The company posted 13.66% revenue growth in 2025, though net income and EPS tumbled by over 40%, reflecting margin pressure despite top-line expansion.
Which one has the stronger fundamentals?
Both companies demonstrate favorable income statement health with solid margins. ON Semiconductor shows strong overall growth in net income and margins but experienced a recent downturn. QUALCOMM exhibits consistent revenue growth and higher margins but faces declining net income and EPS over the period. Each displays strengths and weaknesses in growth and profitability metrics.
Financial Ratios Comparison
The table below presents the most recent financial ratios for ON Semiconductor Corporation and QUALCOMM Incorporated as of their latest fiscal years, facilitating a straightforward comparison.
| Ratios | ON Semiconductor Corporation (2024) | QUALCOMM Incorporated (2025) |
|---|---|---|
| ROE | 17.88% | 26.13% |
| ROIC | 11.88% | 13.19% |
| P/E | 17.13 | 32.70 |
| P/B | 3.06 | 8.54 |
| Current Ratio | 5.06 | 2.82 |
| Quick Ratio | 3.38 | 2.10 |
| D/E | 0.38 | 0.70 |
| Debt-to-Assets | 23.90% | 29.54% |
| Interest Coverage | 28.37 | 18.61 |
| Asset Turnover | 0.50 | 0.88 |
| Fixed Asset Turnover | 1.61 | 9.44 |
| Payout ratio | 0% | 68.67% |
| Dividend yield | 0% | 2.10% |
Interpretation of the Ratios
ON Semiconductor Corporation
ON Semiconductor shows a mixed ratio profile with favorable net margin of 22.21% and return on equity at 17.88%, signaling decent profitability and efficient use of equity. However, a high current ratio of 5.06 and price-to-book of 3.06 raise concerns about asset utilization and valuation. The company does not pay dividends, likely prioritizing reinvestment and growth given zero payout and no yield.
QUALCOMM Incorporated
QUALCOMM exhibits largely favorable financial ratios, including a strong return on equity of 26.13% and a solid net margin of 12.51%. Its current ratio of 2.82 and fixed asset turnover of 9.44 demonstrate good liquidity and asset efficiency. The company pays dividends with a 2.1% yield, supported by a sustainable payout ratio and consistent free cash flow coverage, enhancing shareholder returns.
Which one has the best ratios?
Comparing both, QUALCOMM holds a more favorable overall ratio profile with 64.29% favorable metrics versus ON Semiconductor’s 50%. QUALCOMM’s stronger liquidity, efficient asset use, and dividend payments contrast with ON’s higher leverage ratios and lack of shareholder distributions, positioning QUALCOMM as having the superior financial ratio set.
Strategic Positioning
This section compares the strategic positioning of ON Semiconductor Corporation and QUALCOMM Incorporated, including market position, key segments, and exposure to technological disruption:
ON Semiconductor Corporation
- Mid-sized market cap of $23B, facing competition in semiconductors with beta 1.57.
- Diverse segments: Power Solutions ($3.35B), Analog Solutions ($2.61B), Intelligent Sensing ($1.13B) drive business growth.
- Exposure through analog, mixed-signal, and image sensors; focus on automotive electrification and power solutions.
QUALCOMM Incorporated
- Large market cap of $185B, strong position in wireless semiconductor industry, beta 1.21.
- Key segments: QCT ($38.4B), QTL ($5.6B) focus on wireless tech and licensing revenues.
- Exposure to disruption via 3G/4G/5G technologies, AI, automotive, IoT through QSI investments.
ON Semiconductor Corporation vs QUALCOMM Incorporated Positioning
ON Semiconductor adopts a diversified approach with three main segments focused on power, analog, and sensing technologies. QUALCOMM concentrates on wireless communications and licensing, supplemented by strategic investments in emerging tech sectors. ON’s broader product range contrasts with QUALCOMM’s specialization.
Which has the best competitive advantage?
QUALCOMM shows a stronger moat with ROIC above WACC indicating value creation despite declining profitability. ON Semiconductor has growing ROIC but still sheds value, indicating a developing competitive advantage with less efficiency in capital use.
Stock Comparison
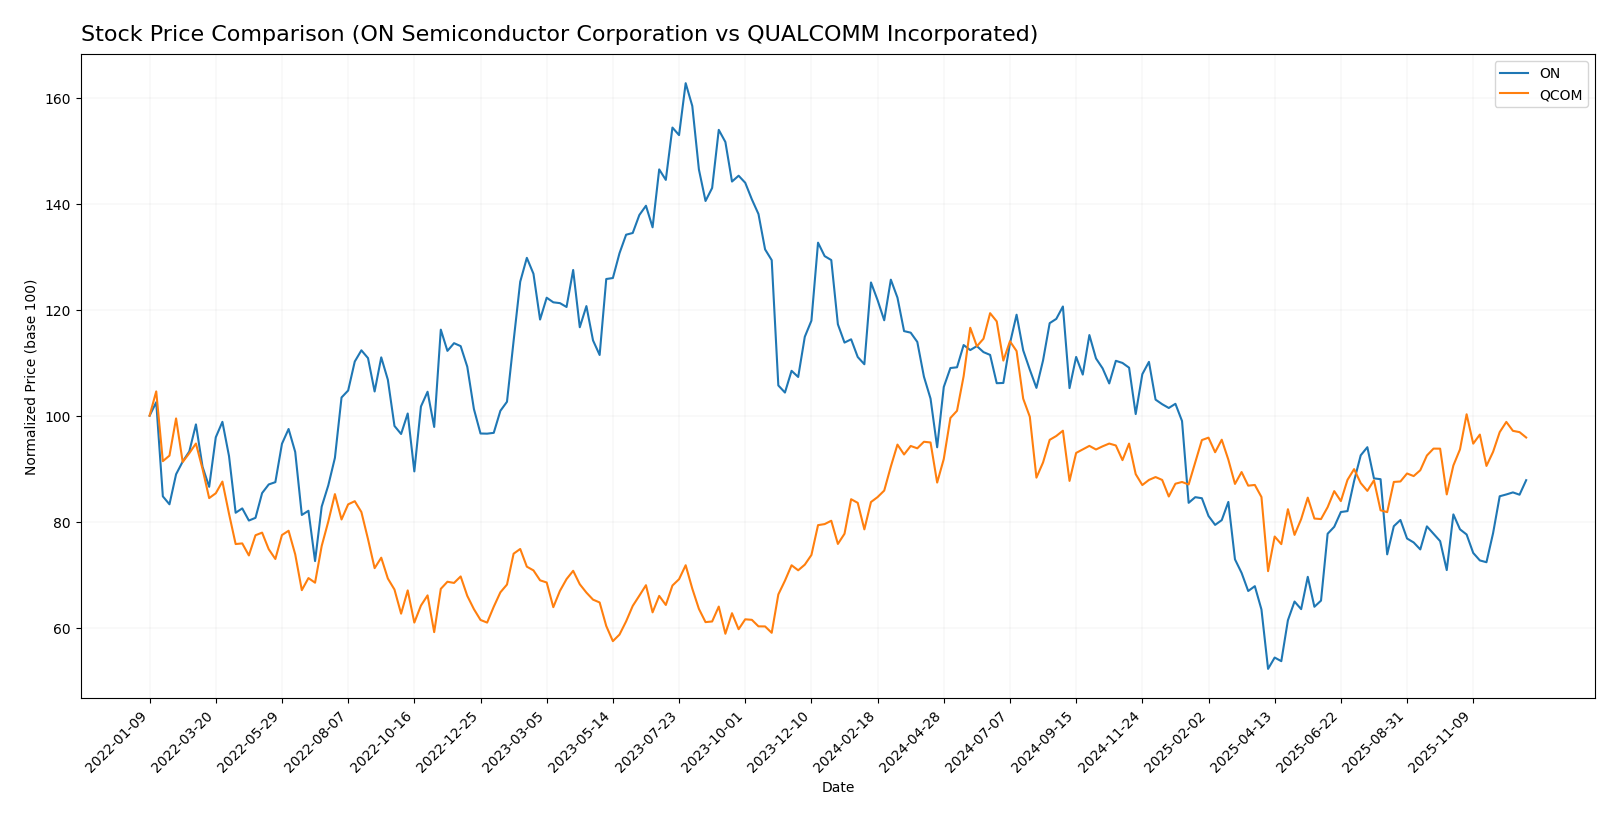
The stock price movements over the past 12 months reveal contrasting dynamics: ON Semiconductor Corporation experienced a substantial decline with accelerating bearish momentum, while QUALCOMM Incorporated posted a strong bullish trend with notable price gains and increased trading activity.
Trend Analysis
ON Semiconductor Corporation’s stock declined by 29.83% over the past year, indicating a bearish trend with accelerating negative momentum and a high price volatility of 12.3. The stock reached a high of 81.14 and a low of 33.7 during this period.
QUALCOMM Incorporated’s stock rose by 14.56% over the past year, reflecting a bullish trend with accelerating upward momentum and higher volatility at 16.17. The stock traded between 127.46 and 215.33, showing strong performance.
Comparing the two, QUALCOMM delivered the highest market performance with a positive 14.56% price change, outperforming ON Semiconductor’s negative 29.83% return over the same 12-month period.
Target Prices
Analysts provide a positive consensus on target prices for ON Semiconductor Corporation and QUALCOMM Incorporated.
| Company | Target High | Target Low | Consensus |
|---|---|---|---|
| ON Semiconductor Corporation | 64 | 51 | 58.33 |
| QUALCOMM Incorporated | 210 | 165 | 189 |
The consensus target prices suggest upside potential for both stocks relative to their current prices: ON at $56.7 versus $58.33 consensus, and QCOM at $172.98 versus $189 consensus, indicating moderate analyst optimism.
Analyst Opinions Comparison
This section compares analysts’ ratings and financial grades for ON Semiconductor Corporation (ON) and QUALCOMM Incorporated (QCOM):
Rating Comparison
ON Rating
- Rated B-, considered very favorable overall by analysts.
- Discounted Cash Flow Score of 4, seen as favorable for valuation.
- Return on Equity Score of 2, moderate efficiency in profit use.
- Return on Assets Score of 3, moderate asset utilization.
- Debt To Equity Score of 2, moderate financial risk.
- Overall Score of 3, moderate financial standing.
QCOM Rating
- Rated B+, also very favorable overall, reflecting a stronger rating.
- Same DCF score of 4, favorable valuation based on future cash flow.
- ROE score is 5, very favorable, indicating strong profit generation.
- ROA score is 5, very favorable, showing excellent asset efficiency.
- Debt To Equity Score of 1, very unfavorable, indicating higher risk.
- Overall Score also 3, moderate financial standing despite other strengths.
Which one is the best rated?
QCOM holds a higher rating (B+) than ON (B-) and outperforms ON significantly in profitability measures (ROE and ROA). However, QCOM’s debt situation is rated much less favorably. Overall scores are equal, indicating comparable financial standing but with different risk and efficiency profiles.
Scores Comparison
Here is a comparison of the financial health scores for ON Semiconductor Corporation and QUALCOMM Incorporated:
ON Scores
- Altman Z-Score: 4.54, indicating a safe zone with low risk.
- Piotroski Score: 6, classified as average financial strength.
QCOM Scores
- Altman Z-Score: 6.61, indicating a safe zone with very low risk.
- Piotroski Score: 7, classified as strong financial strength.
Which company has the best scores?
QUALCOMM has higher scores than ON Semiconductor, with a stronger Piotroski score and a higher Altman Z-Score, indicating better overall financial health based on provided data.
Grades Comparison
The grades provided by reputable grading companies for ON Semiconductor Corporation and QUALCOMM Incorporated are as follows:
ON Semiconductor Corporation Grades
The following table summarizes recent grades from established grading companies for ON Semiconductor Corporation:
| Grading Company | Action | New Grade | Date |
|---|---|---|---|
| Truist Securities | Maintain | Hold | 2025-12-19 |
| Morgan Stanley | Maintain | Equal Weight | 2025-11-24 |
| Truist Securities | Maintain | Hold | 2025-11-04 |
| Morgan Stanley | Maintain | Equal Weight | 2025-11-04 |
| Rosenblatt | Maintain | Neutral | 2025-11-04 |
| TD Cowen | Maintain | Buy | 2025-11-04 |
| Baird | Maintain | Neutral | 2025-11-04 |
| UBS | Maintain | Neutral | 2025-10-27 |
| B of A Securities | Maintain | Neutral | 2025-09-05 |
| Susquehanna | Maintain | Positive | 2025-08-05 |
ON Semiconductor’s grades mostly range between Hold and Neutral, with a few Buy and Positive ratings, indicating a generally cautious to moderately optimistic outlook.
QUALCOMM Incorporated Grades
The following table displays recent grades from recognized grading firms for QUALCOMM Incorporated:
| Grading Company | Action | New Grade | Date |
|---|---|---|---|
| Mizuho | Maintain | Outperform | 2025-11-06 |
| Piper Sandler | Maintain | Overweight | 2025-11-06 |
| Wells Fargo | Maintain | Underweight | 2025-11-06 |
| UBS | Maintain | Neutral | 2025-11-06 |
| Rosenblatt | Maintain | Buy | 2025-11-06 |
| B of A Securities | Maintain | Buy | 2025-11-06 |
| JP Morgan | Maintain | Overweight | 2025-11-04 |
| Citigroup | Maintain | Neutral | 2025-10-28 |
| Rosenblatt | Maintain | Buy | 2025-10-28 |
| UBS | Maintain | Neutral | 2025-10-27 |
QUALCOMM’s grades exhibit a broader range from Underweight to Outperform, with multiple Buy and Overweight ratings, reflecting a more bullish consensus tempered by some caution.
Which company has the best grades?
QUALCOMM Incorporated has received generally higher and more bullish grades compared to ON Semiconductor Corporation, which mostly holds Neutral to Hold ratings. This difference may influence investor sentiment, with QUALCOMM potentially viewed as having stronger growth prospects or market positioning.
Strengths and Weaknesses
Below is a comparative table highlighting key strengths and weaknesses of ON Semiconductor Corporation (ON) and QUALCOMM Incorporated (QCOM) based on the latest financial and operational data.
| Criterion | ON Semiconductor Corporation (ON) | QUALCOMM Incorporated (QCOM) |
|---|---|---|
| Diversification | Moderate diversification across Analog Solutions (2.6B), Power Solutions (3.35B), and Intelligent Sensing (1.13B) segments | Highly focused on QCT (38.4B) and QTL (5.58B), less diversified |
| Profitability | Net margin 22.21%, ROIC 11.88%, overall slightly favorable profitability with growing ROIC | Net margin 12.51%, ROIC 13.19%, favorable profitability but declining ROIC trend |
| Innovation | Growing ROIC suggests improving competitive position; strong in analog and sensing tech | Strong innovation in wireless tech but facing profitability pressure; high R&D intensity |
| Global presence | Growing global footprint with increasing revenues across segments | Established global leader in mobile chipset and licensing markets |
| Market Share | Solid in power and analog semiconductor markets, expanding sensing solutions | Dominant market share in mobile SoCs and wireless patents |
Key takeaways: ON Semiconductor shows a strengthening profitability trajectory with diversified product lines, though it currently sheds value relative to cost of capital. QUALCOMM maintains a strong value creation position with higher absolute returns but faces challenges from declining profitability trends. Investors should weigh ON’s growth momentum against QCOM’s established market dominance and innovation risks.
Risk Analysis
Below is a comparison of key risks for ON Semiconductor Corporation (ON) and QUALCOMM Incorporated (QCOM) based on the most recent data from 2025-2026.
| Metric | ON Semiconductor Corporation (ON) | QUALCOMM Incorporated (QCOM) |
|---|---|---|
| Market Risk | High beta 1.57, indicating higher volatility | Moderate beta 1.21, moderate volatility |
| Debt Level | Low debt-to-equity 0.38, low leverage | Moderate debt-to-equity 0.7, higher leverage |
| Regulatory Risk | Moderate, typical for semiconductor industry | Elevated, due to intense patent litigation and licensing regulations |
| Operational Risk | Moderate, reliant on automotive electrification trends | Moderate, depends on wireless tech innovation and patent enforcement |
| Environmental Risk | Moderate, exposure to manufacturing emissions | Moderate, focus on sustainable tech but semiconductor production impact |
| Geopolitical Risk | Moderate, supply chain exposure to global markets | Elevated, sensitive to trade restrictions and export controls |
The most significant and likely risks are market volatility for ON due to its higher beta and regulatory/geopolitical risks for QUALCOMM, stemming from patent disputes and global trade tensions. Both companies maintain solid financial health but face challenges from evolving tech regulations and supply chain dependencies. Caution is advised in volatile markets and geopolitical uncertainty.
Which Stock to Choose?
ON Semiconductor Corporation shows a favorable income statement with strong profitability but faced a recent revenue decline of -14.19%. Its financial ratios are slightly favorable, with good returns on equity (17.88%) and low debt (debt-to-assets 23.9%). The company’s rating stands at B- with moderate overall scores, reflecting solid but cautious financial health.
QUALCOMM Incorporated presents a favorable income profile with positive revenue growth of 13.66% last year, though net income declined overall. Its financial ratios are favorable, including a high return on equity (26.13%) and a sound current ratio (2.82). Its rating at B+ and strong scores indicate robust financial strength despite some valuation concerns.
For investors prioritizing growth and stability, QUALCOMM’s stronger ratings and favorable financial ratios might appear more attractive. Conversely, those valuing improving profitability and lower recent debt levels could view ON Semiconductor’s profile as slightly favorable. The choice may depend on one’s risk tolerance and investment strategy.
Disclaimer: Investment carries a risk of loss of initial capital. The past performance is not a reliable indicator of future results. Be sure to understand risks before making an investment decision.
Go Further
I encourage you to read the complete analyses of ON Semiconductor Corporation and QUALCOMM Incorporated to enhance your investment decisions: