In the fast-evolving semiconductor industry, QUALCOMM Incorporated and indie Semiconductor, Inc. stand out for their innovative approaches and market focus. QUALCOMM leads with foundational wireless technologies and broad licensing, while indie Semiconductor specializes in automotive chips and software solutions. Both target growth sectors with strong technological overlaps, making their comparison essential for investors seeking exposure in cutting-edge tech. This article will help you identify which company offers the most compelling investment opportunity.
Table of contents
Companies Overview
I will begin the comparison between QUALCOMM and indie Semiconductor by providing an overview of these two companies and their main differences.
QUALCOMM Overview
QUALCOMM Incorporated focuses on developing and commercializing foundational wireless technologies globally. Operating through three segments—QCT, QTL, and QSI—the company supplies integrated circuits, licenses intellectual property for wireless standards like 3G/4G/5G, and invests in early-stage industries such as AI and automotive. Founded in 1985 and headquartered in San Diego, QUALCOMM is a major player in the semiconductor industry with a market cap of 175B USD.
indie Semiconductor Overview
indie Semiconductor, Inc. specializes in automotive semiconductors and software solutions for advanced driver assistance, connected cars, and electrification. Its product range includes devices for parking assistance, wireless charging, infotainment, and optical components for sensing and communication. Established in 2007 and based in Aliso Viejo, indie Semiconductor is a smaller company with a market cap of approximately 870M USD, focusing on innovative automotive technologies.
Key similarities and differences
Both companies operate within the semiconductor industry and contribute to technology development, yet they differ significantly in scale and focus. QUALCOMM has a broad wireless technology portfolio and a large global presence, while indie Semiconductor concentrates on automotive applications and niche photonic components. QUALCOMM’s diverse licensing and investment activities contrast with indie’s specialized product offerings targeting the automotive sector.
Income Statement Comparison
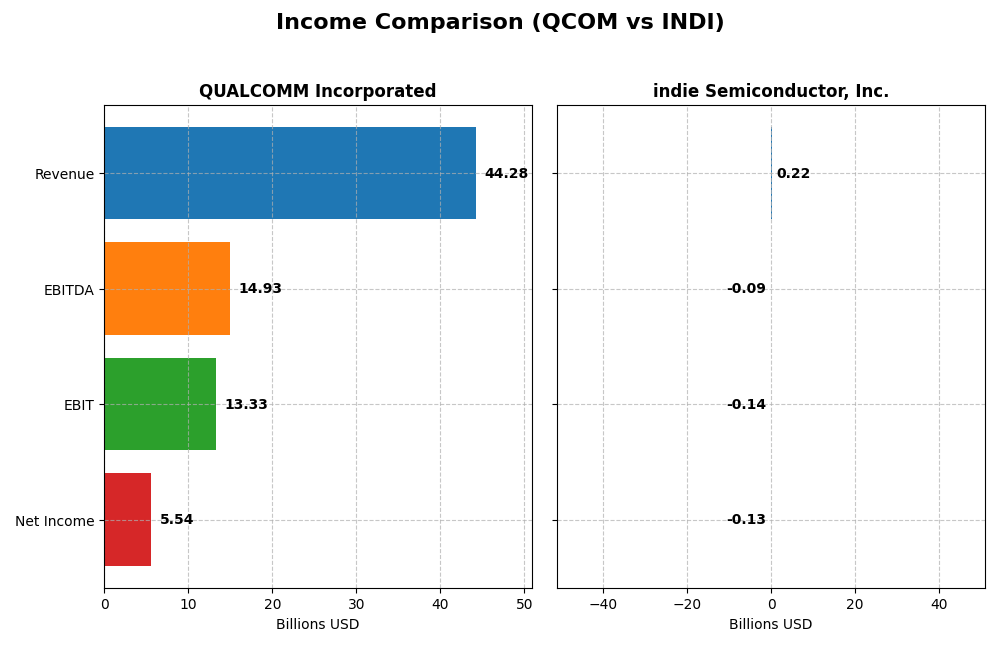
The table below presents a side-by-side comparison of key income statement metrics for QUALCOMM Incorporated and indie Semiconductor, Inc. based on their most recent fiscal year data.
| Metric | QUALCOMM Incorporated | indie Semiconductor, Inc. |
|---|---|---|
| Market Cap | 175.1B | 871.2M |
| Revenue | 44.3B | 217M |
| EBITDA | 14.9B | -94M |
| EBIT | 13.3B | -137M |
| Net Income | 5.54B | -133M |
| EPS | 5.06 | -0.76 |
| Fiscal Year | 2025 | 2024 |
Income Statement Interpretations
QUALCOMM Incorporated
QUALCOMM’s revenue showed a positive trend, increasing from $33.6B in 2021 to $44.3B in 2025, a 31.93% growth over the period. Net income, however, declined overall by 38.73%, with a significant drop in the latest year to $5.54B from $10.14B in 2024. Margins remained favorable, with a gross margin of 55.43% and EBIT margin of 30.09% in 2025. The latest year saw revenue growth at 13.66%, but net margin and EPS fell sharply.
indie Semiconductor, Inc.
indie Semiconductor’s revenue grew substantially over the period, from $23M in 2020 to $217M in 2024, an 858.35% increase, though revenue declined by 2.91% in the most recent year. Net income remained negative, reporting a loss of $133M in 2024, with an unfavorable EBIT margin of -63.22%. Gross margin improved to 41.68%, and EPS showed modest growth. Overall, the income statement reflects mixed results with continued losses.
Which one has the stronger fundamentals?
QUALCOMM demonstrates stronger fundamentals with consistent revenue growth, robust gross and EBIT margins, and a favorable overall income statement opinion despite recent declines in net income and EPS. indie Semiconductor shows impressive revenue expansion but persistent net losses and negative EBIT margins, leading to a neutral evaluation. QUALCOMM’s financial stability and profitability metrics give it a more solid income statement foundation.
Financial Ratios Comparison
The table below presents the most recent key financial ratios for QUALCOMM Incorporated and indie Semiconductor, Inc., facilitating a straightforward comparison of their fiscal health and market valuation.
| Ratios | QUALCOMM Incorporated (QCOM) | indie Semiconductor, Inc. (INDI) |
|---|---|---|
| ROE | 26.13% | -31.73% |
| ROIC | 13.19% | -19.25% |
| P/E | 32.70 | -5.35 |
| P/B | 8.54 | 1.70 |
| Current Ratio | 2.82 | 4.82 |
| Quick Ratio | 2.10 | 4.23 |
| D/E (Debt-to-Equity) | 0.70 | 0.95 |
| Debt-to-Assets | 29.54% | 42.34% |
| Interest Coverage | 18.61 | -18.37 |
| Asset Turnover | 0.88 | 0.23 |
| Fixed Asset Turnover | 9.44 | 4.30 |
| Payout Ratio | 68.67% | 0% |
| Dividend Yield | 2.10% | 0% |
Interpretation of the Ratios
QUALCOMM Incorporated
QUALCOMM shows overall strong financial ratios, with favorable net margin at 12.51%, return on equity of 26.13%, and return on invested capital of 13.19%. Liquidity is solid with a current ratio of 2.82. However, valuation multiples like PE (32.7) and PB (8.54) appear high. The company pays dividends, yielding 2.1%, supported by free cash flow coverage, indicating a sustainable payout and shareholder returns.
indie Semiconductor, Inc.
indie Semiconductor’s ratios reveal significant weaknesses, including a negative net margin of -61.2%, negative returns on equity and capital employed, and an unfavorable WACC of 11.4%. Liquidity ratios are mixed, with a high current ratio but negative interest coverage. The company does not pay dividends, reflecting its negative net income and reinvestment focus amid a high growth phase and substantial R&D spending.
Which one has the best ratios?
Based on the evaluations, QUALCOMM holds a favorable ratio profile with strong profitability, liquidity, and dividend support, despite high valuation metrics. indie Semiconductor presents an unfavorable profile marked by losses, poor returns, and no dividend payouts, reflecting its early-stage and growth-oriented strategy. Thus, QUALCOMM’s ratios are clearly stronger in this comparison.
Strategic Positioning
This section compares the strategic positioning of QUALCOMM and indie Semiconductor including Market position, Key segments, and disruption:
QUALCOMM
- Leading semiconductor player with strong competitive pressure in wireless technology.
- Diversified revenue streams in wireless chips, licensing, and strategic investments.
- Invests in emerging tech including 5G, AI, automotive, and IoT to manage disruption.
indie Semiconductor
- Smaller player focused on automotive semiconductors with higher beta risk.
- Concentrated on automotive semiconductors and software for ADAS and connectivity.
- Focuses on photonic components and automotive applications, exposed to tech shifts.
QUALCOMM vs indie Semiconductor Positioning
QUALCOMM pursues a diversified approach across wireless technologies and investments, offering stable revenue sources but facing intense competition. indie Semiconductor concentrates on automotive semiconductors, which may limit diversification but targets growth in connected vehicles.
Which has the best competitive advantage?
QUALCOMM holds a slightly favorable moat with positive ROIC above WACC despite declining profitability, indicating value creation. indie Semiconductor shows a very unfavorable moat with negative ROIC and value destruction, reflecting weaker competitive advantage.
Stock Comparison
The stock price movements of QUALCOMM Incorporated and indie Semiconductor, Inc. over the past 12 months reveal contrasting trends, with QUALCOMM showing sustained gains and indie Semiconductor experiencing marked declines.

Trend Analysis
QUALCOMM Incorporated’s stock exhibited a bullish trend over the past year, with a 5.7% price increase and acceleration in momentum, reaching a high of 215.33 and a low of 127.46. Recent months show slight deceleration with a -9.48% decline.
indie Semiconductor, Inc. faced a bearish trend over the same period, with a -27.74% price decrease and deceleration in its decline. The stock ranged between 1.6 and 7.43, with recent losses accelerating at -20.35%.
Comparing the two, QUALCOMM delivered the highest market performance with a positive 5.7% gain, whereas indie Semiconductor posted significant losses, indicating a clear divergence in stock trajectories.
Target Prices
The current target price consensus indicates modest upside potential for these semiconductor companies.
| Company | Target High | Target Low | Consensus |
|---|---|---|---|
| QUALCOMM Incorporated | 210 | 165 | 185.71 |
| indie Semiconductor, Inc. | 8 | 8 | 8 |
For QUALCOMM, analysts expect a target consensus of $185.71, above the current price of $163.53, suggesting potential appreciation. indie Semiconductor shows a flat target at $8, indicating limited upside from the current $4.30 price but reflecting firm analyst valuation.
Analyst Opinions Comparison
This section compares analysts’ ratings and grades for QUALCOMM Incorporated and indie Semiconductor, Inc.:
Rating Comparison
QUALCOMM Incorporated Rating
- Rating: B+, considered very favorable by analysts.
- Discounted Cash Flow Score: 4, indicating favorable valuation based on future cash flows.
- ROE Score: 5, showing very favorable profit generation from equity.
- ROA Score: 5, demonstrating very favorable asset utilization to generate earnings.
- Debt To Equity Score: 1, which is very unfavorable and suggests higher financial risk.
- Overall Score: 3, moderate assessment of overall financial standing.
indie Semiconductor, Inc. Rating
- Rating: C-, regarded as very unfavorable by analysts.
- Discounted Cash Flow Score: 1, signaling a very unfavorable valuation.
- ROE Score: 1, reflecting very unfavorable equity profit efficiency.
- ROA Score: 1, indicating very unfavorable asset efficiency.
- Debt To Equity Score: 1, also very unfavorable indicating financial risk concerns.
- Overall Score: 1, very unfavorable overall financial assessment.
Which one is the best rated?
Based strictly on the provided data, QUALCOMM is better rated with a B+ rating and higher scores in discounted cash flow, ROE, and ROA. indie Semiconductor’s ratings and scores are mostly very unfavorable, reflecting weaker financial metrics.
Scores Comparison
Here is a comparison of the Altman Z-Score and Piotroski Score for QUALCOMM and indie Semiconductor:
QCOM Scores
- Altman Z-Score: 6.37, in the safe zone, low bankruptcy risk.
- Piotroski Score: 7, indicating strong financial health.
INDI Scores
- Altman Z-Score: 0.12, in the distress zone, high bankruptcy risk.
- Piotroski Score: 2, indicating very weak financial health.
Which company has the best scores?
Based strictly on the provided data, QUALCOMM exhibits a significantly stronger financial position with a safe zone Altman Z-Score and a strong Piotroski Score, unlike indie Semiconductor which scores in distress and very weak zones.
Grades Comparison
Here is a comparison of the latest grades assigned to QUALCOMM Incorporated and indie Semiconductor, Inc.:
QUALCOMM Incorporated Grades
The table below shows recent grades from established grading companies for QUALCOMM Incorporated:
| Grading Company | Action | New Grade | Date |
|---|---|---|---|
| Mizuho | Downgrade | Neutral | 2026-01-09 |
| Rosenblatt | Maintain | Buy | 2025-11-06 |
| B of A Securities | Maintain | Buy | 2025-11-06 |
| Mizuho | Maintain | Outperform | 2025-11-06 |
| Wells Fargo | Maintain | Underweight | 2025-11-06 |
| Piper Sandler | Maintain | Overweight | 2025-11-06 |
| UBS | Maintain | Neutral | 2025-11-06 |
| JP Morgan | Maintain | Overweight | 2025-11-04 |
| Citigroup | Maintain | Neutral | 2025-10-28 |
| Rosenblatt | Maintain | Buy | 2025-10-28 |
QUALCOMM’s grades show a mix of Buy, Neutral, Overweight, and Outperform ratings, with one recent downgrade from Outperform to Neutral by Mizuho.
indie Semiconductor, Inc. Grades
Below are the recent grades provided by recognized firms for indie Semiconductor, Inc.:
| Grading Company | Action | New Grade | Date |
|---|---|---|---|
| UBS | Maintain | Neutral | 2025-11-10 |
| Benchmark | Maintain | Buy | 2025-06-25 |
| Benchmark | Maintain | Buy | 2025-06-11 |
| Benchmark | Maintain | Buy | 2025-05-21 |
| Benchmark | Maintain | Buy | 2025-05-13 |
| Craig-Hallum | Maintain | Buy | 2025-05-13 |
| Keybanc | Maintain | Overweight | 2025-05-13 |
| Benchmark | Maintain | Buy | 2025-04-09 |
| Benchmark | Maintain | Buy | 2025-02-21 |
| Keybanc | Maintain | Overweight | 2025-02-21 |
indie Semiconductor consistently holds Buy and Overweight ratings, with one Neutral rating from UBS.
Which company has the best grades?
Both companies have a consensus Buy rating, but indie Semiconductor exhibits a stronger consistency in Buy and Overweight grades, while QUALCOMM shows more diversity with some Neutral and Underweight ratings. This pattern may indicate differing market perceptions and risk profiles for investors.
Strengths and Weaknesses
Below is a comparative overview of key strengths and weaknesses for QUALCOMM Incorporated (QCOM) and indie Semiconductor, Inc. (INDI) based on the most recent financial and strategic data.
| Criterion | QUALCOMM Incorporated (QCOM) | indie Semiconductor, Inc. (INDI) |
|---|---|---|
| Diversification | High revenue from multiple segments: $38.4B (QCT), $5.6B (QTL) in 2025 | Limited diversification: $203M product, $14M service revenue in 2024 |
| Profitability | Favorable net margin (12.5%), ROIC (13.2%), and ROE (26.1%) | Unfavorable net margin (-61.2%), ROIC (-19.3%), and ROE (-31.7%) |
| Innovation | Strong R&D and market presence in wireless technologies | Early-stage semiconductor company with smaller scale innovation |
| Global presence | Established global footprint and partnerships | Emerging with limited global reach |
| Market Share | Leading market share in mobile chipsets and licensing | Small market share in semiconductor products |
Key takeaways: QUALCOMM demonstrates strong profitability, diversified revenue streams, and a solid global presence, although its ROIC is declining. indie Semiconductor faces significant profitability challenges and limited diversification, indicating higher investment risk.
Risk Analysis
Below is a comparison of key risk factors for QUALCOMM Incorporated (QCOM) and indie Semiconductor, Inc. (INDI) based on their most recent financial and market data.
| Metric | QUALCOMM Incorporated (QCOM) | indie Semiconductor, Inc. (INDI) |
|---|---|---|
| Market Risk | Beta 1.21 – moderate volatility | Beta 2.54 – high volatility |
| Debt level | Debt/Equity 0.7 – moderate, Interest Coverage 20x – strong | Debt/Equity 0.95 – moderate, Interest Coverage -14.8x – very weak |
| Regulatory Risk | Moderate – operates globally with IP licensing exposure | Moderate – automotive semiconductor sector regulatory sensitivity |
| Operational Risk | Low – diversified segments and strong market position | High – negative margins and low asset turnover |
| Environmental Risk | Moderate – semiconductor industry environmental compliance | Moderate – automotive focus with evolving regulations |
| Geopolitical Risk | Moderate – global supply chain and trade policies impact | Moderate – automotive market exposure and supply chain risks |
In synthesis, indie Semiconductor faces the most impactful risks including very weak interest coverage and distress-level financial health, indicating potential liquidity and solvency challenges. QUALCOMM’s risks are comparatively lower with strong financial stability, though valuation multiples suggest cautious entry. Market volatility is higher for indie, increasing investment risk.
Which Stock to Choose?
QUALCOMM Incorporated (QCOM) shows a generally favorable income evolution with solid revenue growth of 13.66% in the last year and a strong gross margin at 55.43%. Its profitability indicators like ROE at 26.13% and net margin at 12.51% are favorable, supported by manageable debt levels and a very favorable rating of B+. Despite a declining ROIC trend, QCOM remains a value creator with a strong financial position.
indie Semiconductor, Inc. (INDI) presents a more mixed picture with a neutral global income statement opinion and unfavorable profitability metrics including a negative net margin of -61.2% and ROE of -31.73%. Financial ratios reveal a majority of unfavorable indicators and a very unfavorable rating of C-. The company is shedding value with declining ROIC and shows signs of financial distress, reflected also in its Altman Z-score in the distress zone.
For investors, QCOM might appear more favorable given its strong rating, income growth, and value creation, suggesting suitability for those seeking quality and stability. INDI’s profile, marked by financial challenges and negative profitability, could be interpreted as more suitable only for risk-tolerant investors with a speculative growth focus. The choice ultimately depends on the investor’s risk appetite and investment strategy.
Disclaimer: Investment carries a risk of loss of initial capital. The past performance is not a reliable indicator of future results. Be sure to understand risks before making an investment decision.
Go Further
I encourage you to read the complete analyses of QUALCOMM Incorporated and indie Semiconductor, Inc. to enhance your investment decisions: