In the fast-evolving semiconductor industry, QUALCOMM Incorporated and Arm Holdings plc stand out as pivotal innovators shaping the future of technology. Both companies play critical roles in advancing wireless communication and computing infrastructure, with overlapping markets in chip design and intellectual property licensing. This comparison will help investors discern which company offers the most compelling growth and value potential in today’s competitive landscape. Let’s explore which stock might best fit your investment portfolio.
Table of contents
Companies Overview
I will begin the comparison between QUALCOMM and Arm Holdings by providing an overview of these two companies and their main differences.
QUALCOMM Overview
QUALCOMM Incorporated is a major player in the wireless industry, focused on developing and commercializing foundational technologies globally. It operates through three segments: integrated circuits and system software for wireless communications, technology licensing for patents in 3G/4G/5G standards, and strategic investments in emerging sectors like AI and IoT. Headquartered in San Diego, CA, it employs 49,000 people and has a market cap of $185B.
Arm Holdings Overview
Arm Holdings plc designs and licenses CPU products and related technologies primarily for semiconductor companies and equipment manufacturers. Its offerings include microprocessors, system IPs, GPUs, and software used in automotive, computing infrastructure, and IoT markets worldwide. Based in Cambridge, UK, Arm has 8,330 employees, operates internationally, and trades with a market cap of $121B as a subsidiary of Kronos II LLC.
Key similarities and differences
Both companies operate in the semiconductor industry and focus on essential technology development for global markets. QUALCOMM emphasizes integrated circuits and technology licensing across wireless communications, while Arm centers on CPU architecture and IP licensing for a broader range of devices. QUALCOMM is larger by market cap and workforce, with diversified segments including strategic investments, whereas Arm primarily licenses intellectual property and operates under a parent company structure.
Income Statement Comparison
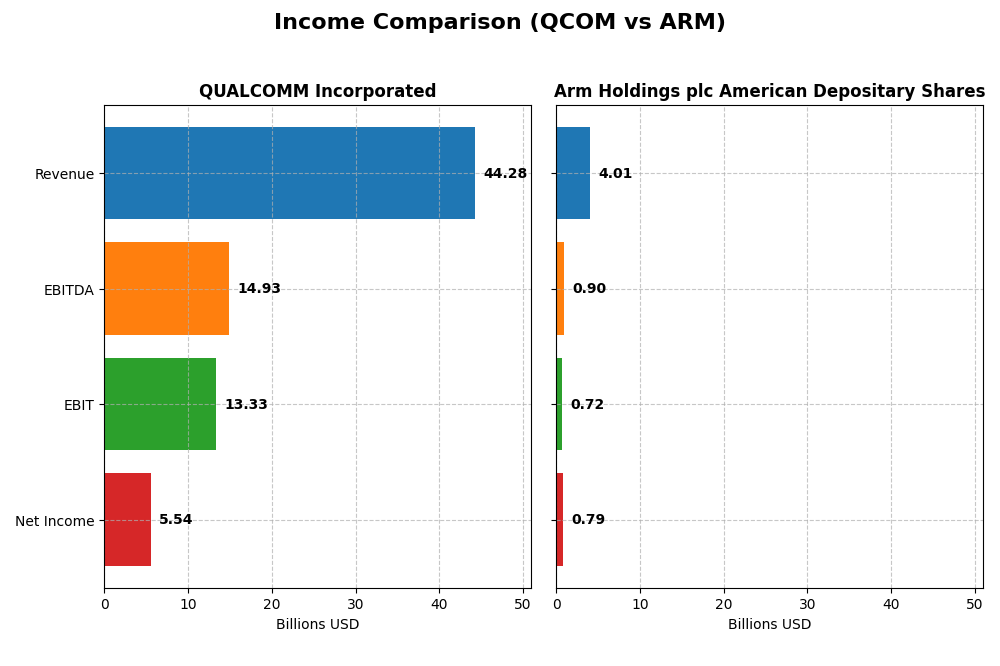
The table below compares key income statement metrics for QUALCOMM Incorporated and Arm Holdings plc for their most recent fiscal years, highlighting their financial scale and profitability.
| Metric | QUALCOMM Incorporated | Arm Holdings plc American Depositary Shares |
|---|---|---|
| Market Cap | 185.3B | 121.2B |
| Revenue | 44.3B | 4.0B |
| EBITDA | 14.9B | 903M |
| EBIT | 13.3B | 720M |
| Net Income | 5.54B | 792M |
| EPS | 5.06 | 0.75 |
| Fiscal Year | 2025 | 2025 |
Income Statement Interpretations
QUALCOMM Incorporated
From 2021 to 2025, QUALCOMM’s revenue grew steadily by 31.93%, reaching $44.3B in 2025. However, net income declined by 38.73% over the same period, with a marked dip in net margin, falling 53.56%. The 2025 fiscal year saw revenue growth of 13.66% and EBIT margin improvement to 30.09%, but net margin dropped sharply by 51.93%, reflecting pressure on profitability despite favorable gross margins.
Arm Holdings plc American Depositary Shares
Arm’s revenue nearly doubled, up 97.68% from 2021 to 2025, reaching $4.01B, while net income more than doubled, growing 104.12%. Margins remained robust, with a high gross margin of 94.86% and net margin increasing 108.83% in 2025. The latest year showed strong performance across the board, with EBIT surging 239.62% and EPS growth of 158.62%, highlighting accelerating profitability and margin expansion.
Which one has the stronger fundamentals?
Arm exhibits stronger fundamentals with consistent double-digit revenue and net income growth, exceptional margin stability, and no unfavorable income metrics. QUALCOMM shows healthy revenue growth but suffers from declining net income and margins, signaling profitability challenges. Overall, Arm’s income statement reflects greater growth momentum and margin strength relative to QUALCOMM.
Financial Ratios Comparison
This table presents the most recent key financial ratios for QUALCOMM Incorporated and Arm Holdings plc, based on their fiscal year 2025 data, to facilitate a direct comparison of their operational efficiency, profitability, liquidity, and leverage.
| Ratios | QUALCOMM Incorporated (QCOM) | Arm Holdings plc (ARM) |
|---|---|---|
| ROE | 26.13% | 11.58% |
| ROIC | 13.19% | 10.28% |
| P/E | 32.70 | 141.58 |
| P/B | 8.54 | 16.40 |
| Current Ratio | 2.82 | 5.20 |
| Quick Ratio | 2.10 | 5.20 |
| D/E | 0.70 | 0.05 |
| Debt-to-Assets | 29.54% | 3.99% |
| Interest Coverage | 18.61 | 0 (not available) |
| Asset Turnover | 0.88 | 0.45 |
| Fixed Asset Turnover | 9.44 | 5.61 |
| Payout ratio | 68.67% | 0% |
| Dividend yield | 2.10% | 0% |
Interpretation of the Ratios
QUALCOMM Incorporated
QUALCOMM’s financial ratios show strength in profitability with a favorable net margin of 12.51% and return on equity at 26.13%, supported by a solid return on invested capital of 13.19%. Liquidity ratios like current and quick ratios are robust, while valuation metrics such as P/E and P/B ratios appear stretched, signaling potential overvaluation. The company maintains a consistent dividend with a 2.1% yield, well-covered by free cash flow, reflecting sustainable shareholder returns without excessive payout risks.
Arm Holdings plc American Depositary Shares
Arm’s ratios show a favorable net margin of 19.77%, but its return on equity and return on invested capital are less compelling, with the latter marked unfavorable. The company’s high weighted average cost of capital (23.74%) alongside elevated P/E (141.58) and P/B (16.4) ratios suggest valuation concerns. Arm does not pay dividends, likely prioritizing reinvestment and R&D, consistent with its high quick ratio and minimal debt, indicating a growth-focused strategy without shareholder distributions.
Which one has the best ratios?
QUALCOMM demonstrates a more balanced ratio profile with a majority of favorable metrics, including strong profitability, liquidity, and dividend coverage, despite some valuation concerns. Arm’s profile is mixed, with strengths in margin and liquidity but offset by weaker returns and high valuation multiples. Overall, QUALCOMM’s ratios are more favorable, reflecting a mature and stable financial position compared to Arm’s growth-oriented but riskier stance.
Strategic Positioning
This section compares the strategic positioning of QUALCOMM and Arm Holdings including market position, key segments, and exposure to technological disruption:
QUALCOMM Incorporated
- Leading semiconductor company with strong global presence, facing moderate competitive pressure.
- Operates three segments: QCT (integrated circuits), QTL (technology licensing), and QSI (investments).
- Invests in early-stage tech including 5G and AI; reliant on evolving wireless standards and IP protection.
Arm Holdings plc American Depositary Shares
- Semiconductor IP licensor with significant presence in global markets, facing high volatility.
- Focuses on CPU architecture licensing, microprocessors, and IPs for automotive, computing, and IoT.
- Dependent on licensing and royalties, exposed to shifts in semiconductor design and licensing models.
QUALCOMM vs Arm Holdings Positioning
QUALCOMM adopts a diversified approach with multiple business segments including product sales and licensing, providing broader revenue streams. Arm focuses on licensing and royalties with a concentrated business model, which can yield high margins but may face dependency risks.
Which has the best competitive advantage?
QUALCOMM shows a slightly favorable moat with value creation but declining ROIC, indicating some erosion in profitability. Arm’s moat is unfavorable with value destruction despite stable ROIC, suggesting weaker competitive advantage.
Stock Comparison
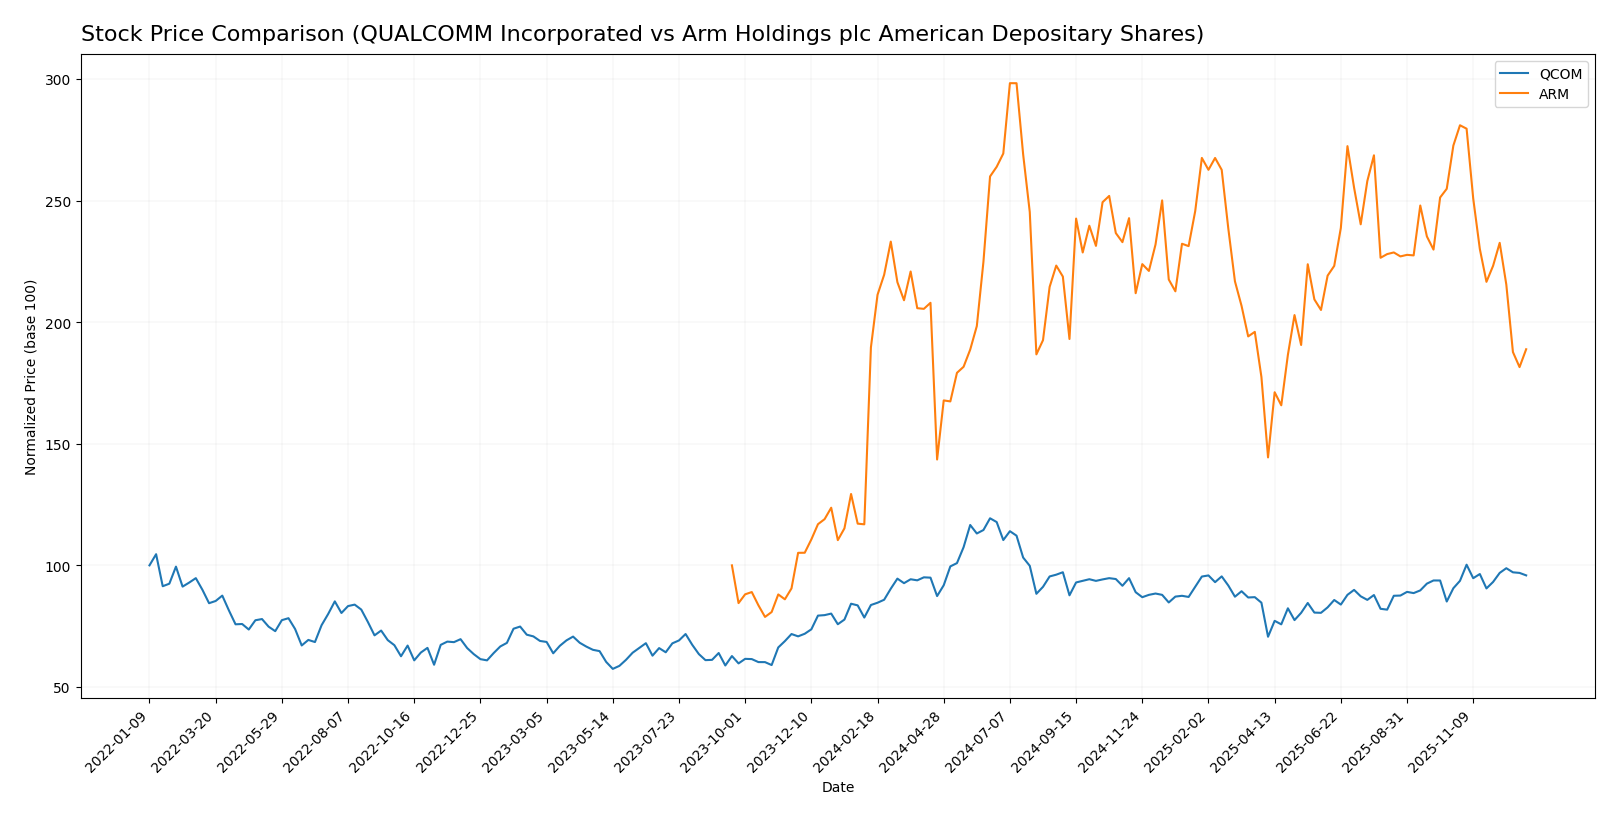
The past 12 months reveal contrasting stock price dynamics, with QUALCOMM Incorporated exhibiting a strong bullish acceleration and Arm Holdings plc facing a mild bearish trend with recent sharp declines.
Trend Analysis
QUALCOMM’s stock delivered a 14.56% gain over the past year, signaling a bullish trend with accelerating upward momentum. Prices ranged between 127.46 and 215.33, supported by moderate volatility (16.17 std deviation).
Arm Holdings showed a slight overall decline of -0.42%, classified as a bearish trend with deceleration. The stock experienced notable volatility (19.03 std deviation) and a wide price range from 87.19 to 181.19, with recent sharp drops.
Comparing both, QUALCOMM outperformed Arm Holdings with a clear positive market trend, while Arm’s marginal loss and recent downturn indicate weaker performance.
Target Prices
Analysts provide a clear target price range reflecting optimistic yet cautious outlooks for these semiconductor leaders.
| Company | Target High | Target Low | Consensus |
|---|---|---|---|
| QUALCOMM Incorporated | 210 | 165 | 189 |
| Arm Holdings plc American Depositary Shares | 210 | 120 | 173.33 |
The consensus target prices suggest potential upside for Qualcomm and Arm compared to their current prices of $172.98 and $114.73, respectively, indicating moderate to strong growth expectations.
Analyst Opinions Comparison
This section compares analysts’ ratings and grades for QUALCOMM Incorporated and Arm Holdings plc American Depositary Shares:
Rating Comparison
QUALCOMM Incorporated Rating
- Rating: B+, indicating a very favorable overall evaluation.
- Discounted Cash Flow Score: 4, considered favorable.
- ROE Score: 5, very favorable, showing strong profit generation efficiency.
- ROA Score: 5, very favorable, reflecting excellent asset use.
- Debt To Equity Score: 1, very unfavorable, indicating high financial risk.
- Overall Score: 3, moderate overall financial standing.
Arm Holdings plc American Depositary Shares Rating
- Rating: B-, also marked as very favorable overall evaluation.
- Discounted Cash Flow Score: 2, considered moderate.
- ROE Score: 3, moderate, indicating average efficiency in profit generation.
- ROA Score: 4, favorable, showing effective asset utilization.
- Debt To Equity Score: 4, favorable, showing lower financial risk.
- Overall Score: 3, moderate overall financial standing.
Which one is the best rated?
QUALCOMM holds higher scores in discounted cash flow, ROE, and ROA, demonstrating stronger profitability and asset use, but has a very unfavorable debt-to-equity score. Arm has better debt management but lower profitability scores. Both share a moderate overall score of 3.
Scores Comparison
The scores comparison between QUALCOMM and Arm Holdings shows the following financial health indicators:
QUALCOMM Scores
- Altman Z-Score: 6.61, indicating a safe zone with low bankruptcy risk.
- Piotroski Score: 7, showing strong financial health and investment potential.
Arm Holdings Scores
- Altman Z-Score: 32.36, well within the safe zone, indicating very low bankruptcy risk.
- Piotroski Score: 7, indicating strong financial health and investment potential.
Which company has the best scores?
Arm Holdings has a significantly higher Altman Z-Score compared to QUALCOMM, signaling stronger financial stability. Both companies share the same Piotroski Score, reflecting equally strong financial health.
Grades Comparison
QUALCOMM Incorporated Grades
The following table shows recent grades assigned to QUALCOMM Incorporated by major grading companies.
| Grading Company | Action | New Grade | Date |
|---|---|---|---|
| Mizuho | Maintain | Outperform | 2025-11-06 |
| Piper Sandler | Maintain | Overweight | 2025-11-06 |
| Wells Fargo | Maintain | Underweight | 2025-11-06 |
| UBS | Maintain | Neutral | 2025-11-06 |
| Rosenblatt | Maintain | Buy | 2025-11-06 |
| B of A Securities | Maintain | Buy | 2025-11-06 |
| JP Morgan | Maintain | Overweight | 2025-11-04 |
| Citigroup | Maintain | Neutral | 2025-10-28 |
| Rosenblatt | Maintain | Buy | 2025-10-28 |
| UBS | Maintain | Neutral | 2025-10-27 |
Overall, QUALCOMM’s grades show a generally positive outlook with several “Buy” and “Outperform” ratings, though some firms maintain neutral or underweight stances, indicating mixed but mostly favorable opinions.
Arm Holdings plc American Depositary Shares Grades
This table displays recent grades from reputable grading companies for Arm Holdings plc American Depositary Shares.
| Grading Company | Action | New Grade | Date |
|---|---|---|---|
| B of A Securities | Maintain | Buy | 2025-12-16 |
| Goldman Sachs | Downgrade | Sell | 2025-12-15 |
| Loop Capital | Maintain | Buy | 2025-11-12 |
| Rosenblatt | Maintain | Buy | 2025-11-06 |
| Barclays | Maintain | Overweight | 2025-11-06 |
| Mizuho | Maintain | Outperform | 2025-11-06 |
| Needham | Maintain | Hold | 2025-11-06 |
| UBS | Maintain | Buy | 2025-11-06 |
| TD Cowen | Maintain | Buy | 2025-11-06 |
| Keybanc | Maintain | Overweight | 2025-11-06 |
Arm Holdings’ grading trend reflects mostly positive ratings with multiple “Buy”, “Overweight”, and “Outperform” grades; however, a recent downgrade to “Sell” by Goldman Sachs introduces some caution.
Which company has the best grades?
Both QUALCOMM and Arm Holdings have predominantly positive grades, but Arm shows a slightly higher frequency of strong “Buy” and “Outperform” ratings despite one notable “Sell” downgrade. This mixed grading could lead to varied investor sentiment and risk considerations.
Strengths and Weaknesses
Below is a comparison table highlighting key strengths and weaknesses of QUALCOMM Incorporated (QCOM) and Arm Holdings plc (ARM) based on the most recent financial and strategic data.
| Criterion | QUALCOMM Incorporated (QCOM) | Arm Holdings plc (ARM) |
|---|---|---|
| Diversification | Strong product diversification with QCT segment at $38.4B and QTL at $5.6B in 2025 | Revenue primarily from licensing and royalties, less diversified |
| Profitability | Favorable profitability: ROIC 13.2%, net margin 12.5%, ROE 26.1% | Lower profitability: ROIC 10.3% (unfavorable vs WACC), net margin 19.8%, ROE 11.6% |
| Innovation | High innovation with strong R&D sustaining leading market positions | Innovation focused on chip architecture licensing, maintaining industry relevance |
| Global presence | Extensive global presence with solid market penetration worldwide | Global licensing footprint but less direct market control than QCOM |
| Market Share | Large market share in mobile chipsets and telecommunications segments | Leading player in processor IP licensing but facing competitive pressures |
Key takeaways: QUALCOMM demonstrates strong diversification and solid profitability despite a recent declining ROIC trend, indicating some caution. Arm shows higher net margins but is currently value destructive with unfavorable ROIC versus cost of capital, reflecting potential risks despite its innovative position in chip architecture licensing.
Risk Analysis
The following table summarizes key risk factors for QUALCOMM Incorporated and Arm Holdings plc based on the latest available data from 2025 and 2026.
| Metric | QUALCOMM Incorporated (QCOM) | Arm Holdings plc (ARM) |
|---|---|---|
| Market Risk | Beta 1.21 – Moderate volatility | Beta 4.25 – High volatility |
| Debt level | Debt/Equity 0.7 (neutral), Debt to Assets 29.5% (favorable) | Debt/Equity 0.05 (favorable), Debt to Assets 4% (favorable) |
| Regulatory Risk | Moderate – US tech sector with IP licensing scrutiny | Elevated – UK-based, exposed to multinational regulations |
| Operational Risk | Moderate – large workforce, diversified operations | Moderate – smaller team, reliance on licensing model |
| Environmental Risk | Low to moderate – tech manufacturing impact | Low – primarily IP licensing, less direct manufacturing |
| Geopolitical Risk | Moderate – US-China trade tensions affect supply chain | High – significant exposure to China, Taiwan, and global markets |
QUALCOMM faces moderate market risk and regulatory challenges but benefits from a strong balance sheet and favorable operational metrics. Arm has higher market volatility and geopolitical risk, with very low debt, but elevated valuation multiples pose investment caution. The most impactful risks likely arise from Arm’s geopolitical exposure and valuation, while QUALCOMM’s regulatory environment and moderate leverage warrant attention.
Which Stock to Choose?
QUALCOMM Incorporated (QCOM) shows a favorable income evolution with 13.66% revenue growth in 2025 and strong profitability metrics, including a 26.13% ROE and 12.51% net margin. It maintains moderate debt levels (net debt to EBITDA 0.62) and holds a very favorable B+ rating.
Arm Holdings plc (ARM) demonstrates impressive income growth with 23.94% revenue rise and strong net margin of 19.77%, but lower profitability ratios such as 11.58% ROE and a very low debt load. Its rating is slightly lower at B-, reflecting some concerns despite favorable income trends.
Investors prioritizing stable profitability and a strong track record might find QCOM’s favorable rating and consistent value creation appealing, while those focused on high growth potential and low debt could view ARM’s robust income growth and financial strength as attractive despite its slightly unfavorable global ratio evaluation.
Disclaimer: Investment carries a risk of loss of initial capital. The past performance is not a reliable indicator of future results. Be sure to understand risks before making an investment decision.
Go Further
I encourage you to read the complete analyses of QUALCOMM Incorporated and Arm Holdings plc American Depositary Shares to enhance your investment decisions: