In the dynamic tech landscape, PTC Inc. and The Trade Desk, Inc. stand out as influential players in software applications, each driving innovation within their niches. PTC focuses on digital transformation and product lifecycle solutions, while The Trade Desk revolutionizes data-driven digital advertising. Both companies share a commitment to cutting-edge technology and market expansion. This article will help you decide which company offers the most promising investment opportunity in 2026.

Table of contents
Companies Overview
I will begin the comparison between PTC Inc. and The Trade Desk, Inc. by providing an overview of these two companies and their main differences.
PTC Inc. Overview
PTC Inc. operates as a software and services company across the Americas, Europe, and Asia Pacific, focusing on digital transformation solutions. It offers platforms like ThingWorx for enterprise innovation, Vuforia for augmented reality, and Onshape for product development. Headquartered in Boston, PTC serves industries with scalable software products and professional services that enhance design, lifecycle management, and analytics.
The Trade Desk, Inc. Overview
The Trade Desk, Inc. is a technology company delivering a cloud-based self-service platform for managing data-driven digital advertising campaigns worldwide. Its platform supports multiple ad formats and devices, catering primarily to advertising agencies and service providers. Based in Ventura, California, The Trade Desk emphasizes optimizing campaign performance through advanced data and value-added services in the advertising sector.
Key similarities and differences
Both companies operate in the technology sector within the software application industry, serving global markets. PTC focuses on enterprise software solutions for product development and digital transformation, while The Trade Desk specializes in digital advertising technology. PTC’s business model centers on software products and professional services, whereas The Trade Desk relies on a cloud platform for ad campaign management and data services, reflecting distinct market applications despite a shared tech base.
Income Statement Comparison
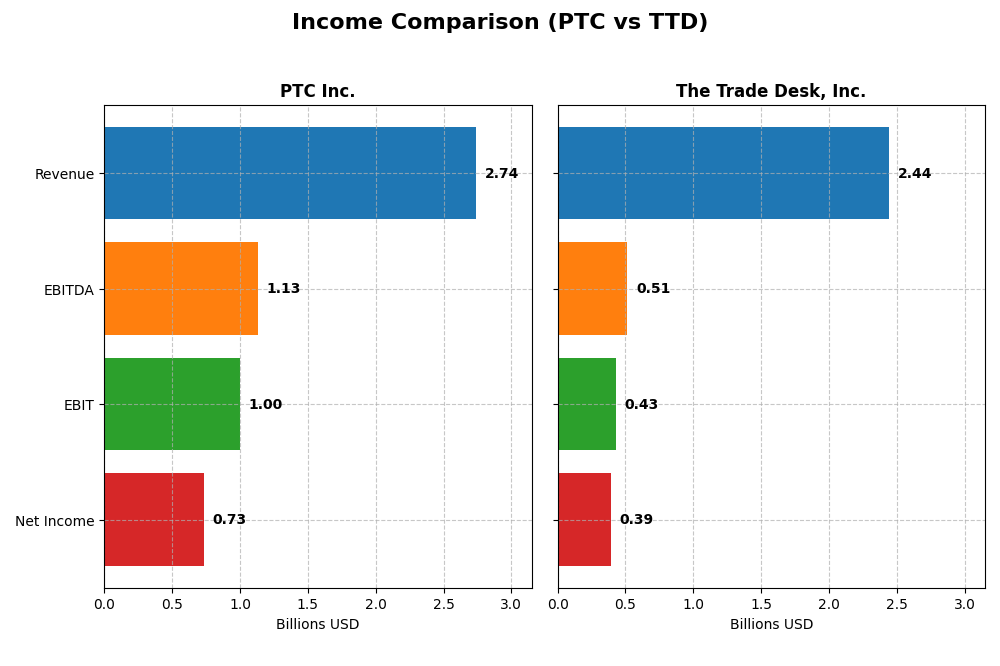
This table compares key income statement metrics for PTC Inc. and The Trade Desk, Inc. for their most recent fiscal years, reflecting their financial performance in USD.
| Metric | PTC Inc. | The Trade Desk, Inc. |
|---|---|---|
| Market Cap | 19.9B | 17.3B |
| Revenue | 2.74B | 2.44B |
| EBITDA | 1.13B | 515M |
| EBIT | 997M | 427M |
| Net Income | 734M | 393M |
| EPS | 6.18 | 0.80 |
| Fiscal Year | 2025 | 2024 |
Income Statement Interpretations
PTC Inc.
PTC Inc. demonstrated consistent revenue and net income growth from 2021 to 2025, with revenue rising from $1.81B to $2.74B and net income from $477M to $734M. Margins remained strong, highlighted by a gross margin of 83.76% and a net margin of 26.8% in 2025. The latest year showed robust growth, with a 19.18% revenue increase and a significant 63.66% net margin improvement.
The Trade Desk, Inc.
The Trade Desk, Inc. experienced rapid revenue growth from $837M in 2020 to $2.44B in 2024, alongside net income gains from $137.8M to $393.1M. Margins were favorable but less stable, with a gross margin of 80.69% and a net margin of 16.08% in 2024. The most recent year saw a strong 25.63% revenue increase and a 74.86% net margin growth, despite a long-term net margin decline.
Which one has the stronger fundamentals?
Both companies show favorable income statement evaluations with robust revenue and net income growth. PTC maintains higher and more stable margins, reflecting consistent profitability, while The Trade Desk’s rapid growth comes with more margin volatility. PTC’s overall margin stability and strong one-year improvements suggest a solid fundamental base, contrasted with The Trade Desk’s impressive expansion but less consistent margin trends.
Financial Ratios Comparison
This table compares the latest key financial ratios of PTC Inc. and The Trade Desk, Inc. for their most recent fiscal years, offering a snapshot of profitability, liquidity, valuation, and leverage metrics.
| Ratios | PTC Inc. (2025) | The Trade Desk, Inc. (2024) |
|---|---|---|
| ROE | 19.18% | 13.33% |
| ROIC | 14.43% | 10.02% |
| P/E | 33.19 | 146.77 |
| P/B | 6.37 | 19.56 |
| Current Ratio | 1.12 | 1.86 |
| Quick Ratio | 1.12 | 1.86 |
| D/E (Debt-to-Equity) | 0.36 | 0.11 |
| Debt-to-Assets | 20.7% | 5.11% |
| Interest Coverage | 12.76 | 0 (not reported) |
| Asset Turnover | 0.41 | 0.40 |
| Fixed Asset Turnover | 15.58 | 5.17 |
| Payout Ratio | 0% | 0% |
| Dividend Yield | 0% | 0% |
Interpretation of the Ratios
PTC Inc.
PTC exhibits a generally favorable ratio profile with strong net margin at 26.8% and return on equity at 19.18%, indicating effective profitability and capital use. However, its elevated price-to-earnings ratio of 33.19 and price-to-book of 6.37 suggest expensive valuation. The company does not pay dividends, likely prioritizing reinvestment or growth, as indicated by zero dividend yield and no payout.
The Trade Desk, Inc.
The Trade Desk shows a mixed ratio picture with a decent net margin of 16.08% and favorable asset management metrics, yet its high price-to-earnings of 146.77 and price-to-book of 19.56 point to overvaluation risks. Like PTC, it does not distribute dividends, likely reinvesting earnings to fuel expansion or innovation, reflected by zero dividend yield.
Which one has the best ratios?
Both companies share a favorable overall ratio evaluation at 57.14%, but PTC has stronger returns and more balanced leverage metrics, while The Trade Desk faces higher valuation multiples. Neither pays dividends, suggesting focus on growth or reinvestment. The choice depends on weighing profitability against valuation risks.
Strategic Positioning
This section compares the strategic positioning of PTC and The Trade Desk, Inc., including market position, key segments, and exposure to technological disruption:
PTC
- Established software application provider with $19.9B market cap and moderate competitive pressure.
- Focuses on software products like CAD, PLM, AR, and professional services driving growth.
- Exposure to digital transformation technologies such as AR and SaaS platforms supports adaptability.
The Trade Desk, Inc.
- Digital advertising technology company with $17.3B market cap facing high competition in ad tech sector.
- Operates a cloud-based platform for data-driven digital advertising campaigns across multiple media channels.
- Relies on cloud-based ad tech innovations but faces risks from rapid changes in digital advertising landscape.
PTC vs The Trade Desk, Inc. Positioning
PTC has a diversified portfolio across software and professional services, offering stable revenue streams. The Trade Desk concentrates on digital advertising technology, which is more volatile but scalable. PTC’s broad segments provide resilience; The Trade Desk’s focus enables specialization but may increase risk exposure.
Which has the best competitive advantage?
PTC exhibits a very favorable moat with growing ROIC above WACC, indicating durable competitive advantage and value creation. The Trade Desk shows a slightly unfavorable moat, with declining ROIC and value erosion, reflecting weaker competitive positioning.
Stock Comparison
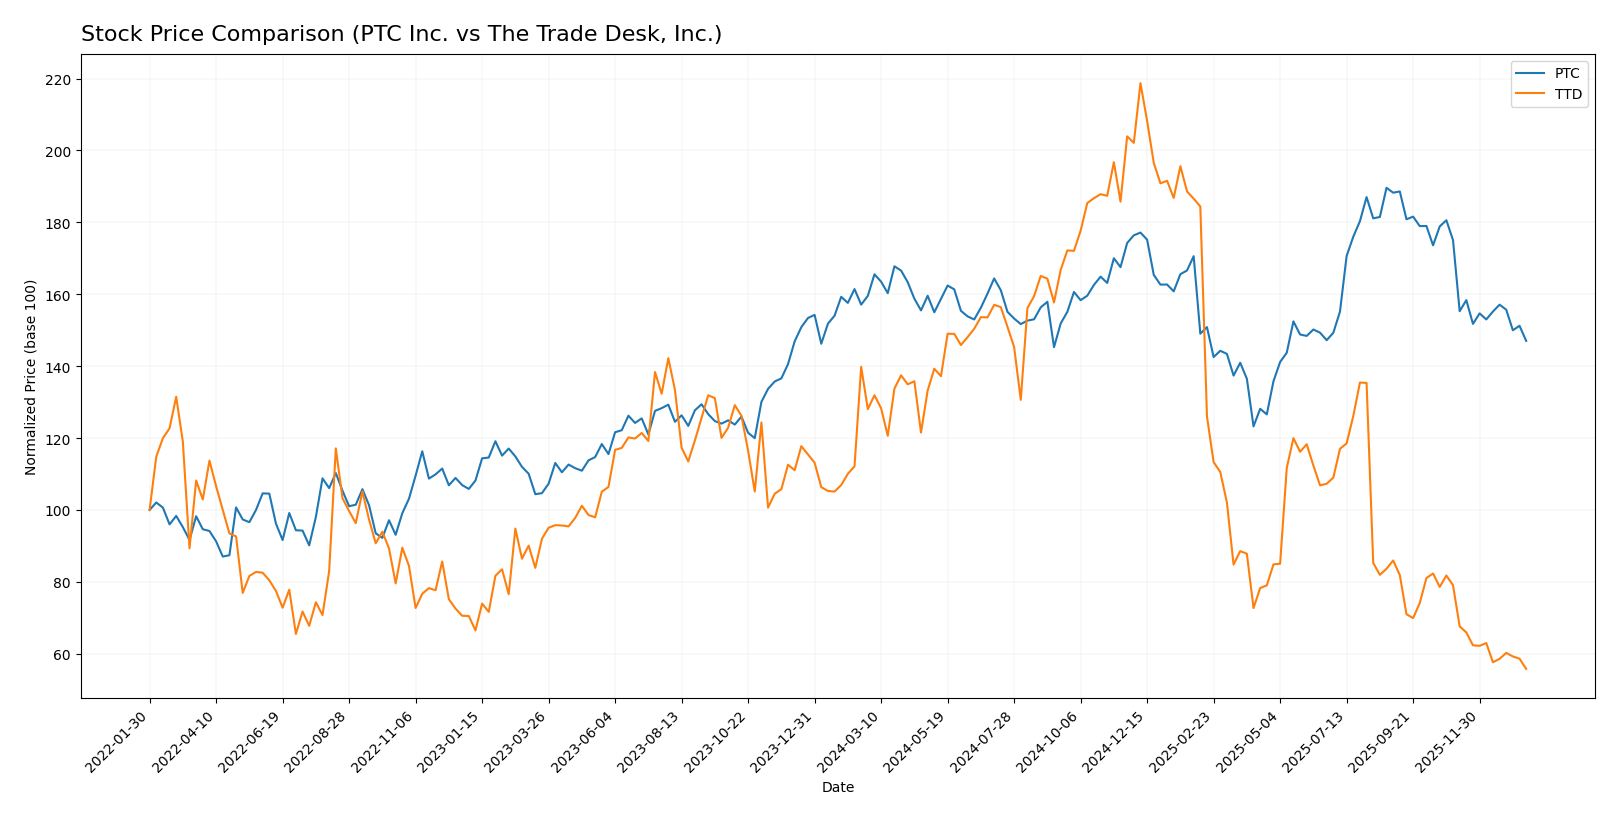
The stock prices of PTC Inc. and The Trade Desk, Inc. have both experienced notable declines over the past year, reflecting bearish trends with decelerating momentum and marked differences in volatility and trading volume dynamics.
Trend Analysis
PTC Inc.’s stock shows a bearish trend over the past 12 months with a price decline of 7.84%, a decelerating downtrend, and substantial volatility indicated by a 15.47 std deviation. Recent months confirm continued weakness with a 16.01% drop.
The Trade Desk, Inc. displays a pronounced bearish trend with a 56.43% price decrease over the last year, accompanied by deceleration and higher volatility (28.36 std deviation). The recent period shows a further 29.44% decline and seller dominance.
Comparing both, The Trade Desk, Inc. has delivered the lowest market performance with a far steeper price fall than PTC Inc., despite both stocks trending downward with decelerating momentum.
Target Prices
Here is the current target price consensus for selected technology companies based on verified analyst data.
| Company | Target High | Target Low | Consensus |
|---|---|---|---|
| PTC Inc. | 255 | 120 | 213.25 |
| The Trade Desk, Inc. | 98 | 39 | 56.73 |
Analysts expect PTC Inc. shares to appreciate significantly above the current price of $166.75, reflecting confidence in its software solutions. The Trade Desk’s target consensus at $56.73 also suggests upside potential compared to its current price of $35.48.
Analyst Opinions Comparison
This section compares analysts’ ratings and grades for PTC Inc. and The Trade Desk, Inc.:
Rating Comparison
PTC Rating
- Rating: B+ indicating a very favorable overall assessment.
- Discounted Cash Flow Score: 4, showing favorable valuation based on cash flow.
- ROE Score: 4, reflecting efficient profit generation from equity.
- ROA Score: 5, very favorable use of assets to generate earnings.
- Debt To Equity Score: 2, moderate financial risk with some reliance on debt.
- Overall Score: 3, a moderate summary score of financial standing.
TTD Rating
- Rating: B indicating a very favorable overall assessment.
- Discounted Cash Flow Score: 4, also favorable for valuation judgments.
- ROE Score: 4, similarly efficient in generating shareholder returns.
- ROA Score: 4, favorable but less so than PTC in asset utilization.
- Debt To Equity Score: 3, slightly higher financial risk compared to PTC.
- Overall Score: 3, identical moderate overall score to PTC.
Which one is the best rated?
Based on the data, PTC holds a slightly better rating (B+) than TTD (B), with a stronger ROA score and lower debt-to-equity risk, though both share the same overall moderate score.
Scores Comparison
The scores comparison between PTC and The Trade Desk highlights their financial health and bankruptcy risk:
PTC Scores
- Altman Z-Score: 5.67, indicating a safe zone, low bankruptcy risk.
- Piotroski Score: 8, classified as very strong financial health.
The Trade Desk Scores
- Altman Z-Score: 4.30, indicating a safe zone, low bankruptcy risk.
- Piotroski Score: 5, classified as average financial health.
Which company has the best scores?
PTC has higher scores in both Altman Z-Score and Piotroski Score, showing stronger financial health and lower bankruptcy risk compared to The Trade Desk based on the provided data.
Grades Comparison
Here is a detailed comparison of the recent grades assigned to PTC Inc. and The Trade Desk, Inc.:
PTC Inc. Grades
The following table summarizes grades assigned by recognized financial institutions to PTC Inc.:
| Grading Company | Action | New Grade | Date |
|---|---|---|---|
| Piper Sandler | Maintain | Neutral | 2025-11-07 |
| Rosenblatt | Maintain | Buy | 2025-11-06 |
| Rosenblatt | Maintain | Buy | 2025-10-30 |
| Oppenheimer | Maintain | Outperform | 2025-07-31 |
| Rosenblatt | Maintain | Buy | 2025-07-31 |
| Barclays | Maintain | Overweight | 2025-07-31 |
| Stifel | Maintain | Buy | 2025-07-31 |
| Keybanc | Maintain | Overweight | 2025-07-31 |
| RBC Capital | Maintain | Outperform | 2025-07-31 |
| Piper Sandler | Maintain | Neutral | 2025-07-31 |
PTC Inc. displays a generally positive trend in grades, with multiple “Buy” and “Outperform” ratings alongside some “Neutral” opinions.
The Trade Desk, Inc. Grades
The following table details recent grades from established grading companies for The Trade Desk, Inc.:
| Grading Company | Action | New Grade | Date |
|---|---|---|---|
| Morgan Stanley | Maintain | Equal Weight | 2026-01-13 |
| Wells Fargo | Maintain | Equal Weight | 2026-01-12 |
| Cantor Fitzgerald | Maintain | Neutral | 2026-01-08 |
| Wolfe Research | Maintain | Outperform | 2026-01-06 |
| Guggenheim | Maintain | Buy | 2026-01-05 |
| Jefferies | Maintain | Hold | 2025-12-11 |
| Wedbush | Maintain | Neutral | 2025-12-08 |
| DA Davidson | Maintain | Buy | 2025-11-10 |
| Truist Securities | Maintain | Buy | 2025-11-07 |
| Wells Fargo | Maintain | Equal Weight | 2025-11-07 |
The Trade Desk, Inc. presents a mixed but generally favorable set of grades, with “Buy,” “Outperform,” and “Equal Weight” ratings, indicating cautious optimism.
Which company has the best grades?
Both companies share a “Buy” consensus rating; however, PTC Inc. has a higher concentration of “Buy” and “Outperform” grades, whereas The Trade Desk, Inc. shows more “Equal Weight” and “Neutral” ratings. This suggests PTC Inc.’s grades may reflect stronger immediate upside potential, while The Trade Desk’s grades indicate a more cautious market view. Investors might interpret these distinctions when considering portfolio allocation and risk tolerance.
Strengths and Weaknesses
Below is a comparative overview of strengths and weaknesses for PTC Inc. and The Trade Desk, Inc. based on the latest available data.
| Criterion | PTC Inc. | The Trade Desk, Inc. |
|---|---|---|
| Diversification | Strong revenue mix: License (1.16B), Support & Cloud Services (1.47B), Technology Services (107M) | Focused on digital advertising platform, less diversified |
| Profitability | High net margin at 26.8%, ROIC 14.43%, ROE 19.18% (favorable) | Moderate net margin 16.08%, ROIC 10.02%, ROE 13.33% (neutral to favorable) |
| Innovation | Consistent growth in ROIC (+42%), strong competitive moat | Declining ROIC (-8.5%), slightly unfavorable moat status |
| Global presence | Established global footprint in industrial software | Global but concentrated in programmatic advertising |
| Market Share | Solid position in industrial software licensing and services | Leading player in digital advertising but high competition |
In summary, PTC demonstrates a robust and growing competitive advantage with strong profitability and diversification, making it a more stable investment option. The Trade Desk shows growth potential but faces challenges with declining profitability and a narrower business focus, suggesting higher risk.
Risk Analysis
Below is a comparative overview of key risks for PTC Inc. and The Trade Desk, Inc. based on the most recent data available in 2026:
| Metric | PTC Inc. | The Trade Desk, Inc. |
|---|---|---|
| Market Risk | Moderate (Beta 1.01) | Moderate-High (Beta 1.11) |
| Debt level | Low (D/E 0.36) | Very Low (D/E 0.11) |
| Regulatory Risk | Moderate | Moderate |
| Operational Risk | Moderate | Moderate |
| Environmental Risk | Low | Low |
| Geopolitical Risk | Moderate | Moderate |
PTC and The Trade Desk both face moderate market and regulatory risks, with The Trade Desk showing slightly higher market volatility. Debt levels are low for both, reducing financial risk. The most impactful risk remains market fluctuations, especially given elevated valuations, which could affect investor returns.
Which Stock to Choose?
PTC Inc. shows favorable income evolution with a 19.18% revenue growth in 2025 and strong profitability metrics such as a 26.8% net margin and 19.18% ROE. Its financial ratios are mostly favorable, with a low debt level and a very favorable moat rating indicating durable competitive advantage.
The Trade Desk, Inc. displays robust income growth of 25.63% in 2024 and positive profitability with a 16.08% net margin. Financial ratios are similarly favorable, including low debt, though its moat rating is slightly unfavorable due to declining ROIC, signaling challenges in value creation.
Investors prioritizing durable competitive advantages and stable profitability might find PTC’s strong moat and income statement favorable, while those focused on higher revenue growth and operational scale could see The Trade Desk’s profile as appealing despite its declining ROIC trend.
Disclaimer: Investment carries a risk of loss of initial capital. The past performance is not a reliable indicator of future results. Be sure to understand risks before making an investment decision.
Go Further
I encourage you to read the complete analyses of PTC Inc. and The Trade Desk, Inc. to enhance your investment decisions: