Investors seeking opportunities in the technology sector often face tough choices between established giants and dynamic newcomers. PTC Inc. and ServiceTitan, Inc. both operate within the software application industry, yet they serve distinct but overlapping markets through innovative digital solutions. PTC focuses on product lifecycle and augmented reality platforms, while ServiceTitan excels in field service management software. This article will help you identify which company offers the most compelling investment potential in 2026.
Table of contents
Companies Overview
I will begin the comparison between PTC Inc. and ServiceTitan, Inc. by providing an overview of these two companies and their main differences.
PTC Inc. Overview
PTC Inc. is a technology company focused on software and services, operating primarily in the Americas, Europe, and Asia Pacific. Its mission is to enable enterprises to digitally transform their businesses through innovative solutions like the ThingWorx platform and augmented reality tools. Founded in 1985 and headquartered in Boston, PTC serves a global market with products for product lifecycle management, CAD design, and application lifecycle management.
ServiceTitan, Inc. Overview
ServiceTitan, Inc. is a technology firm specializing in software for field service management, supporting installation, maintenance, and service of residential and commercial systems. Founded in 2008 and based in Glendale, California, the company targets the service infrastructure sector. ServiceTitan provides solutions tailored to streamline field operations and improve service delivery through its software platform.
Key similarities and differences
Both PTC and ServiceTitan operate in the technology sector with a focus on software applications, targeting business process improvement. PTC’s business model centers on product development platforms and lifecycle management tools, serving a broad industrial base. In contrast, ServiceTitan focuses on field service software for infrastructure maintenance, emphasizing operational efficiency in service industries. Their market sizes and employee counts also differ significantly, reflecting distinct scopes and stages of growth.
Income Statement Comparison
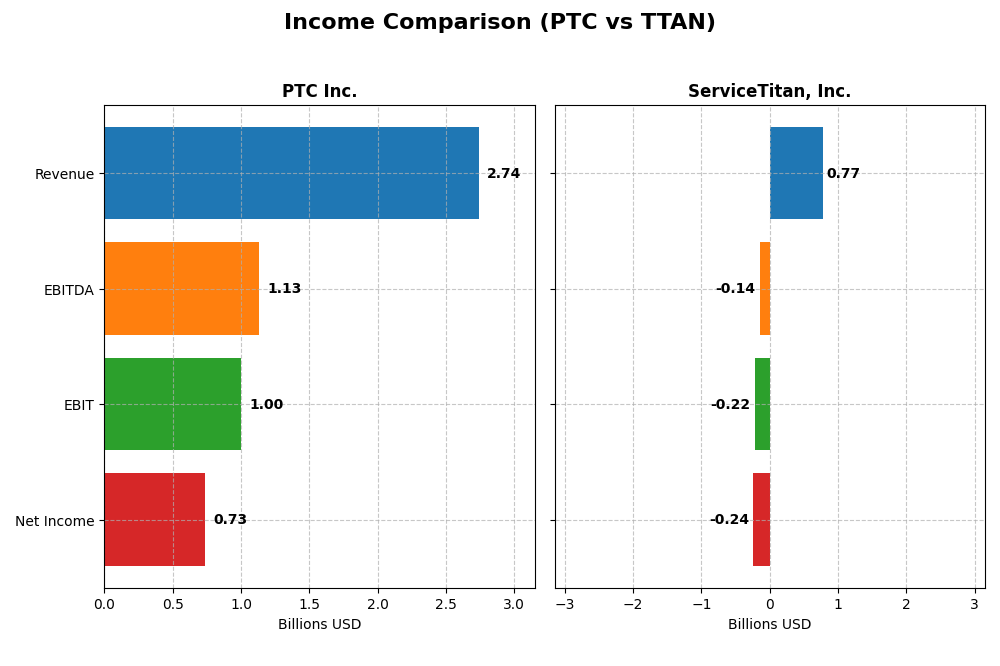
This table presents a side-by-side comparison of key income statement metrics for PTC Inc. and ServiceTitan, Inc. for the most recent fiscal year available.
| Metric | PTC Inc. | ServiceTitan, Inc. |
|---|---|---|
| Market Cap | 19.9B | 8.5B |
| Revenue | 2.74B | 772M |
| EBITDA | 1.13B | -141M |
| EBIT | 997M | -221M |
| Net Income | 734M | -239M |
| EPS | 6.18 | -8.53 |
| Fiscal Year | 2025 | 2025 |
Income Statement Interpretations
PTC Inc.
From 2021 to 2025, PTC Inc. demonstrated a consistent upward trajectory in revenue and net income, with revenue reaching $2.74B and net income $734M in 2025. Margins remained strong and stable, with a gross margin of 83.8% and a net margin of 26.8%. The 2025 fiscal year showed marked improvements in growth rates and profitability, including a nearly 20% revenue increase and a 64% rise in net margin.
ServiceTitan, Inc.
ServiceTitan’s revenue grew significantly from $468M in 2023 to $772M in 2025, reflecting a 65% increase over the period. However, the company posted net losses throughout, with a net loss of $239M in 2025 despite a favorable gross margin of 64.9%. Margins were impacted by high operating expenses, and the 2025 year showed a decline in EBIT and EPS, signaling ongoing profitability challenges despite revenue growth.
Which one has the stronger fundamentals?
PTC exhibits stronger fundamentals with favorable margins, consistent net income growth, and improved profitability in 2025. In contrast, ServiceTitan, while growing revenue rapidly, continues to face net losses and negative EBIT margins. PTC’s stable and improving earnings quality contrasts with ServiceTitan’s higher risk profile due to ongoing operating losses and declining earnings per share.
Financial Ratios Comparison
The table below compares key financial ratios for PTC Inc. and ServiceTitan, Inc. based on their most recent fiscal year data, providing insights into profitability, liquidity, leverage, and market valuation.
| Ratios | PTC Inc. (2025 FY) | ServiceTitan, Inc. (2025 FY) |
|---|---|---|
| ROE | 19.18% | -16.44% |
| ROIC | 14.43% | -14.11% |
| P/E | 33.19 | -18.12 |
| P/B | 6.37 | 2.98 |
| Current Ratio | 1.12 | 3.74 |
| Quick Ratio | 1.12 | 3.74 |
| D/E | 0.36 | 0.11 |
| Debt-to-Assets | 20.70% | 9.35% |
| Interest Coverage | 12.76 | -14.82 |
| Asset Turnover | 0.41 | 0.44 |
| Fixed Asset Turnover | 15.58 | 9.57 |
| Payout Ratio | 0 | 0 |
| Dividend Yield | 0 | 0 |
Interpretation of the Ratios
PTC Inc.
PTC Inc. shows mostly strong financial ratios with favorable net margin at 26.8%, ROE of 19.18%, and ROIC of 14.43%, indicating solid profitability and efficient capital use. Some concerns arise from high P/E (33.19) and P/B (6.37) ratios which may reflect overvaluation risks. The company does not pay dividends, likely focusing on reinvestment and growth.
ServiceTitan, Inc.
ServiceTitan presents weak profitability ratios with a negative net margin of -30.98%, ROE of -16.44%, and ROIC of -14.11%, signaling ongoing losses and operational challenges. Despite a strong current ratio of 3.74, its negative interest coverage ratio (-14.26) is concerning. The company also pays no dividends, consistent with its high growth and reinvestment phase.
Which one has the best ratios?
PTC Inc. holds the advantage with a greater proportion of favorable ratios including profitability and leverage metrics, supporting a stable financial profile. ServiceTitan’s ratios mostly reflect operational losses and financial strain, resulting in a slightly unfavorable overall evaluation. PTC’s cautious leverage and profitability contrast with ServiceTitan’s ongoing negative returns.
Strategic Positioning
This section compares the strategic positioning of PTC and ServiceTitan, including market position, key segments, and exposure to technological disruption:
PTC
- Established market player with significant competitive pressures in software applications.
- Diverse software and services portfolio, including digital transformation and product lifecycle management.
- Invests in innovative AR and SaaS solutions, adapting to digital transformation trends.
ServiceTitan
- Emerging competitor focused on field service software market.
- Concentrated on platform and subscription revenues in field services.
- Limited explicit exposure to technological disruption from the data provided.
PTC vs ServiceTitan Positioning
PTC exhibits a diversified approach spanning multiple software products and professional services, offering scalability and innovation. ServiceTitan maintains a more concentrated focus on field service management software, potentially limiting breadth but allowing specialization.
Which has the best competitive advantage?
Based on MOAT evaluation, PTC demonstrates a very favorable competitive advantage with growing ROIC and value creation, while ServiceTitan shows unfavorable MOAT status, shedding value despite stable profitability.
Stock Comparison
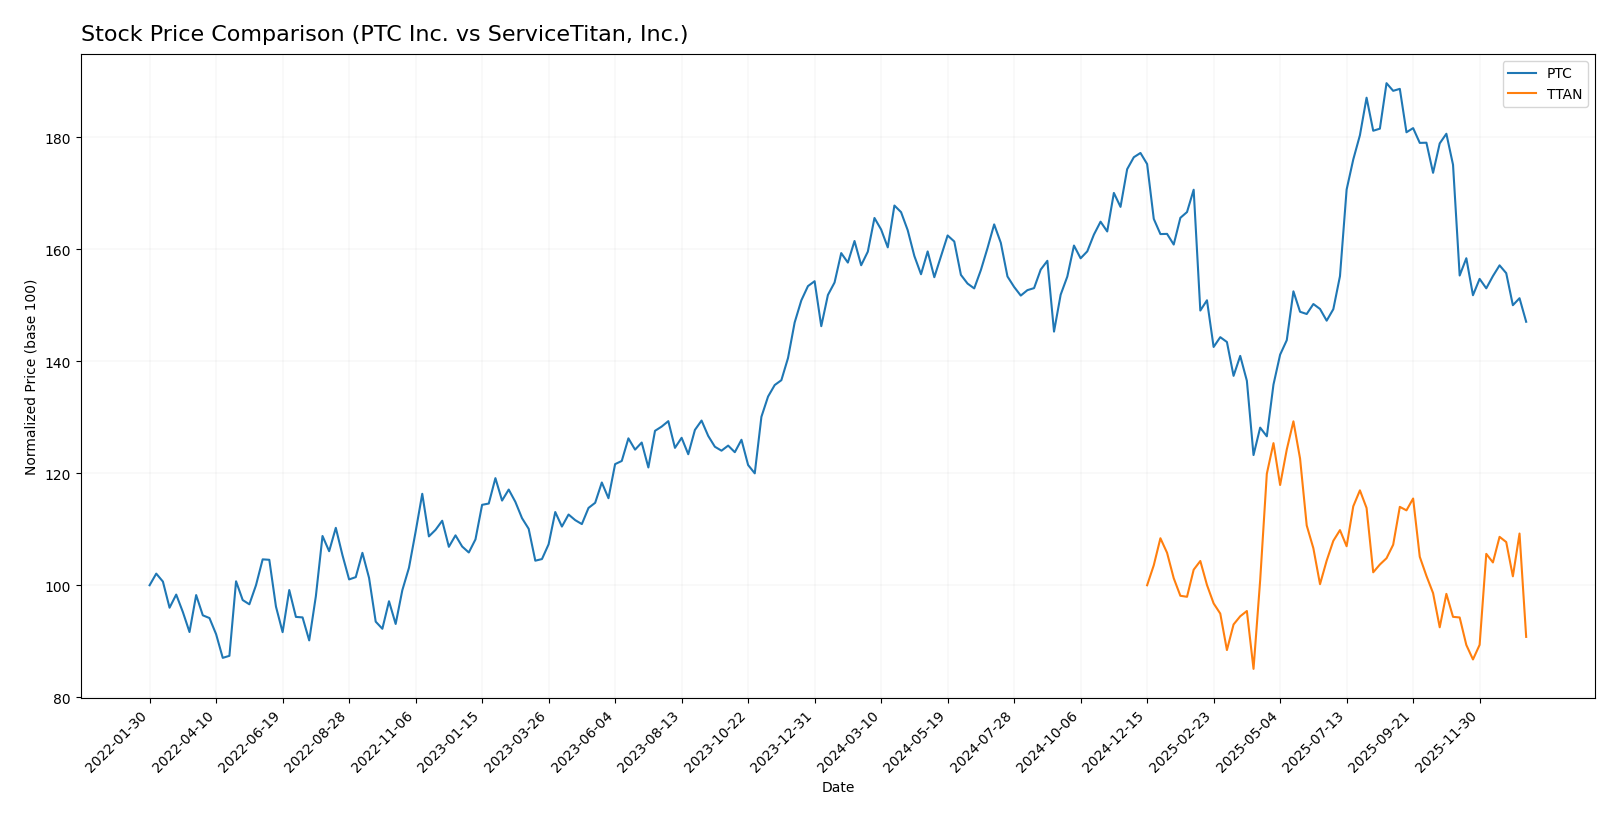
The stock price movements of PTC Inc. and ServiceTitan, Inc. over the past 12 months reveal notable bearish trends with varying acceleration patterns and trading volumes, highlighting distinct dynamics in their market performance.
Trend Analysis
PTC Inc. recorded a -7.84% price change over the past year, indicating a bearish trend with deceleration. The stock showed a high volatility level with a 15.47 standard deviation and ranged between 215.05 and 139.77.
ServiceTitan, Inc. experienced a -9.22% price change, also bearish but with accelerating downward momentum. Its volatility was lower at 9.86 standard deviation, with prices fluctuating from 129.26 down to 85.07.
Comparing both, PTC delivered a smaller negative return than ServiceTitan, thus showing relatively better market performance despite both trending downwards over the analyzed period.
Target Prices
Analyst consensus target prices indicate a positive outlook for both PTC Inc. and ServiceTitan, Inc.
| Company | Target High | Target Low | Consensus |
|---|---|---|---|
| PTC Inc. | 255 | 120 | 213.25 |
| ServiceTitan, Inc. | 145 | 117 | 132.44 |
For PTC Inc., the consensus target price of 213.25 suggests upside potential from the current price of 166.75. ServiceTitan’s target consensus of 132.44 also indicates expected growth above its current price of 90.78, reflecting optimistic analyst sentiment.
Analyst Opinions Comparison
This section compares analysts’ ratings and financial scores for PTC Inc. and ServiceTitan, Inc.:
Rating Comparison
PTC Rating
- Rating: B+ indicating a very favorable overall assessment by analysts.
- Discounted Cash Flow Score: 4, considered favorable for valuation metrics.
- ROE Score: 4, favorable for efficient profit generation from equity.
- ROA Score: 5, very favorable for effective asset utilization.
- Debt To Equity Score: 2, moderate financial risk with balanced leverage.
- Overall Score: 3, moderate overall financial standing as assessed by analysts.
TTAN Rating
- Rating: C- reflecting a very unfavorable overall assessment by analysts.
- Discounted Cash Flow Score: 1, very unfavorable, indicating poor valuation.
- ROE Score: 1, very unfavorable, showing low efficiency in generating profits.
- ROA Score: 1, very unfavorable, indicating poor asset utilization.
- Debt To Equity Score: 3, moderate score reflecting average financial risk.
- Overall Score: 1, very unfavorable financial standing based on scores.
Which one is the best rated?
Based strictly on the provided data, PTC is clearly better rated than ServiceTitan. PTC holds a strong B+ rating with favorable to very favorable scores across key financial metrics, while ServiceTitan scores are very unfavorable overall.
Scores Comparison
Here is a comparison of the Altman Z-Score and Piotroski Score for the two companies:
PTC Scores
- Altman Z-Score: 5.67, indicating a safe zone status
- Piotroski Score: 8, classified as very strong
TTAN Scores
- Altman Z-Score: 15.74, also in the safe zone
- Piotroski Score: 6, classified as average
Which company has the best scores?
TTAN has a higher Altman Z-Score, showing stronger financial stability, while PTC has a better Piotroski Score, reflecting stronger financial health. Each leads in a different metric based on the data provided.
Grades Comparison
Here is a comparison of recent grades and ratings from verifiable grading companies for PTC Inc. and ServiceTitan, Inc.:
PTC Inc. Grades
The following table summarizes recent grades and actions from reputable grading firms for PTC Inc.:
| Grading Company | Action | New Grade | Date |
|---|---|---|---|
| Piper Sandler | Maintain | Neutral | 2025-11-07 |
| Rosenblatt | Maintain | Buy | 2025-11-06 |
| Rosenblatt | Maintain | Buy | 2025-10-30 |
| Oppenheimer | Maintain | Outperform | 2025-07-31 |
| Rosenblatt | Maintain | Buy | 2025-07-31 |
| Barclays | Maintain | Overweight | 2025-07-31 |
| Stifel | Maintain | Buy | 2025-07-31 |
| Keybanc | Maintain | Overweight | 2025-07-31 |
| RBC Capital | Maintain | Outperform | 2025-07-31 |
| Piper Sandler | Maintain | Neutral | 2025-07-31 |
Overall, PTC Inc.’s grades predominantly indicate a Buy or Outperform stance, with some Neutral and Overweight ratings, showing general confidence in the stock.
ServiceTitan, Inc. Grades
The table below presents recent grades and actions from credible grading companies for ServiceTitan, Inc.:
| Grading Company | Action | New Grade | Date |
|---|---|---|---|
| Piper Sandler | Maintain | Overweight | 2025-12-05 |
| BMO Capital | Maintain | Outperform | 2025-12-05 |
| TD Cowen | Maintain | Buy | 2025-12-05 |
| Morgan Stanley | Maintain | Equal Weight | 2025-12-05 |
| BMO Capital | Maintain | Outperform | 2025-11-20 |
| Wells Fargo | Maintain | Overweight | 2025-09-19 |
| Stifel | Maintain | Buy | 2025-09-19 |
| Piper Sandler | Maintain | Overweight | 2025-09-19 |
| Canaccord Genuity | Maintain | Buy | 2025-09-19 |
| Citigroup | Maintain | Neutral | 2025-09-09 |
ServiceTitan, Inc. receives mostly Buy, Outperform, and Overweight grades, with one Equal Weight and one Neutral rating, reflecting a positive outlook.
Which company has the best grades?
Both companies have a consensus “Buy” rating, but PTC Inc. shows a stronger presence of Outperform and Buy grades, while ServiceTitan has more Overweight and Buy grades with a few Neutral or Equal Weight ratings. Investors might interpret PTC’s higher concentration of Outperform ratings as a slightly stronger endorsement, potentially implying greater confidence in its future performance.
Strengths and Weaknesses
Below is a comparison of key strengths and weaknesses for PTC Inc. and ServiceTitan, Inc. based on the latest available data.
| Criterion | PTC Inc. | ServiceTitan, Inc. |
|---|---|---|
| Diversification | Strong diversification with License, Technology Service, and Support & Cloud Services segments generating $2.9B total revenue in 2025. | Revenue mainly from Platform and Subscription, totaling about $1.3B in 2025, less diversified. |
| Profitability | High profitability with 26.8% net margin and 19.18% ROE; ROIC at 14.43% well above WACC (8.35%). | Negative profitability: -30.98% net margin, -16.44% ROE, and -14.11% ROIC, below WACC (4.95%). |
| Innovation | Demonstrates durable competitive advantage with growing ROIC (+42.4% over 2021-25). | Innovation impact unclear; ROIC trend neutral (+1.7%) but overall value destroying. |
| Global presence | Strong global footprint supporting diverse product lines and services. | More focused market presence, potentially limiting global reach. |
| Market Share | Established leader in CAD and PLM software markets with robust customer base. | Rapidly growing but still emerging in the service management software space. |
Key takeaways: PTC Inc. stands out with strong profitability, diversification, and a durable moat, making it a safer investment choice. ServiceTitan faces profitability challenges and limited diversification, implying higher risk for investors. Caution is advised when considering ServiceTitan for long-term holdings.
Risk Analysis
Below is a comparative risk table for PTC Inc. and ServiceTitan, Inc. based on the most recent 2025 fiscal year data:
| Metric | PTC Inc. | ServiceTitan, Inc. |
|---|---|---|
| Market Risk | Beta 1.01, moderate volatility | Beta -0.85, inverse market correlation |
| Debt level | Debt/Equity 0.36, favorable | Debt/Equity 0.11, low risk |
| Regulatory Risk | Moderate, tech sector compliance | Moderate, software industry regulations |
| Operational Risk | Established platform, stable ops | Growth phase, higher operational uncertainty |
| Environmental Risk | Low, software focus | Low, software focus |
| Geopolitical Risk | Moderate, global operations | Moderate, US-focused but exposed |
In synthesis, PTC’s market and operational risks are moderate but balanced by solid debt management and strong financial health. ServiceTitan shows lower financial leverage but faces higher operational risk due to its growth stage and negative profitability metrics. The most impactful risk for ServiceTitan is its sustained negative margins and return on equity, while PTC’s key risks relate to valuation multiples and market sensitivity. Caution is advised for ServiceTitan until profitability stabilizes.
Which Stock to Choose?
PTC Inc. shows strong income growth with a 19.18% revenue increase in 2025 and favorable profitability metrics including a 26.8% net margin and 19.18% ROE. Its debt levels are moderate with a net debt to EBITDA of 1.05, and its overall rating is very favorable at B+.
ServiceTitan, Inc. experiences revenue growth of 25.64% in 2025 but suffers from negative profitability, with a net margin of -30.98% and ROE of -16.44%. The company carries low debt, reflected in a favorable debt-to-equity ratio, yet holds a lower overall rating of C- and unfavorable financial ratios.
For investors prioritizing financial stability and durable competitive advantage, PTC’s very favorable rating and strong income and ratio evaluations could appear more attractive. Conversely, those focused on high growth potential despite current profitability challenges might find ServiceTitan’s profile more aligned with a risk-tolerant strategy.
Disclaimer: Investment carries a risk of loss of initial capital. The past performance is not a reliable indicator of future results. Be sure to understand risks before making an investment decision.
Go Further
I encourage you to read the complete analyses of PTC Inc. and ServiceTitan, Inc. to enhance your investment decisions: