In today’s fast-evolving technology landscape, The Trade Desk, Inc. and Perfect Corp. stand out as innovative players in the software application sector. While The Trade Desk excels in digital advertising platforms, Perfect Corp. leads in AI-driven beauty and fashion tech solutions. Their shared focus on leveraging cutting-edge technology makes them compelling candidates for comparison. Join me as we explore which company holds the most promise for your investment portfolio.
Table of contents
Companies Overview
I will begin the comparison between The Trade Desk and Perfect Corp. by providing an overview of these two companies and their main differences.
The Trade Desk Overview
The Trade Desk, Inc. operates a self-service cloud-based platform enabling buyers to create, manage, and optimize data-driven digital advertising campaigns across various ad formats and devices. Founded in 2009 and headquartered in Ventura, California, it serves advertising agencies and service providers globally. The company holds a strong position in the software application industry with a market cap of approximately 17.3B USD.
Perfect Corp. Overview
Perfect Corp. offers SaaS artificial intelligence and augmented reality solutions tailored for beauty and fashion tech businesses. Its services include virtual try-on technologies and AI-powered facial analysis tools. Established in 2015 and based in New Taipei City, Taiwan, Perfect Corp. operates in the software application sector with a market cap near 179M USD, focusing on innovative AR and AI applications.
Key similarities and differences
Both companies are technology firms in the software application industry, leveraging advanced digital solutions to serve business clients. While The Trade Desk focuses on data-driven digital advertising platforms, Perfect Corp. specializes in AI and AR technologies for beauty and fashion sectors. The Trade Desk commands a significantly larger market cap and global presence, whereas Perfect Corp. is more niche with a smaller workforce and market valuation.
Income Statement Comparison
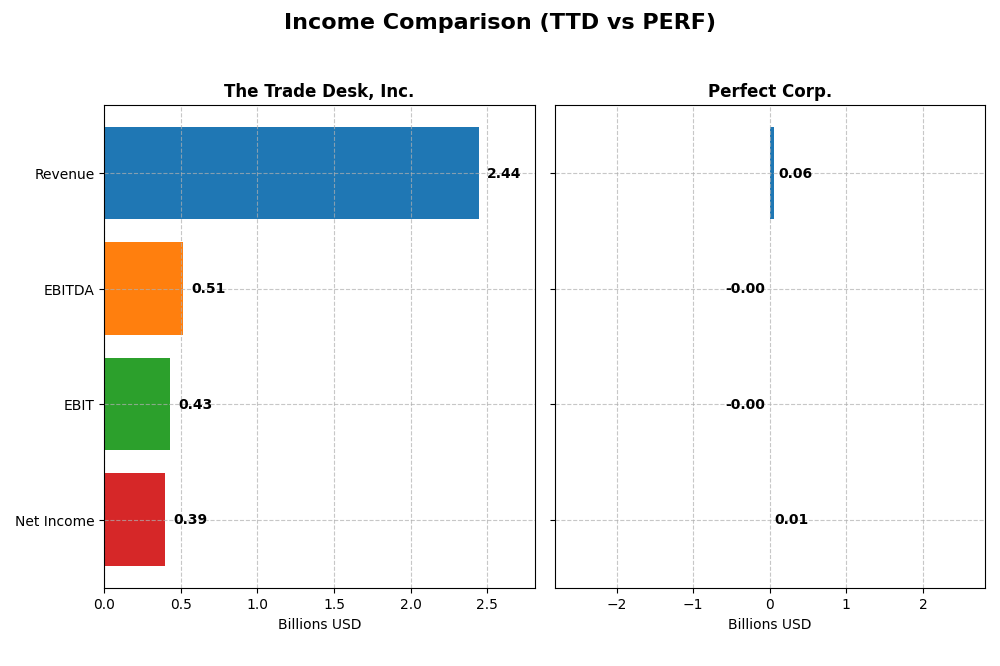
This table summarizes the key income statement metrics for The Trade Desk, Inc. and Perfect Corp. for the fiscal year 2024, providing a direct comparison of their financial performance.
| Metric | The Trade Desk, Inc. | Perfect Corp. |
|---|---|---|
| Market Cap | 17.3B | 179M |
| Revenue | 2.44B | 60.2M |
| EBITDA | 515M | -2.05M |
| EBIT | 427M | -2.84M |
| Net Income | 393M | 5.02M |
| EPS | 0.80 | 0.05 |
| Fiscal Year | 2024 | 2024 |
Income Statement Interpretations
The Trade Desk, Inc.
The Trade Desk has shown strong revenue growth from 2020 to 2024, increasing from $836M to $2.44B, with net income rising significantly from $242M to $393M. Margins remain healthy, with a gross margin above 80% and a net margin at 16.1% in 2024. The latest year saw revenue growth slow to 25.6%, but profitability improved sharply, with EBIT growth exceeding 113%.
Perfect Corp.
Perfect Corp. experienced steady revenue growth from $29.9M in 2020 to $60.2M in 2024, while net income turned positive in recent years, reaching $5M in 2024 from a loss of $5.6M in 2020. Gross margin remains favorable at nearly 78%, though EBIT margin was negative at -4.7% in 2024. The most recent year showed moderate revenue growth of 12.5%, but EBIT declined significantly, reflecting ongoing operational challenges.
Which one has the stronger fundamentals?
The Trade Desk demonstrates more robust fundamentals with consistently positive and growing net income, strong margins, and accelerating profitability in 2024. Perfect Corp. shows promising revenue and net income growth overall but struggles with negative EBIT margins and volatility in earnings. The Trade Desk’s higher margin stability and scale suggest it currently possesses the stronger income statement fundamentals.
Financial Ratios Comparison
The table below presents a side-by-side comparison of key financial ratios for The Trade Desk, Inc. (TTD) and Perfect Corp. (PERF) based on their most recent fiscal year data as of 2024.
| Ratios | The Trade Desk, Inc. (TTD) | Perfect Corp. (PERF) |
|---|---|---|
| ROE | 13.3% | 3.4% |
| ROIC | 10.0% | -2.1% |
| P/E | 146.8 | 56.6 |
| P/B | 19.6 | 1.93 |
| Current Ratio | 1.86 | 5.52 |
| Quick Ratio | 1.86 | 5.52 |
| D/E (Debt-to-Equity) | 0.11 | 0.0035 |
| Debt-to-Assets | 5.1% | 0.28% |
| Interest Coverage | N/A | -449 |
| Asset Turnover | 0.40 | 0.33 |
| Fixed Asset Turnover | 5.17 | 57.94 |
| Payout Ratio | 0 | 0 |
| Dividend Yield | 0% | 0% |
Interpretation of the Ratios
The Trade Desk, Inc.
The Trade Desk shows a favorable overall ratio profile with a strong net margin of 16.08% and solid returns on invested capital (10.02%). However, high valuation multiples such as a PE of 146.77 and PB of 19.56 raise concerns about overvaluation. The company has no dividend yield, reflecting a reinvestment focus rather than shareholder payouts.
Perfect Corp.
Perfect Corp. presents mixed ratios with a neutral net margin of 8.34% but unfavorable returns on equity (3.42%) and invested capital (-2.1%). Its PE of 56.6 is high, while the current ratio at 5.52 is considered unfavorable. Like The Trade Desk, Perfect Corp. does not pay dividends, likely emphasizing growth and R&D investments.
Which one has the best ratios?
The Trade Desk has a more favorable financial ratio profile, with a higher percentage of positive metrics and stronger profitability indicators. Perfect Corp.’s ratios are more mixed, with notable weaknesses in returns and some liquidity measures, leading to a slightly unfavorable overall evaluation compared to The Trade Desk.
Strategic Positioning
This section compares the strategic positioning of The Trade Desk, Inc. and Perfect Corp., including market position, key segments, and exposure to disruption:
The Trade Desk, Inc.
- Leading digital advertising platform facing NASDAQ competition pressure.
- Focused on data-driven digital ad campaigns across multiple formats and devices.
- Operates in a tech-driven advertising market with steady demand for innovation.
Perfect Corp.
- Smaller market cap, niche in AI and AR beauty and fashion tech.
- Offers SaaS AI and AR solutions with multiple virtual try-on applications.
- Positioned in evolving AI/AR tech with growing use in retail and personal care sectors.
The Trade Desk, Inc. vs Perfect Corp. Positioning
The Trade Desk maintains a broad, diversified digital advertising platform targeting multiple ad formats and channels, while Perfect Corp. concentrates on AI/AR beauty and fashion tech solutions. The Trade Desk leverages scale, whereas Perfect Corp. benefits from specialized tech innovation but with a smaller market presence.
Which has the best competitive advantage?
Both companies are currently shedding value with slightly unfavorable MOAT evaluations; however, Perfect Corp. shows improving profitability trends, unlike The Trade Desk whose ROIC is declining, indicating differing trajectories in competitive advantage.
Stock Comparison
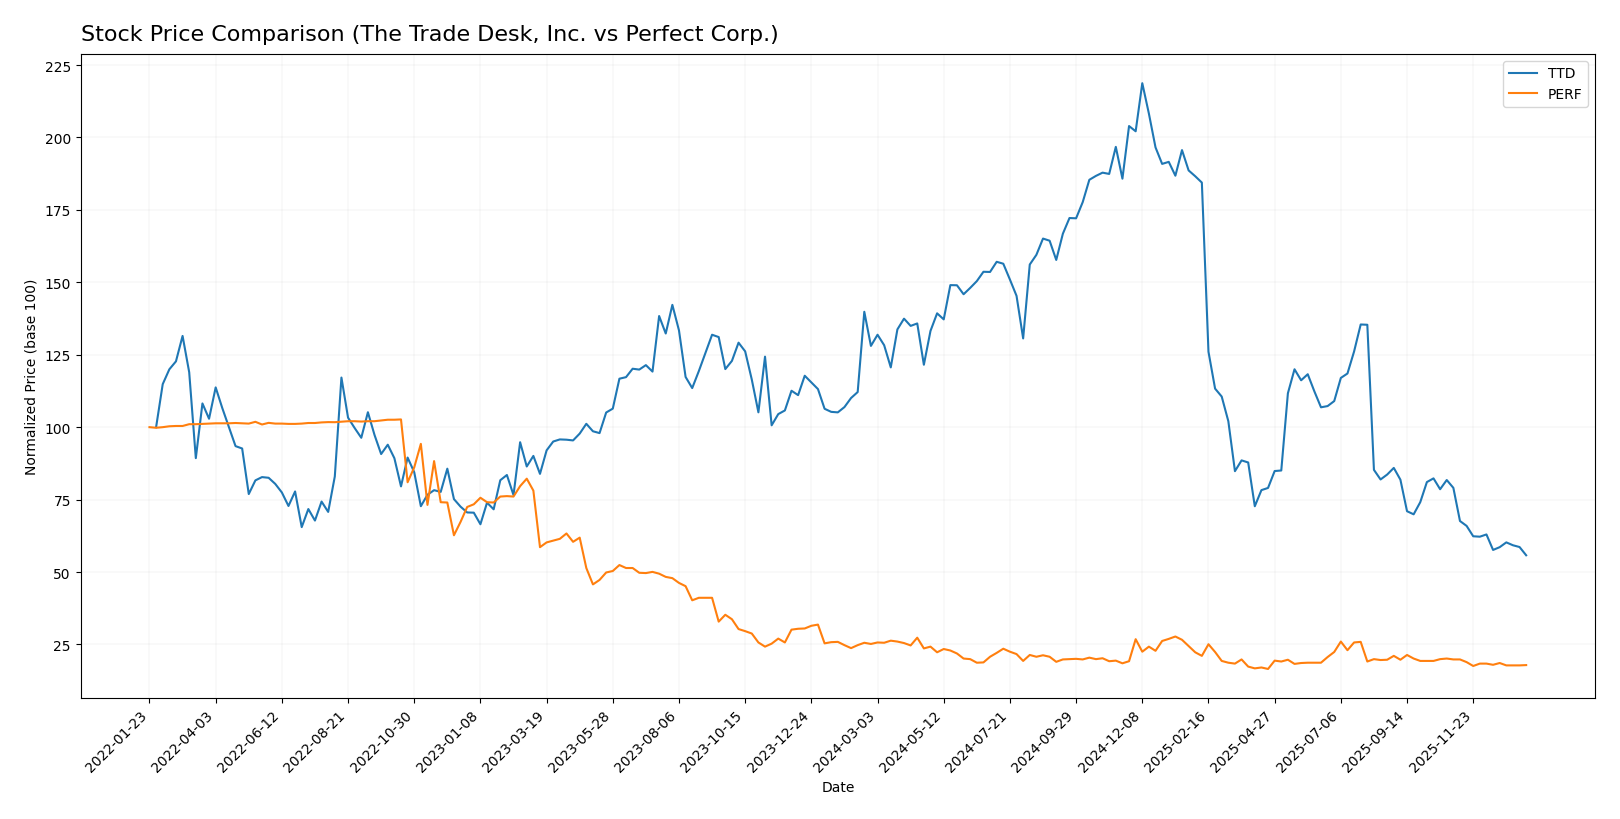
The stock price movements of The Trade Desk, Inc. and Perfect Corp. over the past year reveal significant declines with decelerating bearish trends, marked by notable price drops and shifting trading dynamics.
Trend Analysis
The Trade Desk, Inc. (TTD) shows a bearish trend with a -56.43% price decline over the past 12 months, accompanied by high volatility (std deviation 28.36) and a decelerating downward momentum. Recent weeks confirm sustained weakness with a -29.44% drop.
Perfect Corp. (PERF) also exhibits a bearish trend, with a -28.98% price change over the last year and very low volatility (std deviation 0.27). The deceleration in the downward trend continues into recent months, showing a smaller -9.84% decline.
Comparing the two, TTD has experienced the steepest decline and greater volatility, resulting in lower market performance than PERF, which showed a less severe price drop over the period analyzed.
Target Prices
Here is the current consensus on target prices from verified analysts for the selected companies:
| Company | Target High | Target Low | Consensus |
|---|---|---|---|
| The Trade Desk, Inc. | 98 | 39 | 56.73 |
| Perfect Corp. | 7 | 7 | 7 |
Analysts expect The Trade Desk’s stock to trade significantly higher than the current price of $35.48, indicating potential upside. Perfect Corp.’s consensus target of $7 is also well above its current price of $1.74, suggesting strong growth expectations.
Analyst Opinions Comparison
This section compares analysts’ ratings and grades for The Trade Desk, Inc. (TTD) and Perfect Corp. (PERF):
Rating Comparison
TTD Rating
- Rating: B, evaluated as Very Favorable overall.
- Discounted Cash Flow Score: 4, indicating a Favorable valuation based on cash flow projections.
- ROE Score: 4, showing strong profit generation efficiency from shareholders’ equity.
- ROA Score: 4, reflecting efficient asset utilization to generate earnings.
- Debt To Equity Score: 3, indicating moderate financial risk with balanced debt levels.
- Overall Score: 3, representing a Moderate overall financial standing.
PERF Rating
- Rating: A-, evaluated as Very Favorable overall.
- Discounted Cash Flow Score: 5, indicating a Very Favorable valuation based on cash flow projections.
- ROE Score: 2, suggesting moderate efficiency in generating profit from equity.
- ROA Score: 3, reflecting moderate effectiveness in asset utilization.
- Debt To Equity Score: 4, indicating favorable financial stability with lower risk.
- Overall Score: 4, representing a Favorable overall financial standing.
Which one is the best rated?
Based strictly on the data, PERF holds a higher overall rating (A-) and overall score (4) compared to TTD’s B rating and overall score of 3. PERF also leads in discounted cash flow and debt-to-equity scores, while TTD scores better in ROE and ROA.
Scores Comparison
Here is a comparison of the Altman Z-Score and Piotroski Score for the two companies:
TTD Scores
- Altman Z-Score: 4.30, indicating a safe zone with low bankruptcy risk.
- Piotroski Score: 5, reflecting average financial strength.
PERF Scores
- Altman Z-Score: 1.31, indicating distress zone with high bankruptcy risk.
- Piotroski Score: 6, reflecting average financial strength.
Which company has the best scores?
TTD has a significantly higher Altman Z-Score placing it firmly in the safe zone, while PERF’s score is in the distress zone. Both have average Piotroski Scores, with PERF slightly higher. Overall, TTD shows stronger bankruptcy risk metrics.
Grades Comparison
Here is a comparison of the recent grades assigned to The Trade Desk, Inc. and Perfect Corp.:
The Trade Desk, Inc. Grades
The following table summarizes recent grades from reputable grading companies for The Trade Desk, Inc.:
| Grading Company | Action | New Grade | Date |
|---|---|---|---|
| Morgan Stanley | Maintain | Equal Weight | 2026-01-13 |
| Wells Fargo | Maintain | Equal Weight | 2026-01-12 |
| Cantor Fitzgerald | Maintain | Neutral | 2026-01-08 |
| Wolfe Research | Maintain | Outperform | 2026-01-06 |
| Guggenheim | Maintain | Buy | 2026-01-05 |
| Jefferies | Maintain | Hold | 2025-12-11 |
| Wedbush | Maintain | Neutral | 2025-12-08 |
| DA Davidson | Maintain | Buy | 2025-11-10 |
| Truist Securities | Maintain | Buy | 2025-11-07 |
| Wells Fargo | Maintain | Equal Weight | 2025-11-07 |
Overall, The Trade Desk shows a mix of Buy, Hold, Neutral, and Outperform grades, with a consensus rating of Buy, reflecting moderate confidence among analysts.
Perfect Corp. Grades
The following table summarizes recent grades from reputable grading companies for Perfect Corp.:
| Grading Company | Action | New Grade | Date |
|---|---|---|---|
| Piper Sandler | Maintain | Neutral | 2024-02-29 |
| Goldman Sachs | Maintain | Neutral | 2023-10-26 |
| Piper Sandler | Maintain | Neutral | 2023-10-25 |
| Piper Sandler | Maintain | Neutral | 2023-07-26 |
| Piper Sandler | Maintain | Neutral | 2023-07-25 |
| Piper Sandler | Maintain | Neutral | 2023-04-27 |
| Oppenheimer | Downgrade | Perform | 2023-04-20 |
| Oppenheimer | Downgrade | Perform | 2023-04-19 |
| Oppenheimer | Downgrade | Perform | 2023-04-18 |
| Piper Sandler | Maintain | Neutral | 2023-03-08 |
Perfect Corp. grades are predominantly Neutral with a recent downgrade from Outperform to Perform by Oppenheimer, resulting in a consensus Hold rating.
Which company has the best grades?
The Trade Desk, Inc. has received generally more favorable grades, including multiple Buy and Outperform ratings, while Perfect Corp.’s grades remain mostly Neutral with a Hold consensus. This difference suggests that analysts currently view The Trade Desk more optimistically, which may influence investor sentiment and portfolio positioning.
Strengths and Weaknesses
Below is a comparison of key strengths and weaknesses for The Trade Desk, Inc. (TTD) and Perfect Corp. (PERF) based on recent financial and operational data.
| Criterion | The Trade Desk, Inc. (TTD) | Perfect Corp. (PERF) |
|---|---|---|
| Diversification | Moderate; focused on digital advertising tech | Limited; primarily in beauty tech and AR |
| Profitability | Favorable net margin (16.08%), positive ROIC (10.02%) | Neutral net margin (8.34%), negative ROIC (-2.1%) |
| Innovation | Strong fixed asset turnover (5.17), signaling efficient use of innovation assets | Very high fixed asset turnover (57.94), indicating innovation efficiency |
| Global presence | Significant global footprint in advertising markets | Growing, but more niche and regionally focused |
| Market Share | Established player with solid market penetration | Emerging player with growing market position |
Key takeaways: The Trade Desk demonstrates stronger profitability and a more diversified business model, contributing to overall value creation despite slightly declining ROIC. Perfect Corp. is innovating rapidly with growing ROIC but currently faces challenges in profitability and liquidity, indicating higher investment risk.
Risk Analysis
Below is a risk comparison table for The Trade Desk, Inc. (TTD) and Perfect Corp. (PERF) based on the most recent 2024 data:
| Metric | The Trade Desk, Inc. (TTD) | Perfect Corp. (PERF) |
|---|---|---|
| Market Risk | Moderate (Beta 1.105) | Low (Beta 0.454) |
| Debt Level | Low (Debt/Equity 0.11) | Very Low (Debt/Equity 0) |
| Regulatory Risk | Moderate (US tech sector) | Moderate (Taiwanese market) |
| Operational Risk | Moderate (3,522 employees) | Moderate (342 employees) |
| Environmental Risk | Low | Low |
| Geopolitical Risk | Moderate (US-based) | High (Taiwan, geopolitical tensions) |
The most likely and impactful risks involve geopolitical tensions for Perfect Corp. due to its Taiwan base, which could disrupt operations or supply chains. The Trade Desk faces moderate market and regulatory risks typical for US tech firms but benefits from a strong financial position and low debt, lowering bankruptcy risk. Investors should weigh geopolitical exposure heavily for PERF while considering TTD’s valuation and market volatility.
Which Stock to Choose?
The Trade Desk, Inc. (TTD) shows a strong income evolution with a 25.63% revenue growth last year and favorable margins including a 16.08% net margin. Its financial ratios are mostly favorable, with low debt levels and a solid current ratio, though its valuation multiples appear high. Profitability is stable but ROIC trends downward, indicating slightly unfavorable value creation. The company holds a very favorable rating of B and scores well on financial stability metrics.
Perfect Corp. (PERF) exhibits moderate income growth at 12.52% revenue increase last year, with a positive net margin of 8.34% despite an unfavorable EBIT margin. Its financial ratios reflect mixed signals: low debt and a strong quick ratio contrast with unfavorable ROE and interest coverage. Profitability is improving, but the company is still shedding value with a slightly unfavorable moat rating. PERF’s overall rating is very favorable at A- but shows some financial distress risks.
Investors focused on growth and robust financial health might find TTD’s consistent income growth and favorable financial ratios attractive, while those with a tolerance for risk and interest in improving profitability may see potential in PERF’s rising ROIC and favorable rating. The choice could therefore depend on prioritizing stable value creation versus potential turnaround opportunities.
Disclaimer: Investment carries a risk of loss of initial capital. The past performance is not a reliable indicator of future results. Be sure to understand risks before making an investment decision.
Go Further
I encourage you to read the complete analyses of The Trade Desk, Inc. and Perfect Corp. to enhance your investment decisions: