In today’s fast-evolving technology landscape, ServiceTitan, Inc. and Perfect Corp. stand out as innovative players in the software application industry. ServiceTitan focuses on field service management for residential and commercial infrastructure, while Perfect Corp. leads in AI-driven augmented reality solutions for beauty and fashion. This comparison highlights their market strategies and innovation potential, helping you identify which company offers the most promising investment opportunity. Let’s explore their strengths and risks together.
Table of contents
Companies Overview
I will begin the comparison between ServiceTitan and Perfect Corp. by providing an overview of these two companies and their main differences.
ServiceTitan Overview
ServiceTitan, Inc. focuses on software solutions for field service management, helping to coordinate installation, maintenance, and servicing of infrastructure and systems in residential and commercial buildings. Founded in 2008 and based in Glendale, CA, ServiceTitan operates within the technology sector and maintains a significant market presence with a market cap of 8.5B USD, employing over 3,000 people.
Perfect Corp. Overview
Perfect Corp. delivers SaaS artificial intelligence and augmented reality solutions aimed at the beauty and fashion industries. Established in 2015 and headquartered in New Taipei City, Taiwan, the company offers a variety of AR and AI-powered virtual try-on and analysis tools. It is considerably smaller than ServiceTitan, with a market cap of approximately 179M USD and about 340 employees.
Key similarities and differences
Both companies operate in the technology sector and specialize in software applications, but their business models differ markedly. ServiceTitan focuses on field service management software for infrastructure and building services, targeting residential and commercial clients. In contrast, Perfect Corp. offers AI and AR-driven SaaS products tailored to beauty and fashion tech markets, emphasizing virtual try-on experiences and personalized analysis. Their market capitalizations and employee bases also reflect their differing scales and industry focuses.
Income Statement Comparison
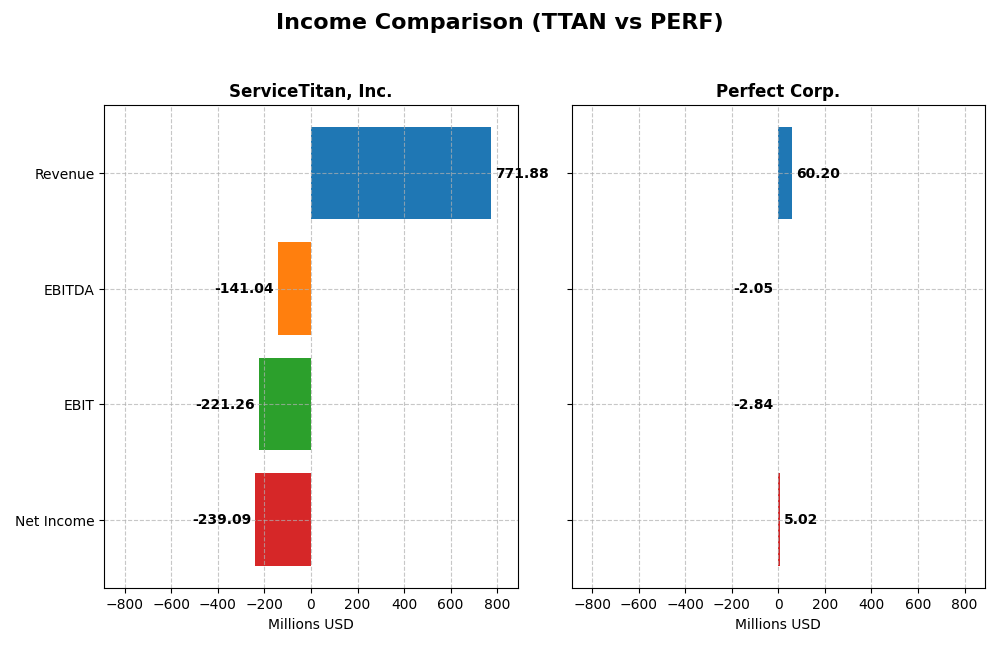
Below is the income statement comparison for ServiceTitan, Inc. and Perfect Corp. for their most recent fiscal years, highlighting key financial metrics.
| Metric | ServiceTitan, Inc. (TTAN) | Perfect Corp. (PERF) |
|---|---|---|
| Market Cap | 8.5B | 179M |
| Revenue | 772M | 60.2M |
| EBITDA | -141M | -2.0M |
| EBIT | -221M | -2.8M |
| Net Income | -239M | 5.0M |
| EPS | -8.53 | 0.05 |
| Fiscal Year | 2025 | 2024 |
Income Statement Interpretations
ServiceTitan, Inc.
ServiceTitan’s revenue rose substantially from $468M in 2023 to $772M in 2025, marking a 65% growth over the period. Net income remained negative but improved by 11% overall. Gross margin held strong near 65%, while net margin was negative around -31%. The latest year showed solid revenue and gross profit growth, but operating expenses grew at the same pace, pressuring EBIT and EPS.
Perfect Corp.
Perfect Corp. experienced steady revenue growth from $29.9M in 2020 to $60.2M in 2024, doubling its top line. Net income turned positive recently, reaching $5.0M in 2024, with net margin improving to 8.3%. Gross margin was high at nearly 78%, and operating expenses grew favorably relative to revenue. However, EBIT declined sharply in the last year despite overall strong margin expansion and EPS growth.
Which one has the stronger fundamentals?
Perfect Corp. shows stronger fundamentals with higher gross and net margins, positive net income, and disciplined expense growth supporting profitability gains over time. ServiceTitan posted impressive revenue expansion but continues to report sizable losses and deteriorating EBIT margins, reflecting cost pressures. Both companies have favorable overall income statement trends, but Perfect Corp.’s profitability metrics and margin improvements suggest a more stable earnings profile.
Financial Ratios Comparison
Below is a comparison of key financial ratios for ServiceTitan, Inc. (TTAN) and Perfect Corp. (PERF) based on their most recent fiscal year data.
| Ratios | ServiceTitan, Inc. (TTAN) FY 2025 | Perfect Corp. (PERF) FY 2024 |
|---|---|---|
| ROE | -16.4% | 3.42% |
| ROIC | -14.1% | -2.10% |
| P/E | -18.1 | 56.6 |
| P/B | 2.98 | 1.93 |
| Current Ratio | 3.74 | 5.52 |
| Quick Ratio | 3.74 | 5.52 |
| D/E (Debt-to-Equity) | 0.114 | 0.0035 |
| Debt-to-Assets | 9.35% | 0.28% |
| Interest Coverage | -14.8 | -449 |
| Asset Turnover | 0.44 | 0.33 |
| Fixed Asset Turnover | 9.57 | 57.9 |
| Payout ratio | 0 | 0 |
| Dividend yield | 0 | 0 |
Interpretation of the Ratios
ServiceTitan, Inc.
ServiceTitan shows a mix of strong and weak ratios; its quick ratio (3.74) and low debt-to-equity (0.11) are favorable, but negative returns on equity (-16.44%) and assets, along with poor interest coverage (-14.26), raise concerns. The company does not pay dividends, likely reflecting ongoing reinvestment or growth priorities without shareholder payouts.
Perfect Corp.
Perfect Corp. exhibits some favorable liquidity metrics, like a high quick ratio (5.52) and zero debt-to-equity, but suffers from weak profitability with negative return on invested capital (-2.1%) and unfavorable interest coverage (-406.29). It also does not pay dividends, possibly due to reinvestment strategies or a focus on growth and innovation instead of distributions.
Which one has the best ratios?
Both companies have a slightly unfavorable global ratio assessment, with 50% unfavorable ratios each. ServiceTitan has a higher proportion of favorable ratios (42.86%) compared to Perfect Corp.’s 35.71%, but both face challenges in profitability and interest coverage. Neither company currently rewards shareholders with dividends.
Strategic Positioning
This section compares the strategic positioning of ServiceTitan, Inc. and Perfect Corp., including market position, key segments, and exposure to technological disruption:
ServiceTitan, Inc.
- Leading in software for field service management; faces competitive pressure in SaaS applications.
- Key segments include platform and subscription revenues from field service infrastructure software.
- Exposure to disruption limited to software application advances within field service industry.
Perfect Corp.
- Focused on AI and AR solutions in beauty and fashion tech; niche market with competitive innovation.
- Provides diverse AI and AR beauty and fashion SaaS solutions and consumer apps.
- High exposure to technological disruption due to reliance on AI and AR innovation in beauty tech.
ServiceTitan, Inc. vs Perfect Corp. Positioning
ServiceTitan concentrates on software for field service management, generating substantial platform and subscription revenues, while Perfect Corp. focuses on AI-driven beauty and fashion tech solutions with a smaller workforce. ServiceTitan’s positioning is more concentrated on B2B software, whereas Perfect Corp. targets consumer-oriented innovation.
Which has the best competitive advantage?
Both companies are currently shedding value as ROIC is below WACC. ServiceTitan shows stable but unfavorable profitability, while Perfect Corp. demonstrates improving profitability despite overall slight unfavorable moat status.
Stock Comparison
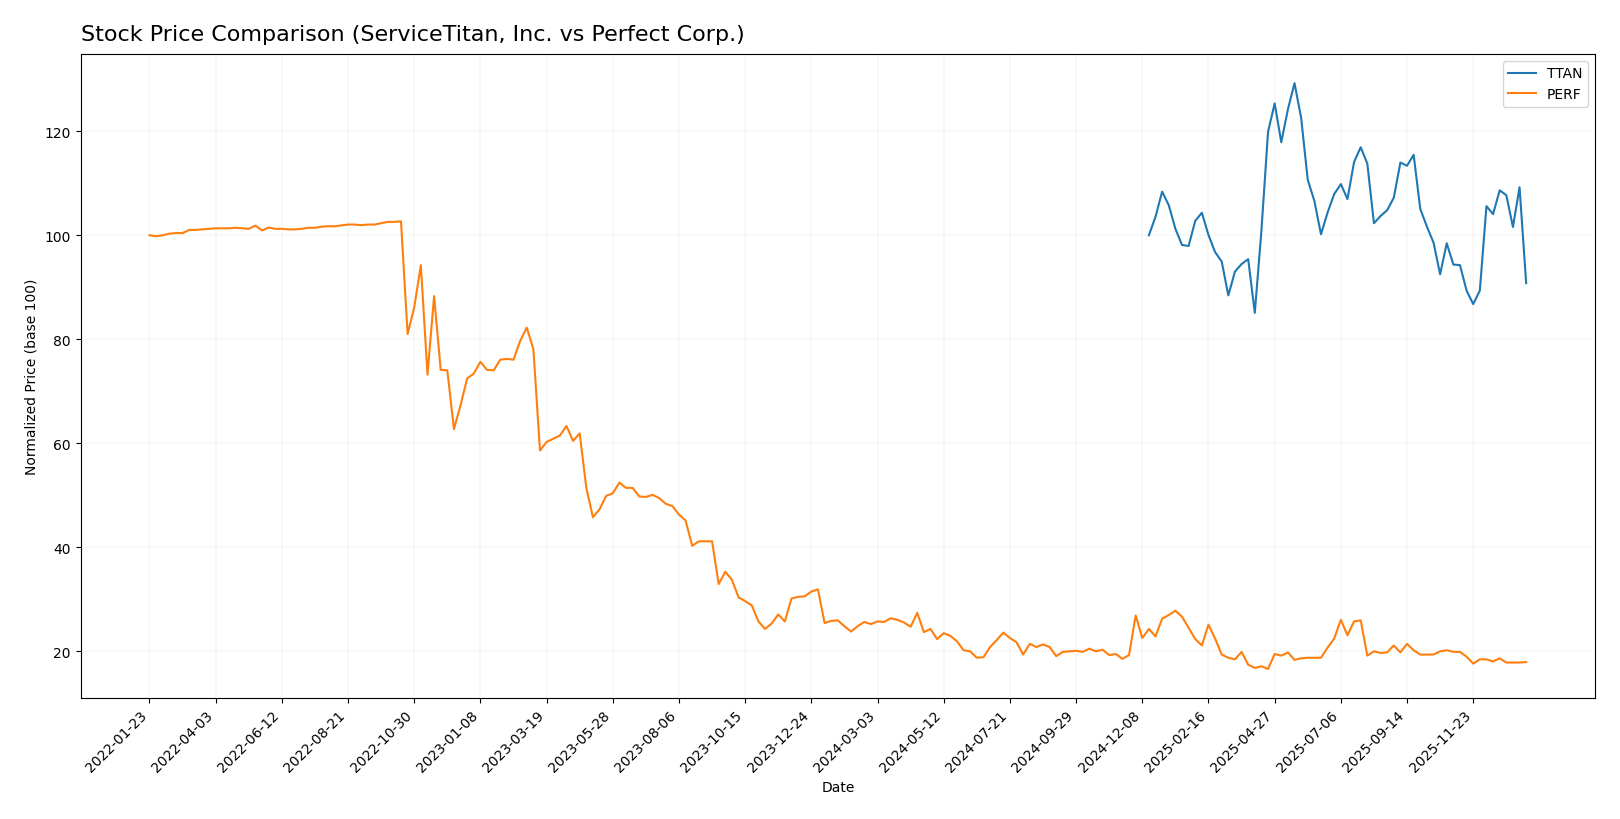
The stock price movements of ServiceTitan, Inc. (TTAN) and Perfect Corp. (PERF) over the past year reveal distinct bearish trends with varying degrees of acceleration and volatility, reflecting differing market dynamics and investor sentiment.
Trend Analysis
ServiceTitan, Inc. (TTAN) experienced a bearish trend over the past 12 months with a price decline of 9.22%. The trend shows acceleration, notable volatility (std deviation 9.86), and price ranged between 85.07 and 129.26.
Perfect Corp. (PERF) also faced a bearish trend, with a sharper 28.98% price drop over the past year. This trend decelerated and exhibited low volatility (std deviation 0.27), with prices fluctuating from 1.61 to 2.7.
Comparing both, TTAN delivered a less severe price decline and higher volatility than PERF, indicating stronger market performance despite both stocks trending downward.
Target Prices
The current analyst consensus suggests potential upside for both ServiceTitan, Inc. and Perfect Corp.
| Company | Target High | Target Low | Consensus |
|---|---|---|---|
| ServiceTitan, Inc. | 145 | 117 | 132.44 |
| Perfect Corp. | 7 | 7 | 7 |
For ServiceTitan, the consensus target price of 132.44 USD is significantly above the current price of 90.78 USD, indicating optimistic analyst expectations. Perfect Corp.’s target consensus at 7 USD far exceeds its current price of 1.74 USD, suggesting analysts see strong growth potential despite its smaller market cap.
Analyst Opinions Comparison
This section compares analysts’ ratings and grades for ServiceTitan, Inc. and Perfect Corp.:
Rating Comparison
ServiceTitan, Inc. Rating
- Rating: C- indicating a very unfavorable overall view.
- Discounted Cash Flow Score: 1, very unfavorable for valuation.
- ROE Score: 1, very unfavorable efficiency in generating profits.
- ROA Score: 1, very unfavorable asset utilization.
- Debt To Equity Score: 3, moderate financial risk.
- Overall Score: 1, very unfavorable financial standing.
Perfect Corp. Rating
- Rating: A- reflecting a very favorable overall view.
- Discounted Cash Flow Score: 5, very favorable valuation outlook.
- ROE Score: 2, moderate efficiency in generating profits.
- ROA Score: 3, moderate asset utilization efficiency.
- Debt To Equity Score: 4, favorable financial stability.
- Overall Score: 4, favorable financial standing.
Which one is the best rated?
Based strictly on the provided data, Perfect Corp. holds a significantly better rating and scores across all key financial metrics compared to ServiceTitan, Inc., indicating a more favorable analyst opinion overall.
Scores Comparison
Here is a comparison of the Altman Z-Score and Piotroski Score for ServiceTitan and Perfect Corp.:
TTAN Scores
- Altman Z-Score: 15.74, indicating safe zone, very low bankruptcy risk.
- Piotroski Score: 6, indicating average financial strength.
PERF Scores
- Altman Z-Score: 1.31, indicating distress zone, high bankruptcy risk.
- Piotroski Score: 6, indicating average financial strength.
Which company has the best scores?
ServiceTitan has a significantly higher Altman Z-Score, placing it in the safe zone, while Perfect Corp. is in the distress zone. Both have identical Piotroski Scores of 6, indicating average financial strength. Overall, ServiceTitan shows stronger financial stability.
Grades Comparison
Here is a comparison of the recent grades assigned to ServiceTitan, Inc. and Perfect Corp. by established grading firms:
ServiceTitan, Inc. Grades
This table shows the most recent grades for ServiceTitan, Inc. from reputable grading companies.
| Grading Company | Action | New Grade | Date |
|---|---|---|---|
| Piper Sandler | Maintain | Overweight | 2025-12-05 |
| BMO Capital | Maintain | Outperform | 2025-12-05 |
| TD Cowen | Maintain | Buy | 2025-12-05 |
| Morgan Stanley | Maintain | Equal Weight | 2025-12-05 |
| BMO Capital | Maintain | Outperform | 2025-11-20 |
| Wells Fargo | Maintain | Overweight | 2025-09-19 |
| Stifel | Maintain | Buy | 2025-09-19 |
| Piper Sandler | Maintain | Overweight | 2025-09-19 |
| Canaccord Genuity | Maintain | Buy | 2025-09-19 |
| Citigroup | Maintain | Neutral | 2025-09-09 |
Overall, ServiceTitan’s grades show a strong positive trend, predominantly rated as Buy, Overweight, or Outperform with consistent maintenance of these ratings.
Perfect Corp. Grades
The following table presents recent grades for Perfect Corp. from recognized grading firms.
| Grading Company | Action | New Grade | Date |
|---|---|---|---|
| Piper Sandler | Maintain | Neutral | 2024-02-29 |
| Goldman Sachs | Maintain | Neutral | 2023-10-26 |
| Piper Sandler | Maintain | Neutral | 2023-10-25 |
| Piper Sandler | Maintain | Neutral | 2023-07-26 |
| Piper Sandler | Maintain | Neutral | 2023-07-25 |
| Piper Sandler | Maintain | Neutral | 2023-04-27 |
| Oppenheimer | Downgrade | Perform | 2023-04-20 |
| Oppenheimer | Downgrade | Perform | 2023-04-19 |
| Oppenheimer | Downgrade | Perform | 2023-04-18 |
| Piper Sandler | Maintain | Neutral | 2023-03-08 |
Perfect Corp.’s grades are more neutral to moderate, with recent downgrades from Outperform to Perform and a consensus largely at Hold.
Which company has the best grades?
ServiceTitan, Inc. has received notably stronger grades, with multiple Buy and Outperform ratings, compared to Perfect Corp.’s neutral and moderate Perform ratings. This suggests ServiceTitan is viewed more favorably by analysts, potentially impacting investor confidence and portfolio allocation decisions.
Strengths and Weaknesses
Below is a comparison table highlighting the key strengths and weaknesses of ServiceTitan, Inc. (TTAN) and Perfect Corp. (PERF) based on the latest financial and operational data.
| Criterion | ServiceTitan, Inc. (TTAN) | Perfect Corp. (PERF) |
|---|---|---|
| Diversification | Moderate, with revenue primarily from Platform (739M) and Subscriptions (566M) | Limited data on revenue segmentation; likely focused on core beauty tech services |
| Profitability | Negative net margin (-30.98%) and ROIC (-14.11%); value destroying | Slightly positive net margin (8.34%) but negative ROIC (-2.1%); improving profitability trend |
| Innovation | Moderate asset efficiency (fixed asset turnover 9.57) supporting operations | High fixed asset turnover (57.94), indicating efficient use of assets in innovation |
| Global presence | Established but limited global footprint | Likely expanding global presence given growth in ROIC trend (45.8%) |
| Market Share | Stable but under pressure due to value destruction | Growing profitability suggests increasing market share potential |
Key takeaways: Both companies currently show challenges in value creation, with ServiceTitan shedding value more significantly. However, Perfect Corp. exhibits a promising upward trend in profitability despite some unfavorable ratios, indicating potential for future value creation. Investors should weigh risk carefully and monitor improvements in operational efficiency and profitability.
Risk Analysis
Below is a comparison of key risks for ServiceTitan, Inc. (TTAN) and Perfect Corp. (PERF) based on the most recent financial and operational data.
| Metric | ServiceTitan, Inc. (TTAN) | Perfect Corp. (PERF) |
|---|---|---|
| Market Risk | Moderate (beta -0.85; tech sector volatility) | Moderate (beta 0.45; niche AR/AI market) |
| Debt Level | Low (D/E 0.11; 9.35% debt to assets) | Very low (D/E 0.0; 0.28% debt to assets) |
| Regulatory Risk | Moderate (US tech regulations and data privacy) | Moderate (Taiwanese regulations, international trade) |
| Operational Risk | Medium (negative ROE and margins; scaling challenges) | Medium (negative ROIC; high P/E ratio indicating growth expectations) |
| Environmental Risk | Low (software industry; limited direct impact) | Low (software and AR/AI services; minimal environmental footprint) |
| Geopolitical Risk | Low (US-based) | High (headquartered in Taiwan; geopolitical tensions in region) |
Both companies face moderate market and operational risks typical of fast-growing tech firms. ServiceTitan’s negative profitability and moderate debt suggest financial strain despite a strong market cap of 8.5B USD. Perfect Corp. has minimal debt but faces higher geopolitical risk due to its Taiwan base amid regional tensions, and its Altman Z-Score indicates financial distress risk. Investors should weigh ServiceTitan’s financial challenges against Perfect Corp.’s geopolitical exposure and valuation concerns.
Which Stock to Choose?
ServiceTitan, Inc. (TTAN) shows favorable revenue growth of 25.64% in the last year and a solid gross margin near 65%, but profitability ratios such as ROE at -16.44% and net margin at -30.98% remain unfavorable. The company maintains low debt levels with a slightly unfavorable rating overall, reflecting value destruction despite stable profitability.
Perfect Corp. (PERF) exhibits consistent revenue growth of 12.52% with a strong gross margin of 77.98%. Profitability ratios are mixed: net margin is positive at 8.34% but ROE is modest at 3.42%. Its debt is minimal, and the firm holds a favorable overall rating, though it still shows signs of value destruction with an improving profitability trend.
Investors prioritizing growth potential might find TTAN’s revenue expansion appealing despite its current unprofitability and value destruction. Conversely, those favoring financial stability and improving profitability may view PERF’s favorable rating and positive net margin as more suitable, considering its cautious debt profile and improving ROIC trend.
Disclaimer: Investment carries a risk of loss of initial capital. The past performance is not a reliable indicator of future results. Be sure to understand risks before making an investment decision.
Go Further
I encourage you to read the complete analyses of ServiceTitan, Inc. and Perfect Corp. to enhance your investment decisions: