Home > Comparison > Technology > NOW vs PERF
The strategic rivalry between ServiceNow, Inc. and Perfect Corp. shapes the evolution of the software application sector. ServiceNow operates as a capital-intensive enterprise cloud platform, automating complex workflows across industries. In contrast, Perfect Corp. delivers high-margin SaaS solutions specializing in AI-driven augmented reality for beauty and fashion tech. This analysis probes their divergent growth trajectories to identify which company presents the superior risk-adjusted opportunity for a diversified portfolio in 2026.
Table of contents
Companies Overview
ServiceNow and Perfect Corp. represent distinct but innovative leaders in the software application market.
ServiceNow, Inc.: Enterprise Workflow Automation Pioneer
ServiceNow dominates enterprise cloud computing with its Now platform, automating workflows, IT service management, and security operations globally. Its strategic focus in 2026 centers on expanding automation capabilities through AI and robotic process automation. The company leverages a broad product suite addressing IT, HR, customer service, and governance, driving its $115B market cap and reinforcing its leadership in digital transformation.
Perfect Corp.: AI-Driven Beauty and Fashion Tech Innovator
Perfect Corp. specializes in SaaS augmented reality and artificial intelligence solutions tailored for beauty and fashion. Its core revenue stems from virtual try-on technologies and AI-powered personalization tools embedded in consumer apps and retail platforms. In 2026, the company emphasizes enhancing user engagement through innovative AR experiences, targeting a niche with a $150M market cap and rapid growth potential in digital consumer tech.
Strategic Collision: Similarities & Divergences
Both firms excel in software innovation but serve vastly different markets—ServiceNow in enterprise IT and Perfect Corp. in consumer beauty tech. ServiceNow’s closed ecosystem for workflow automation contrasts with Perfect’s open AR platform designed for retail engagement. Their primary battleground lies in leveraging AI to optimize user experience, yet their investment profiles diverge sharply: a mature, large-cap enterprise giant versus a nimble, specialized SaaS disruptor.
Income Statement Comparison
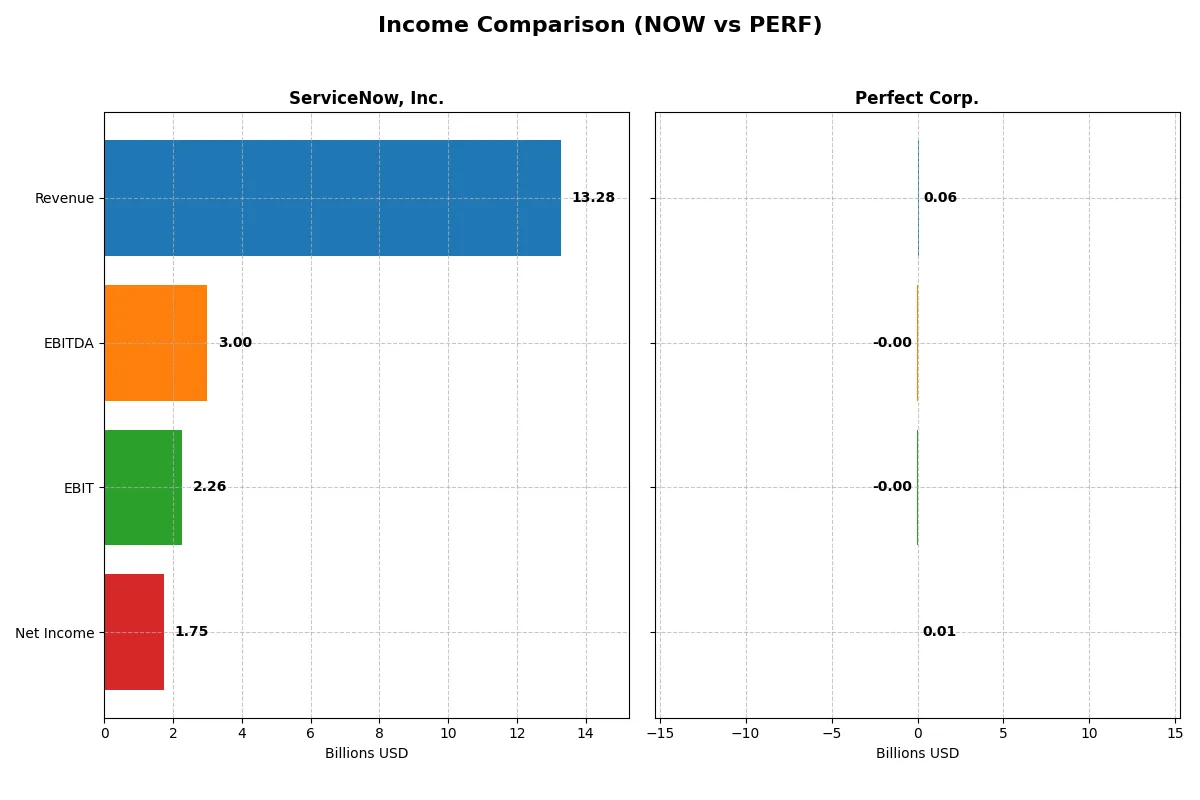
This data dissects the core profitability and scalability of both corporate engines to reveal who dominates the bottom line:
| Metric | ServiceNow, Inc. (NOW) | Perfect Corp. (PERF) |
|---|---|---|
| Revenue | 13.3B | 60.2M |
| Cost of Revenue | 3.0B | 13.3M |
| Operating Expenses | 8.5B | 50.1M |
| Gross Profit | 10.3B | 46.9M |
| EBITDA | 3.0B | -2.0M |
| EBIT | 2.3B | -2.8M |
| Interest Expense | 0 | 7K |
| Net Income | 1.7B | 5.0M |
| EPS | 1.69 | 0.05 |
| Fiscal Year | 2025 | 2024 |
Income Statement Analysis: The Bottom-Line Duel
This income statement comparison exposes which company drives stronger profitability and operational efficiency through their financial performance.
ServiceNow, Inc. Analysis
ServiceNow’s revenue surged from 5.9B in 2021 to 13.3B in 2025, with net income jumping from 230M to 1.75B. Its gross margin remains robust at 77.5%, and net margin sits at a healthy 13.2%. In 2025, it accelerated EBIT growth by 28%, signaling impressive operating leverage and margin expansion.
Perfect Corp. Analysis
Perfect Corp. doubled revenue from 30M in 2020 to 60M in 2024, with net income recovering from a -5.6M loss to 5M profit. Its gross margin steadied near 78%, but EBIT margin stays negative at -4.7%. Despite positive net margin growth, operating losses highlight ongoing efficiency challenges in 2024.
Margin Dominance vs. Growth Struggles
ServiceNow clearly outperforms Perfect Corp. with superior scale, margin quality, and consistent profit growth. Perfect shows promising revenue gains but struggles to convert sales into operating profits. Investors prioritizing margin strength and profitability will find ServiceNow’s profile more compelling than Perfect’s high-growth yet loss-making trajectory.
Financial Ratios Comparison
These vital ratios act as a diagnostic tool to expose the underlying fiscal health, valuation premiums, and capital efficiency of the companies compared below:
| Ratios | ServiceNow, Inc. (NOW) | Perfect Corp. (PERF) |
|---|---|---|
| ROE | 13.5% | 3.4% |
| ROIC | 9.0% | -2.1% |
| P/E | 90.9 | 56.6 |
| P/B | 12.3 | 1.93 |
| Current Ratio | 0.95 | 5.52 |
| Quick Ratio | 0.95 | 5.52 |
| D/E | 0.25 | 0.0035 |
| Debt-to-Assets | 12.3% | 0.28% |
| Interest Coverage | 0 | -449 |
| Asset Turnover | 0.51 | 0.33 |
| Fixed Asset Turnover | 4.29 | 57.9 |
| Payout Ratio | 0 | 0 |
| Dividend Yield | 0 | 0 |
| Fiscal Year | 2025 | 2024 |
Efficiency & Valuation Duel: The Vital Signs
Financial ratios form a company’s DNA, exposing hidden risks and operational strengths shaping investor outcomes.
ServiceNow, Inc.
ServiceNow delivers solid profitability with a 13.48% ROE and 13.16% net margin, signaling efficient operations. However, its valuation is stretched, marked by a high P/E of 90.88 and P/B of 12.25. The company eschews dividends, instead reinvesting heavily in R&D to fuel growth and innovation.
Perfect Corp.
Perfect Corp. shows modest profitability with a 3.42% ROE and 8.34% net margin, reflecting operational challenges. Its valuation is lower yet still elevated, with a P/E of 56.6 and P/B near 1.93. The firm pays no dividend, focusing on reinvestment to improve returns amid structural headwinds.
Premium Valuation vs. Operational Safety
ServiceNow’s superior profitability contrasts with its stretched valuation, while Perfect Corp. suffers weaker returns but trades cheaper. ServiceNow balances innovation investment with strong margins, fitting growth-oriented investors. Perfect’s profile suits those prioritizing lower valuation despite operational risks.
Which one offers the Superior Shareholder Reward?
I see both ServiceNow (NOW) and Perfect Corp. (PERF) pay no dividends, focusing on reinvestment and buybacks for shareholder returns. ServiceNow’s free cash flow per share stands at $4.41 with no dividend payout, but it maintains moderate buyback activity historically, supporting long-term value. Perfect Corp. shows minimal free cash flow per share ($0.13) and negligible buybacks, investing heavily in growth with a high current ratio (5.5), signaling financial flexibility but less immediate shareholder reward. I judge ServiceNow’s distribution model more sustainable and attractive for total returns in 2026 due to stronger free cash flow, disciplined capital allocation, and balanced leverage.
Comparative Score Analysis: The Strategic Profile
The radar chart reveals the fundamental DNA and trade-offs of both firms, highlighting their distinct financial strengths and weaknesses:
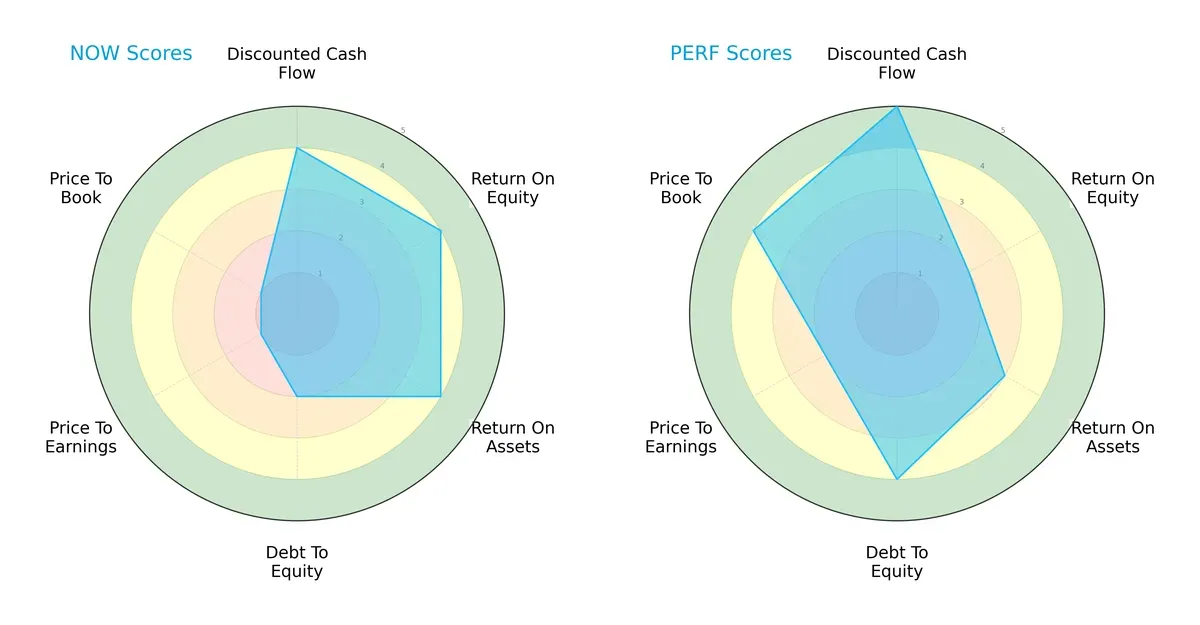
ServiceNow (NOW) exhibits a balanced operational profile with strong DCF, ROE, and ROA scores, though it carries moderate debt risk and very unfavorable valuation metrics. Perfect Corp. (PERF) leads in DCF and debt management, but lags in returns on equity and assets, showing a more niche strength in financial stability and valuation. Overall, ServiceNow relies on operational efficiency, while Perfect Corp. leverages capital structure advantages.
Bankruptcy Risk: Solvency Showdown
The Altman Z-Score difference starkly contrasts the firms’ bankruptcy risks in this cycle:
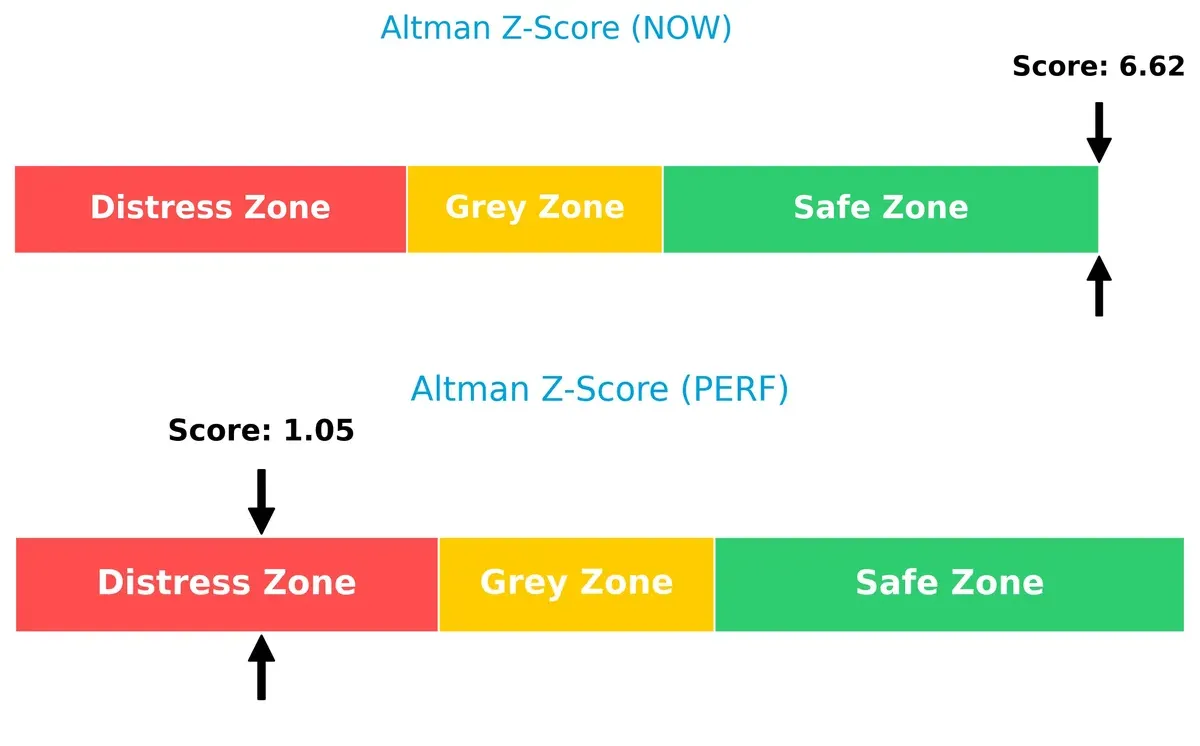
ServiceNow’s score of 6.6 places it well within the safe zone, signaling robust solvency and low bankruptcy risk. Perfect Corp.’s 1.05 score signals distress, raising red flags about its long-term survival prospects despite operational strengths.
Financial Health: Quality of Operations
Piotroski scores suggest both companies maintain average financial health, but with nuanced differences:
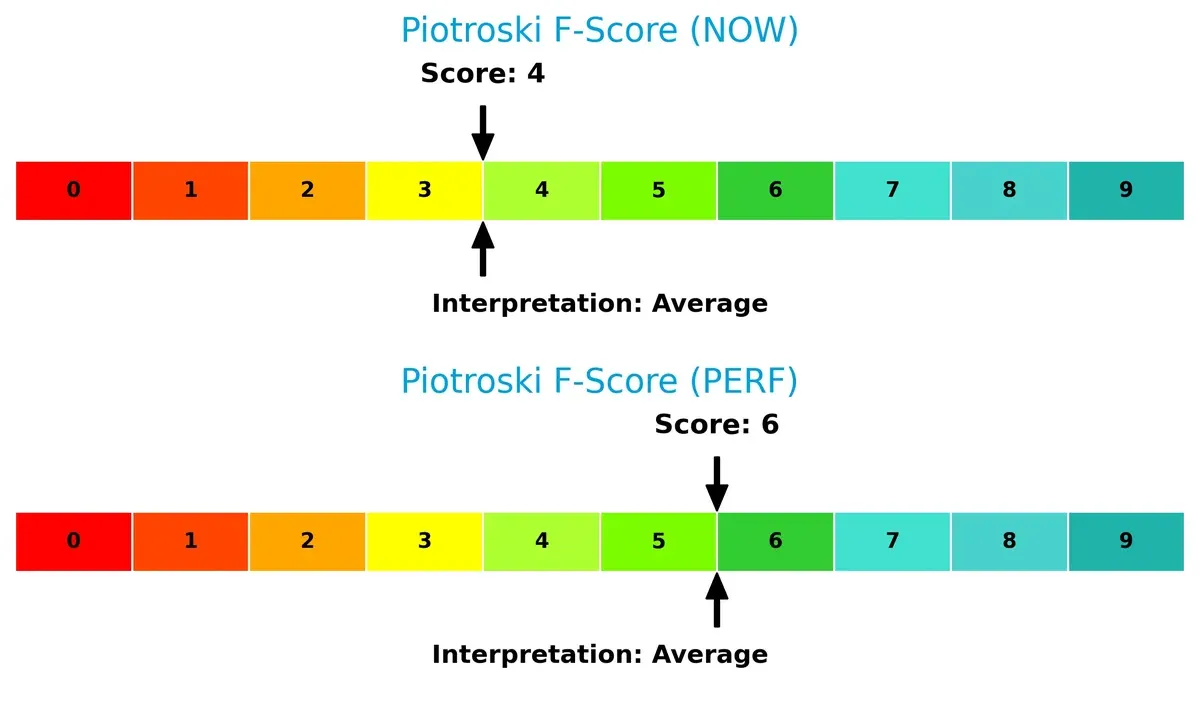
Perfect Corp. scores 6, edging ServiceNow’s 4, indicating stronger internal financial controls and profitability metrics. ServiceNow’s lower score warrants caution, highlighting potential red flags in operational quality or balance sheet strength.
How are the two companies positioned?
This section dissects the operational DNA of ServiceNow and Perfect Corp. by comparing their revenue distribution and internal dynamics. The goal is to confront their economic moats to reveal which model offers the most resilient competitive advantage today.
Revenue Segmentation: The Strategic Mix
The following visual comparison dissects how ServiceNow, Inc. and Perfect Corp. diversify their income streams and where their primary sector bets lie:
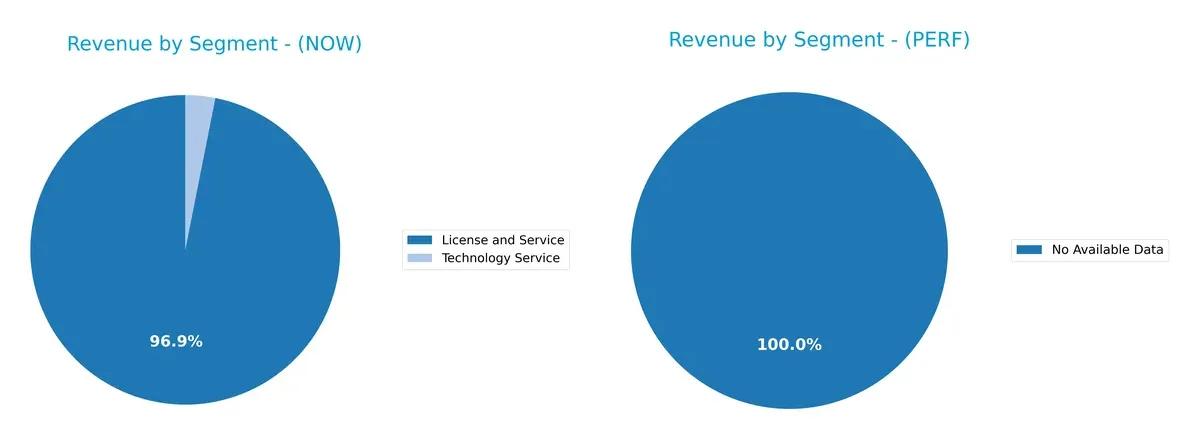
ServiceNow shows a focused revenue mix anchored by $12.9B in License and Service, with a minor $414M from Technology Service in 2025. Perfect Corp. lacks available data, making direct comparison impossible. ServiceNow’s concentration in license services signals strong ecosystem lock-in but exposes it to demand shifts in software licensing. The modest Technology Service segment hints at limited diversification, posing concentration risk amid evolving tech trends.
Strengths and Weaknesses Comparison
This table compares the Strengths and Weaknesses of ServiceNow and Perfect Corp.:
ServiceNow Strengths
- Strong global presence with $8.3B North America and $3.4B EMEA revenue
- Favorable debt to assets at 12.3% and infinite interest coverage
- High fixed asset turnover of 4.29 indicates efficient asset use
Perfect Corp. Strengths
- Favorable weighted average cost of capital at 5.95%
- Zero debt enhances financial flexibility
- Very high fixed asset turnover at 57.94 reflects asset efficiency
ServiceNow Weaknesses
- Unfavorable P/E (90.88) and P/B (12.25) ratios signal high valuation
- Current ratio below 1 (0.95) poses liquidity risk
- Zero dividend yield may deter income investors
Perfect Corp. Weaknesses
- Negative ROIC (-2.1%) and interest coverage (-406.29) indicate poor capital efficiency and financial stress
- Unfavorable current ratio at 5.52 suggests asset structure issues
- Weak ROE at 3.42% highlights low profitability
ServiceNow shows robust global scale and solid debt management but faces valuation and liquidity challenges. Perfect Corp. benefits from low leverage and asset efficiency yet struggles with profitability and financial stability, requiring strategic focus on operational improvements.
The Moat Duel: Analyzing Competitive Defensibility
A structural moat protects long-term profits from competition’s relentless erosion. Only a durable advantage secures sustained value creation:
ServiceNow, Inc.: Workflow Automation Lock-In
ServiceNow’s moat stems from high switching costs embedded in enterprise workflow automation. It boasts stable 17% EBIT margins and 13% net margins. Expansion into AI-driven services in 2026 could deepen this lock-in.
Perfect Corp.: Innovation-Driven Niche Moat
Perfect Corp. relies on AI and AR innovation targeting beauty tech, contrasting ServiceNow’s scale moat. Its negative EBIT margin signals weaker profitability, but rapid AI adoption offers growth opportunities in 2026.
Enterprise Lock-In vs. Innovation Niche: The Moat Face-Off
ServiceNow holds a wider moat with strong margin stability and growing profitability. Perfect Corp. shows promise but lacks profitable scale. ServiceNow is better positioned to defend market share long term.
Which stock offers better returns?
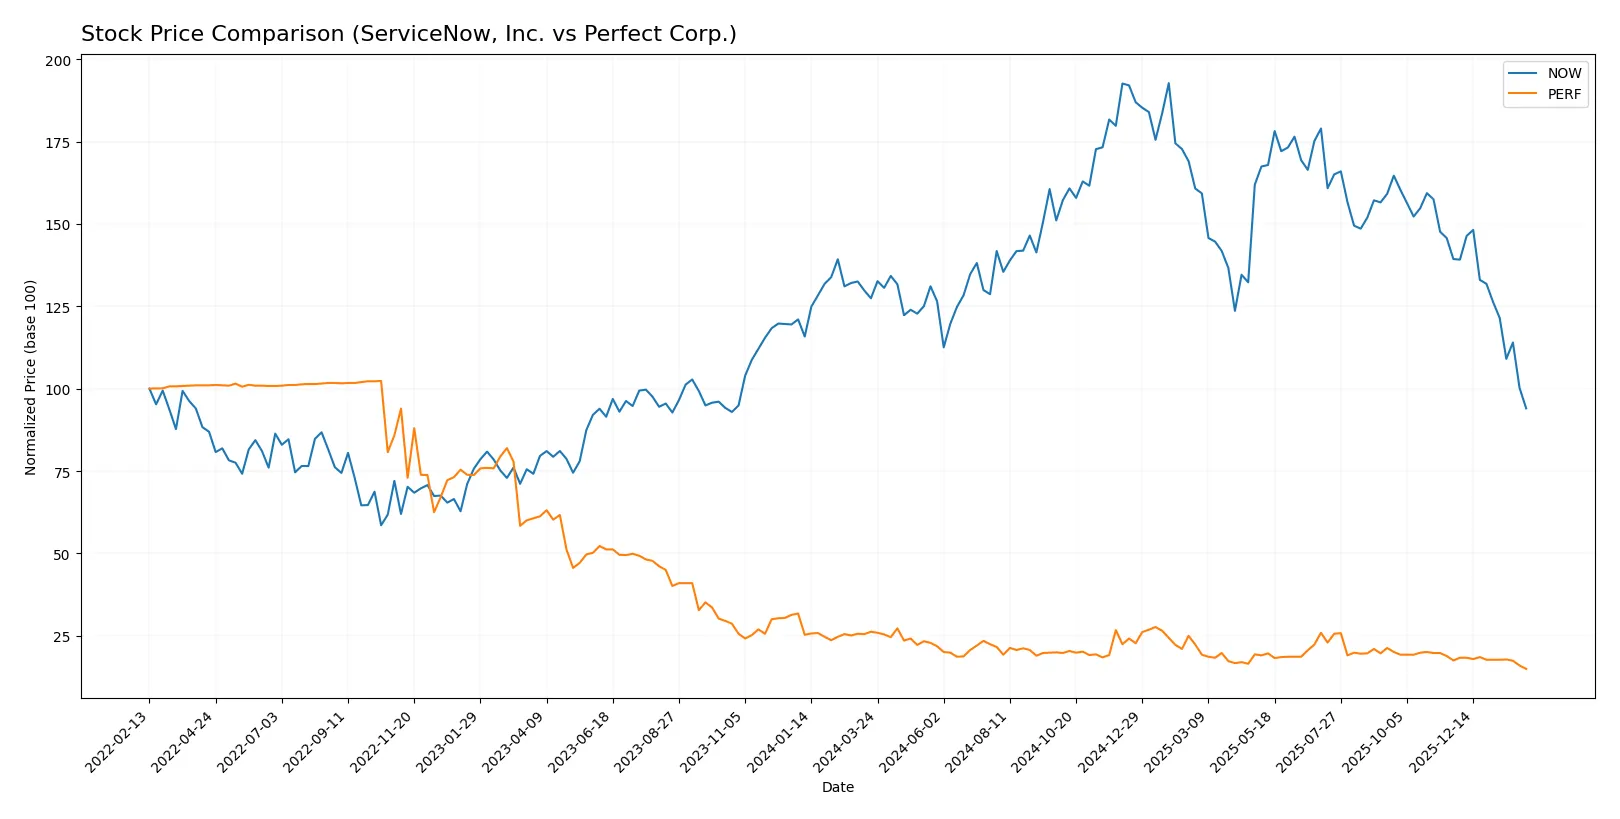
Over the past 12 months, both stocks showed significant declines, with ServiceNow experiencing a steep drop and Perfect Corp. enduring a deeper slide, reflecting challenging trading dynamics and seller dominance.
Trend Comparison
ServiceNow’s stock fell 26.22% over the past year, marking a bearish trend with decelerating losses. Volatility remained high, evidenced by a 25.07 std deviation, peaking at 225 and bottoming at 109.77.
Perfect Corp.’s share price dropped 42.97% in 12 months, also bearish with deceleration. Volatility was minimal, with a 0.28 std deviation, reaching a high of 2.7 and a low of 1.46.
Comparatively, ServiceNow outperformed Perfect Corp., delivering a smaller decline and higher absolute prices, despite both stocks trending downward over the same period.
Target Prices
Analysts present a wide range of target prices, reflecting divergent views on these tech stocks.
| Company | Target Low | Target High | Consensus |
|---|---|---|---|
| ServiceNow, Inc. | 115 | 1315 | 440.64 |
| Perfect Corp. | 7 | 7 | 7 |
ServiceNow’s target consensus of 440.64 far exceeds its current price near 110, indicating strong bullish sentiment. Perfect Corp.’s consensus target at 7 also suggests significant upside from its current 1.46 price.

Don’t Let Luck Decide Your Entry Point
Optimize your entry points with our advanced ProRealTime indicators. You’ll get efficient buy signals with precise price targets for maximum performance. Start outperforming now!
How do institutions grade them?
ServiceNow, Inc. Grades
The following table summarizes recent grades for ServiceNow, Inc. from major grading companies.
| Grading Company | Action | New Grade | Date |
|---|---|---|---|
| Citigroup | Maintain | Buy | 2026-01-30 |
| Evercore ISI Group | Maintain | Outperform | 2026-01-29 |
| Macquarie | Maintain | Neutral | 2026-01-29 |
| BTIG | Maintain | Buy | 2026-01-29 |
| RBC Capital | Maintain | Outperform | 2026-01-29 |
| Keybanc | Maintain | Underweight | 2026-01-29 |
| Stifel | Maintain | Buy | 2026-01-29 |
| DA Davidson | Maintain | Buy | 2026-01-29 |
| Cantor Fitzgerald | Maintain | Overweight | 2026-01-29 |
| Needham | Maintain | Buy | 2026-01-29 |
Perfect Corp. Grades
The following table summarizes recent grades for Perfect Corp. from major grading companies.
| Grading Company | Action | New Grade | Date |
|---|---|---|---|
| Piper Sandler | Maintain | Neutral | 2024-02-29 |
| Goldman Sachs | Maintain | Neutral | 2023-10-26 |
| Piper Sandler | Maintain | Neutral | 2023-10-25 |
| Piper Sandler | Maintain | Neutral | 2023-07-26 |
| Piper Sandler | Maintain | Neutral | 2023-07-25 |
| Piper Sandler | Maintain | Neutral | 2023-04-27 |
| Oppenheimer | Downgrade | Perform | 2023-04-20 |
| Oppenheimer | Downgrade | Perform | 2023-04-19 |
| Oppenheimer | Downgrade | Perform | 2023-04-18 |
| Piper Sandler | Maintain | Neutral | 2023-03-08 |
Which company has the best grades?
ServiceNow, Inc. commands stronger grades, including multiple “Buy” and “Outperform” ratings. Perfect Corp. holds predominantly “Neutral” and downgraded “Perform” grades. This disparity suggests investors may perceive ServiceNow as a more favorable risk-reward profile.
Risks specific to each company
In the challenging 2026 market environment, these categories highlight the critical pressure points and systemic threats facing both ServiceNow, Inc. and Perfect Corp.:
1. Market & Competition
ServiceNow, Inc.
- Dominates enterprise cloud automation but faces intense competition from major tech players.
Perfect Corp.
- Niche AI beauty tech market with rising competitors and limited scale.
2. Capital Structure & Debt
ServiceNow, Inc.
- Maintains low debt-to-equity (0.25), reflecting prudent leverage and strong interest coverage.
Perfect Corp.
- Virtually no debt, but negative interest coverage signals financial stress.
3. Stock Volatility
ServiceNow, Inc.
- Beta near 1 (0.978) implies market-correlated volatility.
Perfect Corp.
- Lower beta (0.451) suggests less sensitivity to market swings but limited liquidity.
4. Regulatory & Legal
ServiceNow, Inc.
- Faces complex global data privacy and compliance pressures typical for US tech firms.
Perfect Corp.
- Exposed to evolving Taiwan and international tech regulations with less regulatory history.
5. Supply Chain & Operations
ServiceNow, Inc.
- Robust cloud infrastructure but reliant on third-party data centers and partners.
Perfect Corp.
- Smaller scale may limit operational resilience and increase supply chain risks.
6. ESG & Climate Transition
ServiceNow, Inc.
- Increasing focus on ESG initiatives; benefits from investor demand for sustainable tech.
Perfect Corp.
- Emerging ESG practices but limited disclosures due to smaller size and market presence.
7. Geopolitical Exposure
ServiceNow, Inc.
- Primarily US-based but global client footprint exposes it to trade and political risks.
Perfect Corp.
- Taiwan base subjects it to significant geopolitical tensions affecting supply chains.
Which company shows a better risk-adjusted profile?
ServiceNow’s strongest risk is market competition within a crowded enterprise software space. Perfect Corp.’s most daunting risk is financial instability, reflected in its distress-zone Altman Z-score and negative interest coverage. I find ServiceNow offers a better risk-adjusted profile, supported by its robust capital structure and safe-zone financial scores. Perfect Corp.’s financial fragility and geopolitical exposure remain critical concerns in 2026.
Final Verdict: Which stock to choose?
ServiceNow, Inc. (NOW) stands out for its operational excellence and robust cash generation, driving consistent profitability and expanding margins. Its main point of vigilance is a current ratio slightly below 1, signaling liquidity pressure that warrants monitoring. This stock suits portfolios seeking aggressive growth fueled by scalable SaaS innovation.
Perfect Corp. (PERF) boasts a strategic moat in its capital-light model and lean asset base, translating into efficient fixed asset turnover. It offers a safer balance sheet with a strong current ratio and low leverage compared to NOW. This makes it a candidate for Growth at a Reasonable Price (GARP) investors who prize financial stability amid growth.
If you prioritize high-growth momentum and operational cash flow strength, ServiceNow outshines due to its scalable SaaS platform and improving profitability. However, if you seek better balance sheet stability combined with growth potential, Perfect Corp. offers a more conservative profile with less financial risk. Both present analytical scenarios for different investor risk appetites and portfolio strategies.
Disclaimer: Investment carries a risk of loss of initial capital. The past performance is not a reliable indicator of future results. Be sure to understand risks before making an investment decision.
Go Further
I encourage you to read the complete analyses of ServiceNow, Inc. and Perfect Corp. to enhance your investment decisions: