In today’s fast-evolving technology landscape, selecting the right software company to invest in is crucial for portfolio growth. Pegasystems Inc. and ServiceTitan, Inc. both operate in the application software industry, yet they serve different niches and innovate uniquely within enterprise and field service solutions. This article will analyze their strengths and risks to help you identify which company holds the most promise for your investment strategy.

Table of contents
Companies Overview
I will begin the comparison between Pegasystems Inc. and ServiceTitan, Inc. by providing an overview of these two companies and their main differences.
Pegasystems Inc. Overview
Pegasystems Inc. develops and supports enterprise software applications globally, focusing on customer engagement and digital process automation. Its offerings include the Pega Platform and Pega Infinity, designed to streamline sales, customer service, and automation. Pegasystems targets industries like financial services, healthcare, government, and manufacturing, leveraging a direct sales force and partnerships to deliver solutions.
ServiceTitan, Inc. Overview
ServiceTitan, Inc. specializes in software solutions for field service activities involved in installing, maintaining, and servicing residential and commercial infrastructure. Founded in 2008, the company operates primarily in the U.S. and focuses on supporting field service management for various building systems. It is headquartered in Glendale, California, and serves the technology sector.
Key similarities and differences
Both companies operate in the software application industry within the technology sector and are listed on NASDAQ. Pegasystems focuses on enterprise software platforms and customer engagement automation across diverse industries, while ServiceTitan targets field service management software for infrastructure services. Pegasystems is the larger firm by market capitalization and employee count, whereas ServiceTitan is younger with a narrower operational focus.
Income Statement Comparison
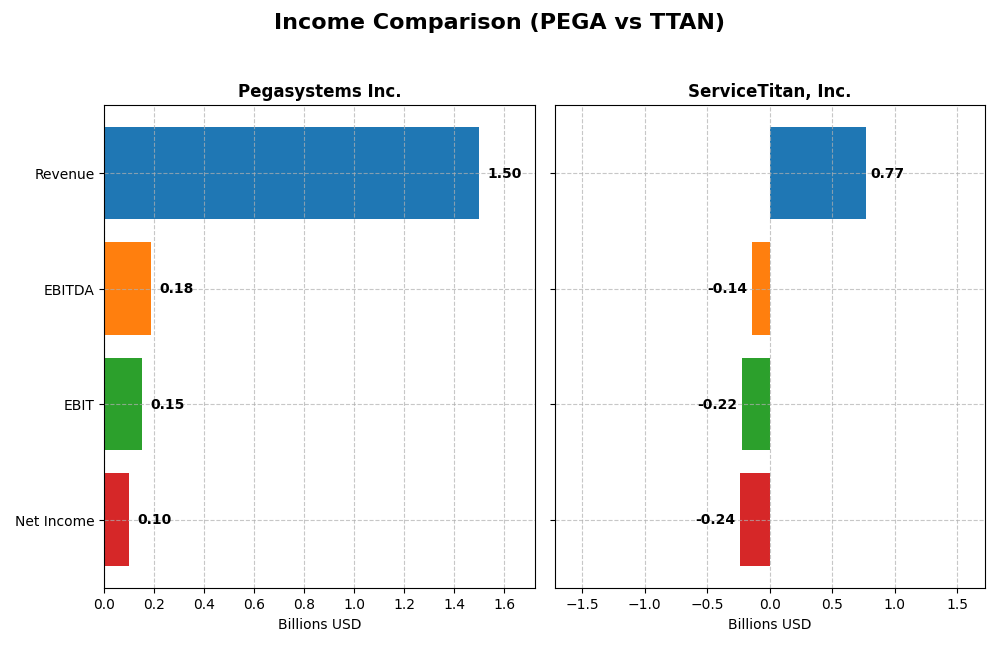
The table below compares the key income statement metrics for Pegasystems Inc. and ServiceTitan, Inc. based on the most recent fiscal year data available.
| Metric | Pegasystems Inc. (PEGA) | ServiceTitan, Inc. (TTAN) |
|---|---|---|
| Market Cap | 8.9B | 8.5B |
| Revenue | 1.50B | 772M |
| EBITDA | 185M | -141M |
| EBIT | 149M | -221M |
| Net Income | 99M | -239M |
| EPS | 0.58 | -8.53 |
| Fiscal Year | 2024 | 2025 |
Income Statement Interpretations
Pegasystems Inc.
Pegasystems Inc. has shown a steady increase in revenue from $1.02B in 2020 to $1.50B in 2024, with net income recovering from losses to $99M in 2024. Gross margins remain strong around 74%, while EBIT and net margins improved notably in 2024. The recent year saw favorable EBIT growth of 46% and net margin growth of 40%, indicating margin improvement and solid profitability progress.
ServiceTitan, Inc.
ServiceTitan’s revenue rose significantly from $468M in 2023 to $772M in 2025, with corresponding gross profit growth of 33%. However, EBIT and net margins stayed negative, worsening to -28.7% and -31% respectively in 2025. Despite a 26% revenue increase in the last year, EBIT declined by 27%, and EPS dropped sharply, reflecting ongoing operational challenges and unprofitable margins.
Which one has the stronger fundamentals?
Pegasystems presents stronger fundamentals with consistent revenue growth, positive EBIT and net margins, and overall favorable margin trends. ServiceTitan, while growing revenue rapidly, struggles with large negative margins and declining earnings. The income statement evaluations favor Pegasystems for profitability and margin stability, whereas ServiceTitan faces risks from persistent losses and unfavorable EBIT performance.
Financial Ratios Comparison
The table below presents a side-by-side comparison of key financial ratios for Pegasystems Inc. and ServiceTitan, Inc. based on their most recent fiscal year data, facilitating a clear view of their financial health and market valuation metrics.
| Ratios | Pegasystems Inc. (PEGA) | ServiceTitan, Inc. (TTAN) |
|---|---|---|
| ROE | 16.94% | -16.44% |
| ROIC | 7.40% | -14.11% |
| P/E | 80.12 | -18.12 |
| P/B | 13.57 | 2.98 |
| Current Ratio | 1.23 | 3.74 |
| Quick Ratio | 1.23 | 3.74 |
| D/E | 0.94 | 0.11 |
| Debt-to-Assets | 31.09% | 9.35% |
| Interest Coverage | 18.12 | -14.82 |
| Asset Turnover | 0.85 | 0.44 |
| Fixed Asset Turnover | 14.36 | 9.57 |
| Payout ratio | 10.28% | 0% |
| Dividend yield | 0.13% | 0% |
Interpretation of the Ratios
Pegasystems Inc.
Pegasystems shows a mixed ratio profile with favorable return on equity (16.94%) and strong interest coverage (21.87), indicating efficient capital use and debt servicing. However, high PE (80.12) and PB (13.57) ratios suggest the stock may be overvalued. The dividend yield is low at 0.13%, reflecting modest shareholder returns with potential risk from limited payout.
ServiceTitan, Inc.
ServiceTitan’s ratios reveal challenges with negative net margin (-30.98%) and return on equity (-16.44%), signaling operational losses and weak profitability. The company maintains a low debt level (debt-to-assets 9.35%) and a favorable weighted average cost of capital (4.95%). It does not pay dividends, likely reflecting a reinvestment or growth strategy amid ongoing losses.
Which one has the best ratios?
Pegasystems displays a slightly favorable ratio profile overall, balancing solid profitability and debt metrics despite valuation concerns. ServiceTitan presents a slightly unfavorable profile due to persistent losses and weak returns, though it benefits from low leverage and cost of capital. Pegasystems’ ratios are generally stronger in profitability and coverage measures.
Strategic Positioning
This section compares the strategic positioning of Pegasystems Inc. and ServiceTitan, Inc., including market position, key segments, and exposure to technological disruption:
Pegasystems Inc.
- Established player with $8.9B market cap, facing moderate competitive pressure in enterprise software.
- Diversified revenue streams: cloud services, consulting, subscription licenses, and maintenance.
- Provides enterprise software platforms and intelligent automation, exposed to software innovation demands.
ServiceTitan, Inc.
- Mid-sized company with $8.5B market cap, operating in field service software with specific competition.
- Concentrated revenue from platform and subscription services for field service management.
- Focuses on infrastructure service software, potentially less exposed to broad technological disruption.
Pegasystems Inc. vs ServiceTitan, Inc. Positioning
Pegasystems shows a diversified business model with multiple software segments and geographic reach, offering stability but complexity. ServiceTitan concentrates on field service infrastructure software, providing focus but less diversification and potentially higher segment risk.
Which has the best competitive advantage?
Both companies are currently shedding value with ROIC below WACC; Pegasystems has a slightly unfavorable moat with improving profitability, whereas ServiceTitan holds an unfavorable moat with stable but negative value creation.
Stock Comparison
The stock price movements of Pegasystems Inc. and ServiceTitan, Inc. over the past 12 months reveal contrasting trends, with Pegasystems showing strong gains despite recent pullbacks, while ServiceTitan faces ongoing declines with some signs of short-term stabilization.
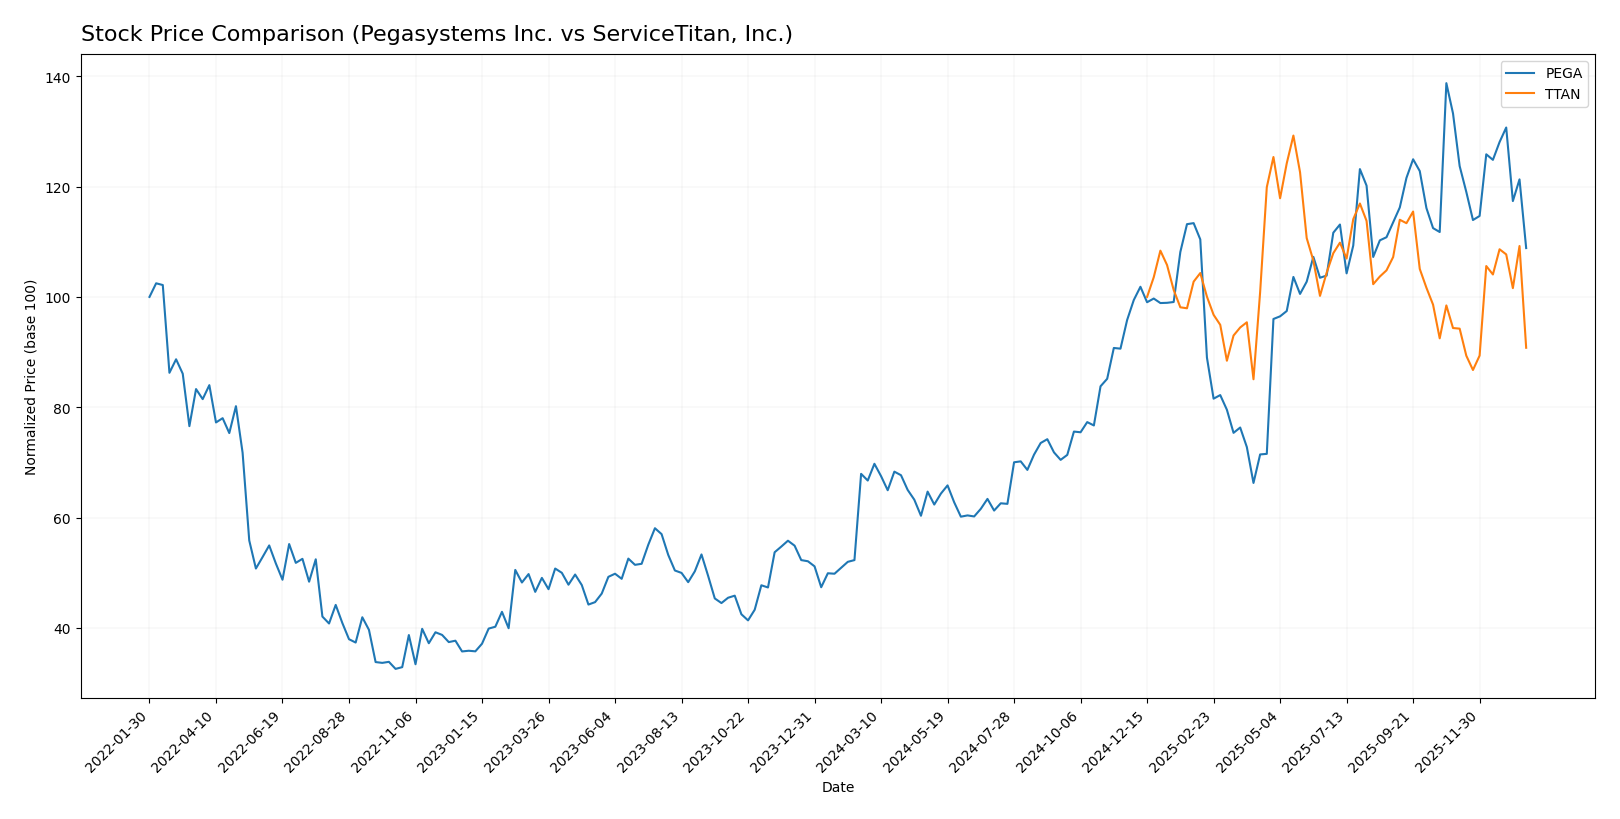
Trend Analysis
Pegasystems Inc. experienced a bullish trend over the past year, with a 63.18% price increase and decelerating momentum. The stock reached a high of 66.27 and a low of 28.73, with moderate volatility (std deviation 10.77). Recently, it showed a short-term bearish correction of -18.32%.
ServiceTitan, Inc. showed a bearish trend over the year, declining by 9.22% with accelerating downward momentum. Its price fluctuated between 85.07 and 129.26, with volatility at 9.86. Recently, a mild decline of -3.79% occurred, despite a slightly positive trend slope.
Comparing both, Pegasystems delivered the highest market performance with a substantial annual gain, while ServiceTitan posted a negative return, indicating stronger momentum for Pegasystems in this period.
Target Prices
The consensus target prices for Pegasystems Inc. and ServiceTitan, Inc. indicate positive analyst expectations.
| Company | Target High | Target Low | Consensus |
|---|---|---|---|
| Pegasystems Inc. | 80 | 67 | 74 |
| ServiceTitan, Inc. | 145 | 117 | 132.44 |
Analysts foresee Pegasystems shares rising significantly above the current $51.99 price, while ServiceTitan’s consensus target of $132.44 suggests a strong upside from its $90.78 trading level.
Analyst Opinions Comparison
This section compares analysts’ ratings and grades for Pegasystems Inc. and ServiceTitan, Inc.:
Rating Comparison
PEGA Rating
- Rating: B+, indicating a very favorable overall assessment.
- Discounted Cash Flow Score: Moderate at 3, reflecting average valuation based on future cash flows.
- ROE Score: Very favorable at 5, demonstrating efficient profit generation from equity.
- ROA Score: Very favorable at 5, showing effective asset utilization.
- Debt To Equity Score: Moderate at 3, suggesting an average financial risk level.
- Overall Score: Moderate at 3, representing an average overall financial standing.
TTAN Rating
- Rating: C-, showing a very unfavorable overall assessment.
- Discounted Cash Flow Score: Very unfavorable at 1, signaling poor valuation outlook.
- ROE Score: Very unfavorable at 1, indicating weak profitability from equity.
- ROA Score: Very unfavorable at 1, reflecting poor asset use efficiency.
- Debt To Equity Score: Moderate at 3, indicating similar financial risk to PEGA.
- Overall Score: Very unfavorable at 1, indicating a weak overall financial position.
Which one is the best rated?
Based strictly on the provided data, Pegasystems Inc. is better rated than ServiceTitan, Inc. PEGA has higher scores in ROE, ROA, and overall financial standing, while TTAN shows very unfavorable ratings in these key areas.
Scores Comparison
Here is the comparison of the Altman Z-Score and Piotroski Score for Pegasystems Inc. and ServiceTitan, Inc.:
PEGA Scores
- Altman Z-Score: 10.31, indicating a safe zone.
- Piotroski Score: 8, classified as very strong.
TTAN Scores
- Altman Z-Score: 15.74, indicating a safe zone.
- Piotroski Score: 6, classified as average.
Which company has the best scores?
ServiceTitan has a higher Altman Z-Score than Pegasystems, suggesting stronger financial stability. However, Pegasystems has a notably higher Piotroski Score, indicating stronger overall financial health.
Grades Comparison
Here is a comparison of the latest reliable grades assigned to Pegasystems Inc. and ServiceTitan, Inc.:
Pegasystems Inc. Grades
The table below summarizes recent grades from reputable financial institutions for Pegasystems Inc.:
| Grading Company | Action | New Grade | Date |
|---|---|---|---|
| JP Morgan | Maintain | Overweight | 2025-12-05 |
| Wedbush | Maintain | Outperform | 2025-10-23 |
| RBC Capital | Maintain | Outperform | 2025-10-23 |
| Barclays | Maintain | Equal Weight | 2025-10-23 |
| Rosenblatt | Maintain | Buy | 2025-10-23 |
| DA Davidson | Upgrade | Buy | 2025-10-22 |
| Rosenblatt | Maintain | Buy | 2025-10-15 |
| Rosenblatt | Maintain | Buy | 2025-07-24 |
| DA Davidson | Maintain | Neutral | 2025-07-24 |
| Wedbush | Maintain | Outperform | 2025-07-24 |
Pegasystems shows a consistent buy-side sentiment, with multiple upgrades and maintained ratings predominantly in the buy to outperform range.
ServiceTitan, Inc. Grades
Below is the latest grade data from recognized institutions for ServiceTitan, Inc.:
| Grading Company | Action | New Grade | Date |
|---|---|---|---|
| Piper Sandler | Maintain | Overweight | 2025-12-05 |
| BMO Capital | Maintain | Outperform | 2025-12-05 |
| TD Cowen | Maintain | Buy | 2025-12-05 |
| Morgan Stanley | Maintain | Equal Weight | 2025-12-05 |
| BMO Capital | Maintain | Outperform | 2025-11-20 |
| Wells Fargo | Maintain | Overweight | 2025-09-19 |
| Stifel | Maintain | Buy | 2025-09-19 |
| Piper Sandler | Maintain | Overweight | 2025-09-19 |
| Canaccord Genuity | Maintain | Buy | 2025-09-19 |
| Citigroup | Maintain | Neutral | 2025-09-09 |
ServiceTitan maintains a strong buy and outperform consensus with no downgrades, highlighting sustained positive analyst confidence.
Which company has the best grades?
Both companies have mostly buy to outperform grades, but Pegasystems has a slightly higher number of buy ratings. This suggests marginally stronger analyst conviction, which could influence investor confidence and portfolio positioning.
Strengths and Weaknesses
Below is a comparative overview of Pegasystems Inc. (PEGA) and ServiceTitan, Inc. (TTAN) focusing on key financial and market criteria.
| Criterion | Pegasystems Inc. (PEGA) | ServiceTitan, Inc. (TTAN) |
|---|---|---|
| Diversification | Diverse revenue streams: Pega Cloud (1.13B), Subscription License (398M), Maintenance (341M), Consulting (213M) | Focused on platform (739M) and subscription revenue (566M), less diversified |
| Profitability | Neutral net margin at 6.63%, favorable ROE 16.94%, ROIC 7.4% slightly below WACC (8.58%) | Negative net margin (-30.98%), negative ROE (-16.44%) and ROIC (-14.11%) |
| Innovation | Strong growth in cloud-based services, fixed asset turnover favorable (14.36) | Innovation indicated by platform revenue growth but overall profitability weak |
| Global presence | Established global footprint with multiple product lines supporting different markets | Primarily focused on North American market, smaller global reach |
| Market Share | Solid presence in enterprise software with strong recurring revenue | Growing market share in service industry software but competitive pressure high |
Key takeaways: Pegasystems shows more diversification and moderate profitability with improving returns, making it a stable albeit slightly unfavorable investment. ServiceTitan, while innovative and with favorable capital structure, struggles with profitability and value destruction, posing higher risk for investors.
Risk Analysis
Below is a summary table highlighting key risk factors for Pegasystems Inc. (PEGA) and ServiceTitan, Inc. (TTAN) based on their most recent financial and market data.
| Metric | Pegasystems Inc. (PEGA) | ServiceTitan, Inc. (TTAN) |
|---|---|---|
| Market Risk | Beta 1.08 (moderate volatility) | Beta -0.85 (inverse correlation, unusual market behavior) |
| Debt Level | Debt-to-Equity 0.94 (neutral) | Debt-to-Equity 0.11 (low leverage, favorable) |
| Regulatory Risk | Moderate (Tech sector, US focus) | Moderate (Tech sector, US focus) |
| Operational Risk | Established with 5.4K employees, diversified client base | Smaller scale (3K employees), newer IPO (2024), potential growth risks |
| Environmental Risk | Low (software sector, limited direct impact) | Low (software sector, limited direct impact) |
| Geopolitical Risk | Moderate (operates globally, exposed to US and Europe) | Moderate (primarily US market exposure) |
In synthesis, Pegasystems exhibits moderate market and debt risks but benefits from a diversified global footprint and strong financial stability. ServiceTitan shows lower debt risk but faces significant operational risks due to its recent IPO and negative profitability metrics in 2025. Market volatility and profitability challenges at ServiceTitan pose the most impactful risks for investors currently.
Which Stock to Choose?
Pegasystems Inc. (PEGA) shows a favorable income evolution with 47.14% revenue growth and 261.62% net income growth over 2020-2024. Financial ratios are slightly favorable overall, with strong profitability, manageable debt, and a very favorable rating of B+. The company’s ROIC trend grows but remains below WACC, indicating slight value destruction despite improving profitability.
ServiceTitan, Inc. (TTAN) presents a mixed income profile with 65.02% revenue growth but negative net margin and declining profitability from 2023-2025. Its financial ratios are slightly unfavorable, reflecting weak profitability and some financial stress. The rating is very favorable C-, but the company is shedding value with an unfavorable moat status and moderate debt levels.
Investors focused on growth might find PEGA’s improving profitability and stable rating more appealing, while those with higher risk tolerance could consider TTAN’s strong revenue growth despite profitability challenges. The choice may depend on whether the investor prioritizes financial stability or aggressive expansion potential.
Disclaimer: Investment carries a risk of loss of initial capital. The past performance is not a reliable indicator of future results. Be sure to understand risks before making an investment decision.
Go Further
I encourage you to read the complete analyses of Pegasystems Inc. and ServiceTitan, Inc. to enhance your investment decisions: