Home > Comparison > Technology > NOW vs PEGA
The strategic rivalry between ServiceNow, Inc. and Pegasystems Inc. shapes the evolution of the enterprise software sector. ServiceNow operates as a capital-intensive cloud platform leader, delivering broad workflow automation across industries. Pegasystems focuses on high-margin, customer engagement software with a specialized approach to digital process automation. This head-to-head pits scale and integration against focused innovation. This analysis will identify which trajectory offers superior risk-adjusted returns for a diversified portfolio.
Table of contents
Companies Overview
ServiceNow and Pegasystems shape the enterprise software market with distinct platforms and automation focuses.
ServiceNow, Inc.: Enterprise Cloud Workflow Leader
ServiceNow dominates enterprise cloud computing with its Now platform, driving workflow automation through AI, machine learning, and robotic process automation. Its revenue stems from IT service management, security operations, and customer service applications. In 2026, ServiceNow strategically partners with Celonis to enhance automation prioritization, reinforcing its position in digital transformation.
Pegasystems Inc.: Customer Engagement and Automation Specialist
Pegasystems excels in customer engagement software and digital process automation via Pega Platform and Pega Infinity. It generates revenue from licensing, hosting, and supporting software that enhances sales, service, and marketing automation. Pegasystems focuses on expanding cloud-based solutions and intelligent automation to boost customer experience and operational efficiency in 2026.
Strategic Collision: Similarities & Divergences
Both companies emphasize automation but diverge in core philosophies: ServiceNow builds a broad IT workflow ecosystem, while Pegasystems centers on customer engagement and sales process automation. Their primary battleground is enterprise digital transformation, competing for clients seeking integrated automation. ServiceNow offers scale and breadth; Pegasystems delivers specialized customer-centric solutions, defining their unique investment appeal.
Income Statement Comparison
This table dissects the core profitability and scalability of both corporate engines to reveal who dominates the bottom line:
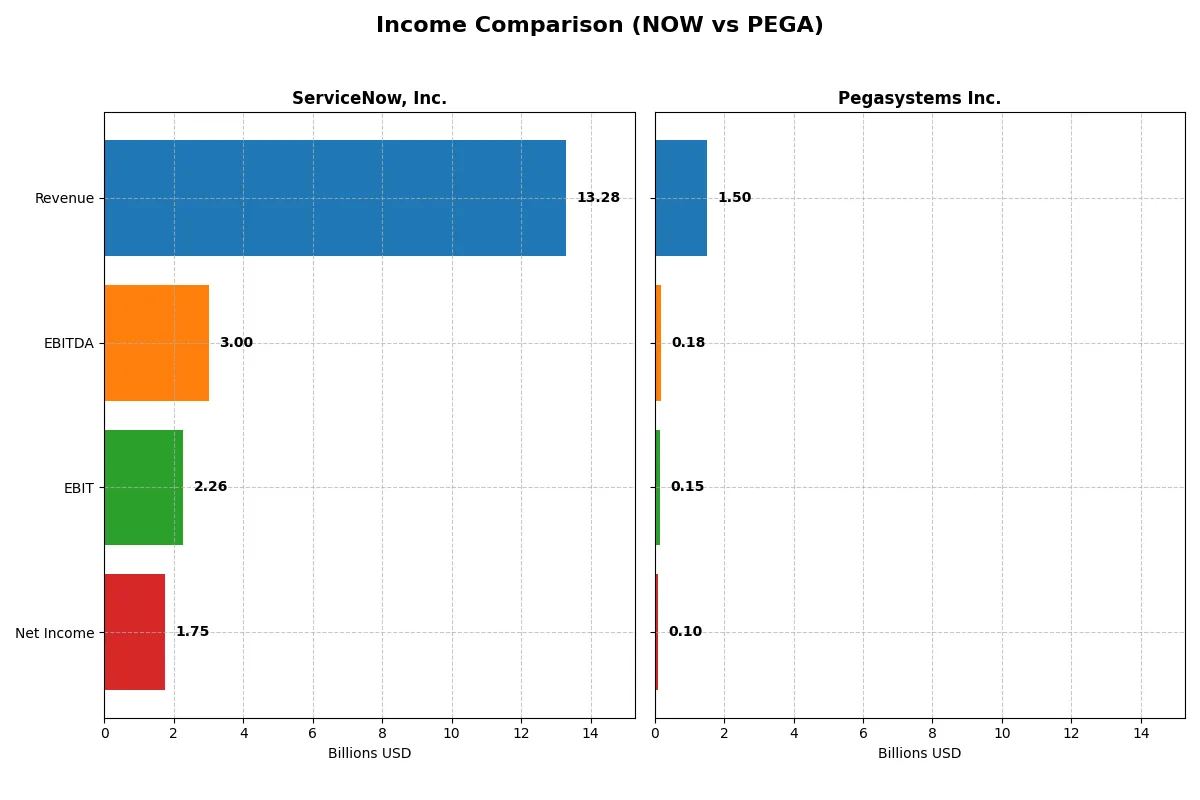
| Metric | ServiceNow, Inc. (NOW) | Pegasystems Inc. (PEGA) |
|---|---|---|
| Revenue | 13.3B | 1.5B |
| Cost of Revenue | 3.0B | 391M |
| Operating Expenses | 8.5B | 983M |
| Gross Profit | 10.3B | 1.1B |
| EBITDA | 3.0B | 185M |
| EBIT | 2.3B | 149M |
| Interest Expense | 0 | 7M |
| Net Income | 1.7B | 99M |
| EPS | 1.69 | 0.58 |
| Fiscal Year | 2025 | 2024 |
Income Statement Analysis: The Bottom-Line Duel
This income statement comparison reveals which company drives stronger revenue growth and profitability efficiency in their competitive landscape.
ServiceNow, Inc. Analysis
ServiceNow’s revenue surged from 5.9B in 2021 to 13.3B in 2025, reflecting robust expansion. Net income expanded sixfold, hitting 1.75B in 2025. The company sustains a healthy gross margin above 77% and a net margin exceeding 13%, indicating strong cost control and operational leverage. Momentum remains favorable with a 21% revenue jump and 28% EBIT growth in 2025.
Pegasystems Inc. Analysis
Pegasystems grew revenue steadily from 1.0B in 2020 to 1.5B in 2024. Net income rebounded sharply from losses to nearly 100M in 2024. Its gross margin holds firm near 74%, while net margin improved to 6.6%, showcasing improving profitability. EBIT growth accelerated by 46% in 2024, signaling effective expense management and operational recovery.
Growth Leadership vs. Profitability Resilience
ServiceNow dominates with superior scale and margin expansion, achieving higher absolute profits and faster revenue growth. Pegasystems shows notable margin recovery and earnings momentum but on a much smaller base. For investors prioritizing growth and robust profitability, ServiceNow’s profile offers a more compelling fundamental foundation.
Financial Ratios Comparison
These vital ratios act as a diagnostic tool to expose the underlying fiscal health, valuation premiums, and capital efficiency of the companies compared below:
| Ratios | ServiceNow, Inc. (NOW) | Pegasystems Inc. (PEGA) |
|---|---|---|
| ROE | 13.48% | 16.94% |
| ROIC | 8.98% | 7.40% |
| P/E | 90.88 | 80.12 |
| P/B | 12.25 | 13.57 |
| Current Ratio | 0.95 | 1.23 |
| Quick Ratio | 0.95 | 1.23 |
| D/E | 0.25 | 0.94 |
| Debt-to-Assets | 12.30% | 31.09% |
| Interest Coverage | 0 | 18.12 |
| Asset Turnover | 0.51 | 0.85 |
| Fixed Asset Turnover | 4.29 | 14.36 |
| Payout ratio | 0 | 10.28% |
| Dividend yield | 0 | 0.13% |
| Fiscal Year | 2025 | 2024 |
Efficiency & Valuation Duel: The Vital Signs
Financial ratios serve as a company’s DNA, unlocking insights into its hidden risks and operational strength.
ServiceNow, Inc.
ServiceNow posts a solid 13.5% ROE and favorable 13.2% net margin, showing operational effectiveness. Its P/E at 90.9 signals an expensive valuation, reflecting high growth expectations. The company pays no dividend but reinvests heavily in R&D (22.3% of revenue), driving innovation and future growth. The slightly unfavorable liquidity ratio (0.95) is a caution.
Pegasystems Inc.
Pegasystems delivers a stronger 16.9% ROE but a more modest 6.6% net margin, indicating efficient capital use but tighter profitability. Its P/E ratio of 80.1 also suggests a stretched valuation. Pegasystems offers a small 0.13% dividend yield, balancing shareholder returns with steady reinvestment in R&D (19.9% of revenue). The current ratio at 1.23 implies solid short-term liquidity.
Premium Valuation vs. Operational Safety
ServiceNow commands a premium valuation with solid margins and reinvestment but shows liquidity risks. Pegasystems offers higher ROE and better liquidity but lower profitability. Investors seeking growth and operational safety may prefer Pegasystems’ balanced profile, while those betting on innovation might lean toward ServiceNow.
Which one offers the Superior Shareholder Reward?
I see ServiceNow (NOW) pays no dividends, focusing on reinvestment and growth, while Pegasystems (PEGA) delivers a modest 0.13% dividend yield with a 10% payout ratio. NOW’s free cash flow per share stands at $4.41, nearly double PEGA’s $1.98, fueling aggressive buybacks. PEGA’s buyback impact is minimal, constrained by weaker cash flow and higher leverage. I find NOW’s zero-dividend, high FCF, and robust buyback model more sustainable and rewarding for long-term returns in 2026.
Comparative Score Analysis: The Strategic Profile
The radar chart reveals the fundamental DNA and trade-offs of ServiceNow and Pegasystems, highlighting their core financial strengths and valuation challenges:
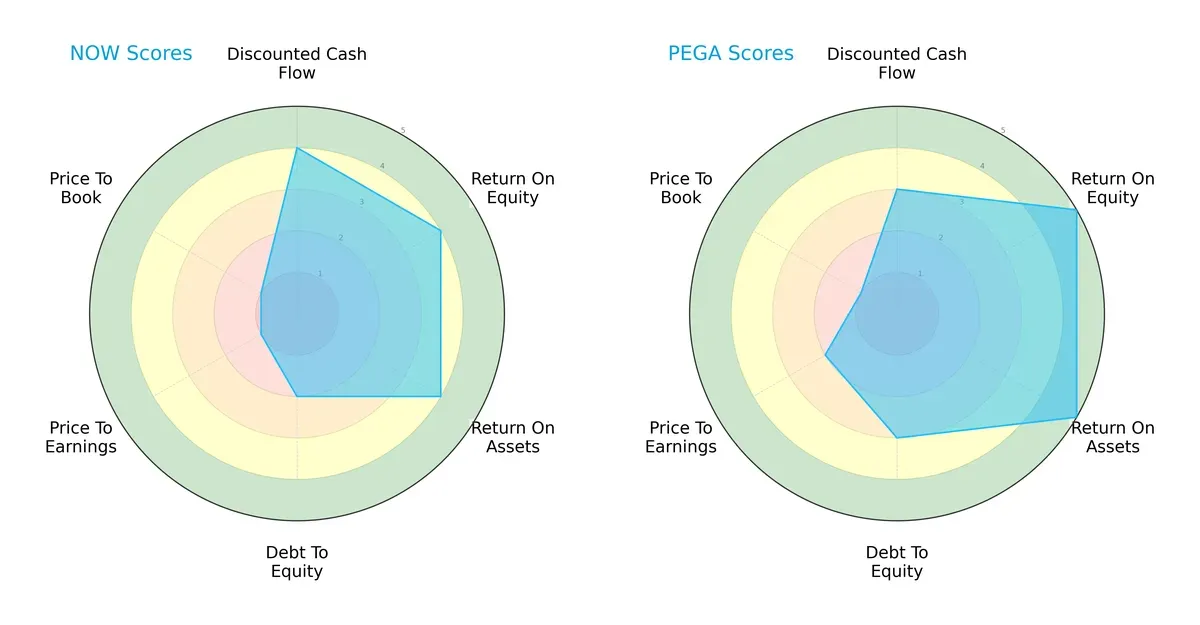
ServiceNow shows strength in discounted cash flow and solid returns on equity and assets but carries higher debt risk and poor valuation scores. Pegasystems excels in profitability metrics with top ROE and ROA scores and maintains moderate leverage, yet its valuation remains similarly weak. Pegasystems presents a more balanced profile with a clear profitability edge, while ServiceNow relies heavily on cash flow efficiency despite valuation weaknesses.
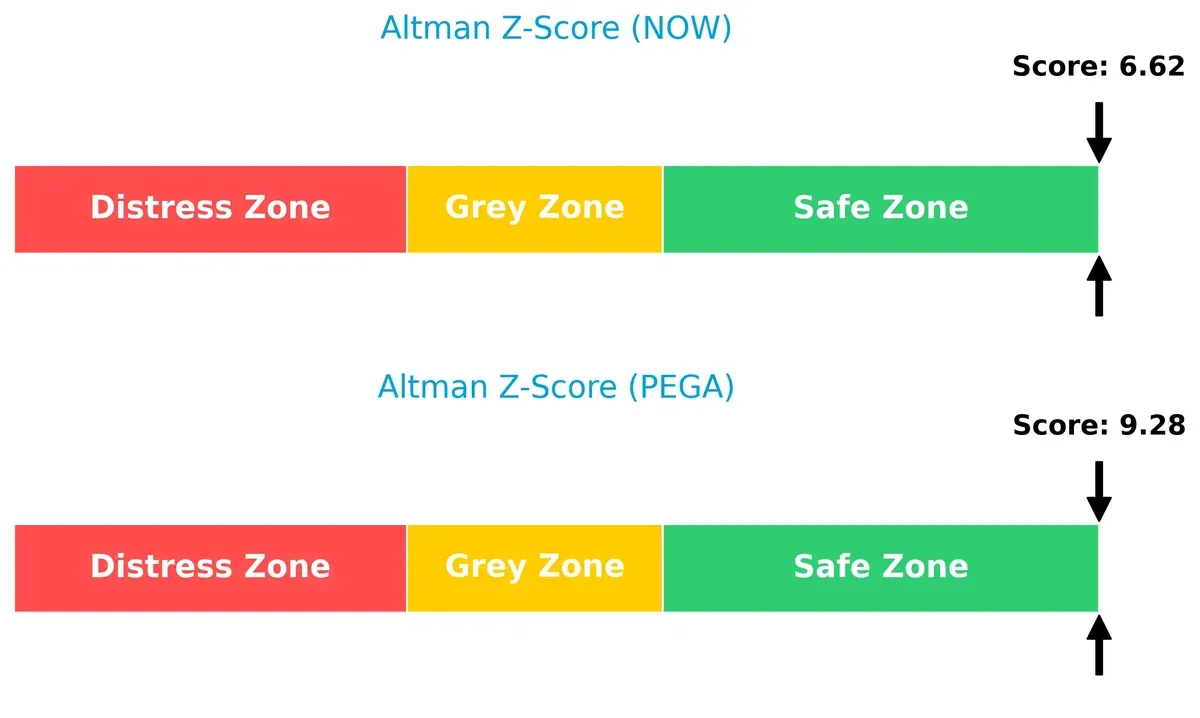
Bankruptcy Risk: Solvency Showdown
Pegasystems’ higher Altman Z-Score signals stronger long-term solvency than ServiceNow, implying a safer balance sheet in this late-cycle environment:
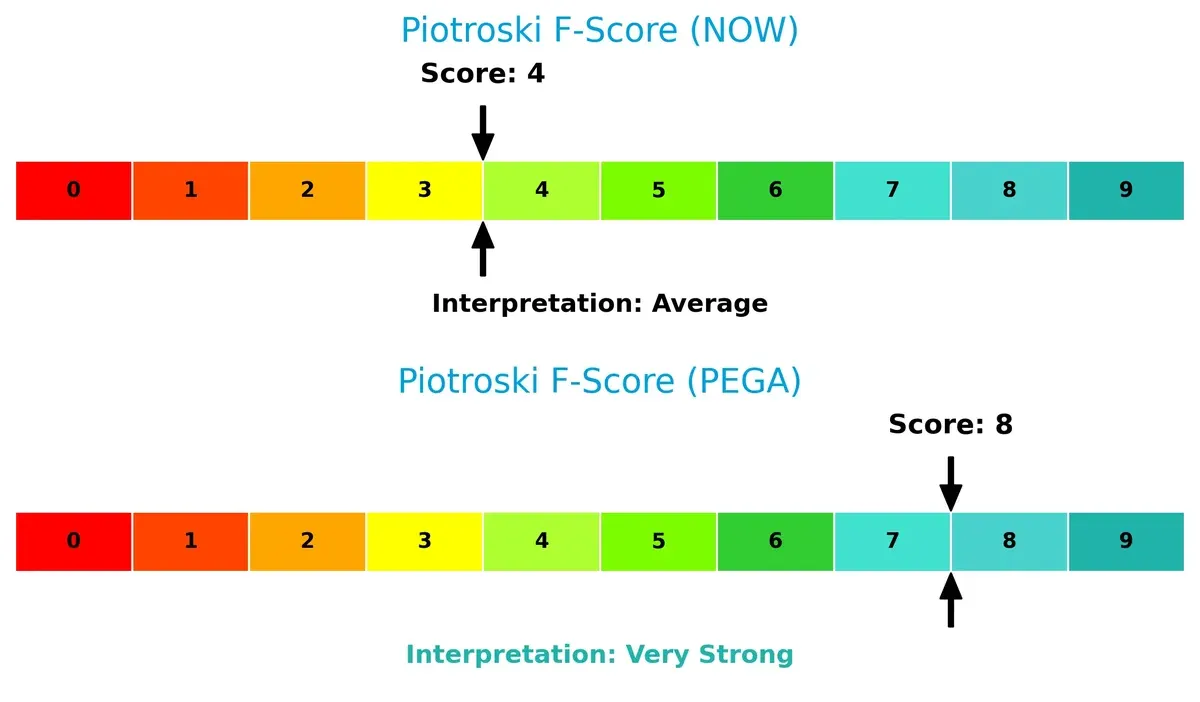
Financial Health: Quality of Operations
Pegasystems outperforms ServiceNow significantly in Piotroski F-Score, suggesting superior operational efficiency and fewer financial red flags:
How are the two companies positioned?
This section dissects the operational DNA of ServiceNow and Pegasystems by comparing their revenue distribution and internal strengths and weaknesses. The goal is to confront their economic moats and identify which model delivers the most resilient, sustainable competitive edge today.
Revenue Segmentation: The Strategic Mix
This visual comparison dissects how ServiceNow, Inc. and Pegasystems Inc. diversify income streams and where their primary sector bets lie:
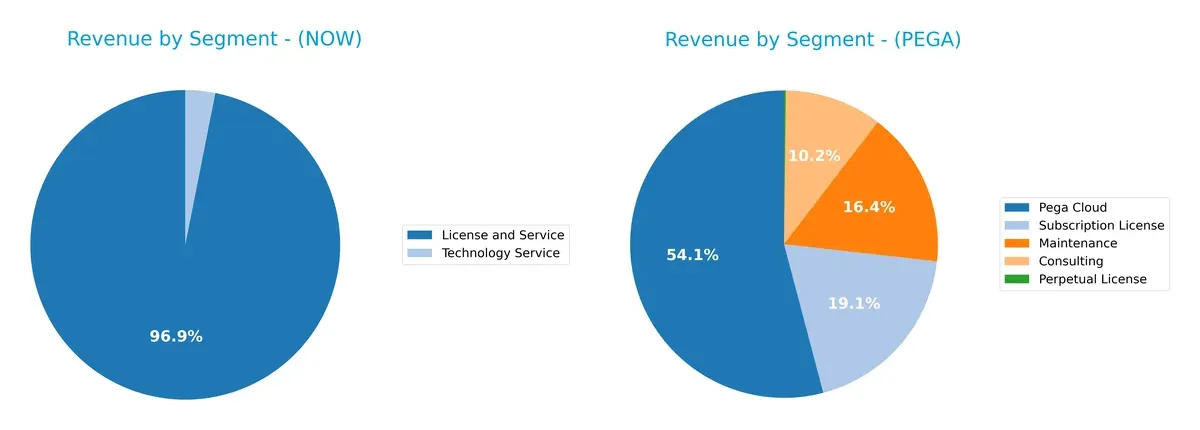
ServiceNow anchors revenue in License and Service, generating $12.9B in 2025, with minimal Technology Service at $414M. Pegasystems shows a more balanced mix: Pega Cloud leads with $1.13B, supported by Maintenance ($341M), Subscription License ($398M), and Consulting ($213M). ServiceNow’s focus signals infrastructure dominance but concentration risk. Pegasystems’ spread reflects ecosystem lock-in and resilience through diversified recurring revenue.
Strengths and Weaknesses Comparison
This table compares the Strengths and Weaknesses of ServiceNow and Pegasystems based on diversification, profitability, financials, innovation, global presence, and market share:
ServiceNow Strengths
- Strong revenue growth in License and Service, especially Digital Workflow
- Favorable net margin at 13.16%
- Low debt-to-assets ratio at 12.3%
- High fixed asset turnover at 4.29
- Largest revenue from North America, showing strong market presence
Pegasystems Strengths
- Favorable ROE at 16.94%, indicating efficient equity use
- Strong fixed asset turnover at 14.36
- Favorable interest coverage ratio at 21.87
- Favorable quick ratio at 1.23 indicates liquidity
- Diverse revenue streams including Consulting, Cloud, and Subscription
ServiceNow Weaknesses
- Unfavorable P/E (90.88) and P/B (12.25) ratios suggest overvaluation
- Current ratio below 1.0 at 0.95 is a liquidity concern
- Zero dividend yield limits income appeal
- ROE and ROIC only neutral
- Moderate global diversification, heavy reliance on North America
Pegasystems Weaknesses
- Unfavorable valuation multiples with P/E at 80.12 and P/B at 13.57
- Lower net margin at 6.63% compared to peers
- Debt-to-equity is relatively high at 0.94
- Dividend yield remains minimal at 0.13%
- Global revenue less concentrated in high-growth Asia Pacific region
The comparison reveals ServiceNow’s strength lies in profitability and financial stability, though valuation and liquidity raise caution. Pegasystems shows efficiency and liquidity strengths but faces margin and valuation pressures. Both companies maintain slightly favorable overall financial ratios with distinct strategic challenges.
The Moat Duel: Analyzing Competitive Defensibility
A structural moat is the only true shield protecting long-term profits from relentless competitive erosion. Here’s how ServiceNow and Pegasystems stack up:
ServiceNow, Inc.: Workflow Automation Switching Costs
ServiceNow’s moat centers on high switching costs embedded in its Now platform. Its financials reveal stable margins and robust 17% EBIT margin, signaling efficiency. Expansion into AI-driven automation in 2026 should deepen this moat.
Pegasystems Inc.: Intelligent Customer Engagement Intangibles
Pegasystems relies on intangible assets like advanced AI in customer engagement, contrasting with ServiceNow’s platform lock-in. Though EBIT margin is lower at 10%, rising profitability and expanding cloud offerings hint at growth potential in 2026.
Switching Costs vs. Intangible Assets: The Moat Face-Off
ServiceNow’s wider moat is evident in superior margin stability and faster revenue growth. Pegasystems improves profitability but lags in value creation. ServiceNow is better positioned to defend and grow its market share long term.
Which stock offers better returns?
The past year reveals divergent paths: ServiceNow, Inc. shows a marked decline, while Pegasystems Inc. posts solid gains despite recent softness.
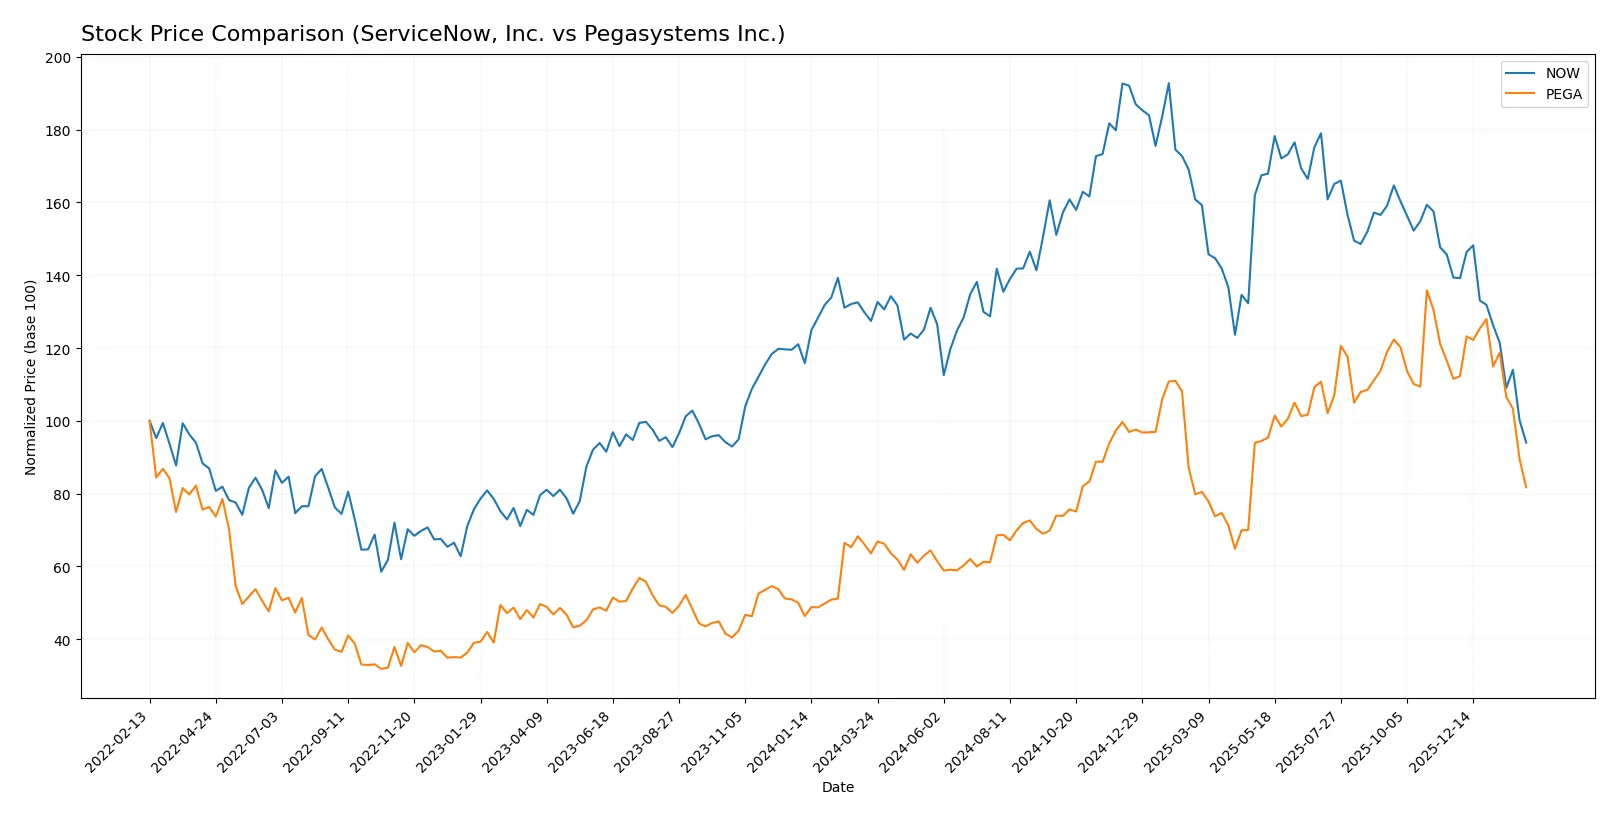
Trend Comparison
ServiceNow, Inc.’s stock fell 26.22% over the past 12 months, confirming a bearish trend with decelerating losses and a high volatility of 25.07. The price peaked at 225.0 and bottomed at 109.77.
Pegasystems Inc. gained 28.56% in the same period, indicating a bullish trend with deceleration and lower volatility at 10.62. The stock’s high was 66.27, and its low was 28.73.
Pegasystems outperformed ServiceNow over the year, delivering positive returns versus ServiceNow’s significant decline in market value.
Target Prices
Analysts show a wide range in target prices but generally expect significant upside from current levels.
| Company | Target Low | Target High | Consensus |
|---|---|---|---|
| ServiceNow, Inc. | 115 | 1315 | 440.64 |
| Pegasystems Inc. | 67 | 80 | 74 |
ServiceNow’s consensus target at 440.64 far exceeds its current 109.77 price, signaling strong growth expectations. Pegasystems’ 74 target consensus also suggests meaningful appreciation from the 39.88 current price.

Don’t Let Luck Decide Your Entry Point
Optimize your entry points with our advanced ProRealTime indicators. You’ll get efficient buy signals with precise price targets for maximum performance. Start outperforming now!
How do institutions grade them?
Here is a comparison of institutional grades for ServiceNow, Inc. and Pegasystems Inc.:
ServiceNow, Inc. Grades
The latest grading updates from major financial institutions for ServiceNow are detailed below.
| Grading Company | Action | New Grade | Date |
|---|---|---|---|
| Citigroup | Maintain | Buy | 2026-01-30 |
| Evercore ISI Group | Maintain | Outperform | 2026-01-29 |
| Macquarie | Maintain | Neutral | 2026-01-29 |
| BTIG | Maintain | Buy | 2026-01-29 |
| RBC Capital | Maintain | Outperform | 2026-01-29 |
| Keybanc | Maintain | Underweight | 2026-01-29 |
| Stifel | Maintain | Buy | 2026-01-29 |
| DA Davidson | Maintain | Buy | 2026-01-29 |
| Cantor Fitzgerald | Maintain | Overweight | 2026-01-29 |
| Needham | Maintain | Buy | 2026-01-29 |
Pegasystems Inc. Grades
These ratings reflect the most recent institutional views on Pegasystems.
| Grading Company | Action | New Grade | Date |
|---|---|---|---|
| JP Morgan | Maintain | Overweight | 2025-12-05 |
| Wedbush | Maintain | Outperform | 2025-10-23 |
| RBC Capital | Maintain | Outperform | 2025-10-23 |
| Barclays | Maintain | Equal Weight | 2025-10-23 |
| Rosenblatt | Maintain | Buy | 2025-10-23 |
| DA Davidson | Upgrade | Buy | 2025-10-22 |
| Rosenblatt | Maintain | Buy | 2025-10-15 |
| Wedbush | Maintain | Outperform | 2025-07-24 |
| Loop Capital | Maintain | Buy | 2025-07-24 |
| Citigroup | Maintain | Buy | 2025-07-24 |
Which company has the best grades?
ServiceNow holds a broader consensus of Buy and Outperform ratings, with multiple top-tier firms maintaining positive outlooks. Pegasystems also receives generally favorable grades, though with fewer recent updates. Investors might view ServiceNow’s consistent “Buy” and “Outperform” endorsements as a stronger institutional confidence signal.
Risks specific to each company
The following risk categories identify critical pressure points and systemic threats facing ServiceNow, Inc. and Pegasystems Inc. in the 2026 market environment:
1. Market & Competition
ServiceNow, Inc.
- Faces intense rivalry from large cloud software firms; premium valuation limits margin for error.
Pegasystems Inc.
- Operates in a competitive niche with smaller scale but benefits from diversified industry focus.
2. Capital Structure & Debt
ServiceNow, Inc.
- Maintains conservative debt levels (D/E 0.25) with strong interest coverage, signaling low financial risk.
Pegasystems Inc.
- Higher leverage (D/E 0.94) increases vulnerability but manageable given solid interest coverage.
3. Stock Volatility
ServiceNow, Inc.
- Beta near 1.0 shows market-correlated volatility; valuation compression risks amplify downside.
Pegasystems Inc.
- Slightly higher beta (1.07) indicates modestly elevated volatility relative to market benchmarks.
4. Regulatory & Legal
ServiceNow, Inc.
- Subject to US and global data privacy regulations; no notable legal overhangs reported.
Pegasystems Inc.
- Faces similar regulatory landscape; global operations increase complexity of compliance.
5. Supply Chain & Operations
ServiceNow, Inc.
- Cloud-based delivery reduces supply chain risk but relies on third-party data centers.
Pegasystems Inc.
- Also cloud-centric; smaller scale may limit negotiating power with infrastructure providers.
6. ESG & Climate Transition
ServiceNow, Inc.
- Increasing focus on sustainable IT solutions enhances ESG profile but raises operational costs.
Pegasystems Inc.
- ESG initiatives underway but lagging larger peers, which could affect institutional investor interest.
7. Geopolitical Exposure
ServiceNow, Inc.
- Significant US-centric revenue reduces geopolitical risk but limits global diversification.
Pegasystems Inc.
- More global footprint exposes it to geopolitical tensions but offers growth opportunities abroad.
Which company shows a better risk-adjusted profile?
ServiceNow’s most impactful risk is its expensive valuation amid market volatility, raising downside risk. Pegasystems faces higher financial leverage but benefits from a robust Piotroski score and stronger operational efficiency. Despite ServiceNow’s scale advantage, Pegasystems presents a better risk-adjusted profile due to healthier liquidity and stronger financial strength signals, as evidenced by its Altman Z-score and Piotroski rating.
Final Verdict: Which stock to choose?
ServiceNow, Inc. shines as a cash-generating powerhouse with robust revenue and earnings growth. Its superpower lies in scaling efficiently while maintaining high margins. A point of vigilance is its stretched liquidity position, which could pressure short-term flexibility. It suits portfolios targeting aggressive growth with tolerance for valuation risk.
Pegasystems Inc. offers a strategic moat through steady recurring revenue streams and operational discipline. Its stronger balance sheet and healthier liquidity provide a safety cushion relative to ServiceNow. This makes it attractive for investors seeking GARP (Growth at a Reasonable Price) profiles, balancing growth with financial prudence.
If you prioritize high-growth scalability and can absorb valuation premiums, ServiceNow outshines with its accelerating profitability. However, if you seek better financial stability and a more conservative growth pace, Pegasystems offers a safer harbor with solid operational metrics. Both present slightly favorable prospects, but your risk appetite and investment horizon should guide the analytical scenario you choose.
Disclaimer: Investment carries a risk of loss of initial capital. The past performance is not a reliable indicator of future results. Be sure to understand risks before making an investment decision.
Go Further
I encourage you to read the complete analyses of ServiceNow, Inc. and Pegasystems Inc. to enhance your investment decisions: