In the dynamic world of technology-driven software, The Trade Desk, Inc. (TTD) and Paycom Software, Inc. (PAYC) stand out as innovators in their respective niches. Both companies operate in the application software industry, with TTD focusing on data-driven digital advertising and PAYC delivering cloud-based human capital management solutions. This comparison explores their market strategies and growth potential, helping you decide which stock could be the smarter addition to your investment portfolio.
Table of contents
Companies Overview
I will begin the comparison between The Trade Desk and Paycom Software by providing an overview of these two companies and their main differences.
The Trade Desk Overview
The Trade Desk, Inc. operates a self-service cloud-based platform that enables buyers to create, manage, and optimize data-driven digital advertising campaigns across various formats and devices. Founded in 2009 and headquartered in Ventura, California, it serves advertising agencies and service providers globally, positioning itself as a leading technology company in the digital advertising industry with a market cap of approximately 17.3B USD.
Paycom Software Overview
Paycom Software, Inc. offers a cloud-based human capital management (HCM) solution as software-as-a-service, targeting small to mid-sized U.S. companies. Founded in 1998 and based in Oklahoma City, Oklahoma, it provides a comprehensive suite of applications covering recruitment, payroll, talent management, and compliance. With a market cap near 8.3B USD, Paycom focuses on simplifying workforce management through advanced data analytics and user-friendly interfaces.
Key similarities and differences
Both The Trade Desk and Paycom operate within the technology sector, specializing in cloud-based application software. They serve distinct markets: The Trade Desk focuses on digital advertising optimization, while Paycom centers on human capital management. Each company leverages data-driven platforms to enhance client operations but differs in target customers, industry applications, and scale, with The Trade Desk holding a larger market capitalization and fewer employees compared to Paycom.
Income Statement Comparison
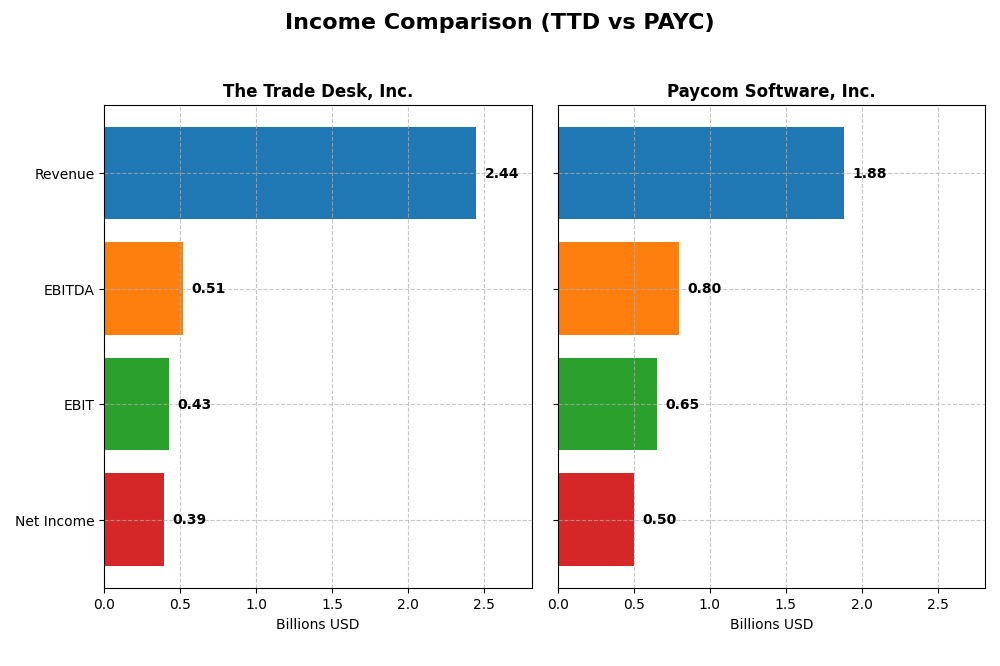
The table below presents a side-by-side comparison of key income statement metrics for The Trade Desk, Inc. and Paycom Software, Inc. for the fiscal year 2024.
| Metric | The Trade Desk, Inc. | Paycom Software, Inc. |
|---|---|---|
| Market Cap | 17.3B | 8.3B |
| Revenue | 2.44B | 1.88B |
| EBITDA | 515M | 798M |
| EBIT | 427M | 652M |
| Net Income | 393M | 502M |
| EPS | 0.80 | 8.93 |
| Fiscal Year | 2024 | 2024 |
Income Statement Interpretations
The Trade Desk, Inc.
The Trade Desk, Inc. shows robust revenue growth from 2020 to 2024, increasing from 836M to 2.44B, with net income rising from 242M to 393M over the same period. Gross and EBIT margins remained favorable, though net margin saw a decline overall. In 2024, revenue growth accelerated by 25.6%, with significant improvements in EBIT and net margin, reflecting enhanced operational efficiency.
Paycom Software, Inc.
Paycom Software, Inc. experienced steady revenue growth from 841M in 2020 to 1.88B in 2024, with net income expanding significantly from 143M to 502M. Margins improved consistently, including a strong net margin of 26.7% in 2024. The latest year showed a solid 11.2% revenue increase, accompanied by a 32.5% rise in net margin, highlighting sustained profitability gains and margin expansion.
Which one has the stronger fundamentals?
Both companies demonstrate favorable income statement trends with solid revenue and net income growth. The Trade Desk excels in rapid revenue and EBIT growth but faces a slight net margin contraction overall. Paycom shows consistent margin improvement and superior net income growth, with no unfavorable indicators. Thus, Paycom presents a more uniformly favorable income profile based on recent performance and margin stability.
Financial Ratios Comparison
Below is a comparison of key financial ratios for The Trade Desk, Inc. (TTD) and Paycom Software, Inc. (PAYC) based on their most recent fiscal year (2024) data.
| Ratios | The Trade Desk, Inc. (TTD) | Paycom Software, Inc. (PAYC) |
|---|---|---|
| ROE | 13.3% | 31.9% |
| ROIC | 10.0% | 24.9% |
| P/E | 147 | 23 |
| P/B | 19.6 | 7.3 |
| Current Ratio | 1.86 | 1.10 |
| Quick Ratio | 1.86 | 1.10 |
| D/E | 0.11 | 0.05 |
| Debt-to-Assets | 5.1% | 1.4% |
| Interest Coverage | 0 | 187 |
| Asset Turnover | 0.40 | 0.32 |
| Fixed Asset Turnover | 5.17 | 2.93 |
| Payout ratio | 0% | 16.9% |
| Dividend yield | 0% | 0.74% |
Interpretation of the Ratios
The Trade Desk, Inc.
The Trade Desk shows a mixed ratio profile with strengths in net margin (16.08%) and return on invested capital (10.02%), indicating solid profitability and capital efficiency. However, valuation ratios like P/E at 146.77 and P/B at 19.56 raise concerns about high market expectations. The company does not pay dividends, likely focusing on reinvestment and growth strategies.
Paycom Software, Inc.
Paycom demonstrates strong profitability with a net margin of 26.66%, ROE of 31.85%, and ROIC of 24.86%, reflecting efficient use of equity and capital. Its valuation appears more reasonable with a P/E of 22.95, though P/B at 7.31 is less favorable. Paycom pays dividends with a 0.74% yield, indicating some return to shareholders alongside growth investments.
Which one has the best ratios?
Both companies have favorable overall ratio assessments, each with 57.14% favorable metrics. Paycom’s higher profitability and dividend payments contrast with The Trade Desk’s elevated valuation multiples and lack of dividends. The Trade Desk’s stronger liquidity and leverage ratios balance Paycom’s operational efficiency, making the comparison dependent on specific investor priorities.
Strategic Positioning
This section compares the strategic positioning of The Trade Desk, Inc. and Paycom Software, Inc. in terms of market position, key segments, and exposure to technological disruption:
The Trade Desk, Inc.
- Operates in a competitive digital advertising technology sector with significant market pressure.
- Focus on data-driven digital advertising campaigns across multiple formats and devices globally.
- Faces ongoing disruption risks from evolving digital ad technologies and platforms.
Paycom Software, Inc.
- Competes in cloud-based human capital management software for small to mid-sized U.S. companies.
- Provides a comprehensive HCM SaaS suite, emphasizing recurring revenue from payroll and talent management.
- Exposed to technological changes in cloud computing and workforce management tools, including proprietary features.
The Trade Desk, Inc. vs Paycom Software, Inc. Positioning
The Trade Desk pursues a diversified global advertising platform strategy, while Paycom concentrates on U.S.-focused HCM SaaS with strong recurring revenues. The Trade Desk faces intense competitive pressure, whereas Paycom benefits from a more stable, recurring revenue model.
Which has the best competitive advantage?
Paycom holds a very favorable moat with growing ROIC and clear value creation, indicating a durable competitive advantage. The Trade Desk’s slightly unfavorable moat and declining ROIC suggest weaker profitability and less sustainable advantage.
Stock Comparison
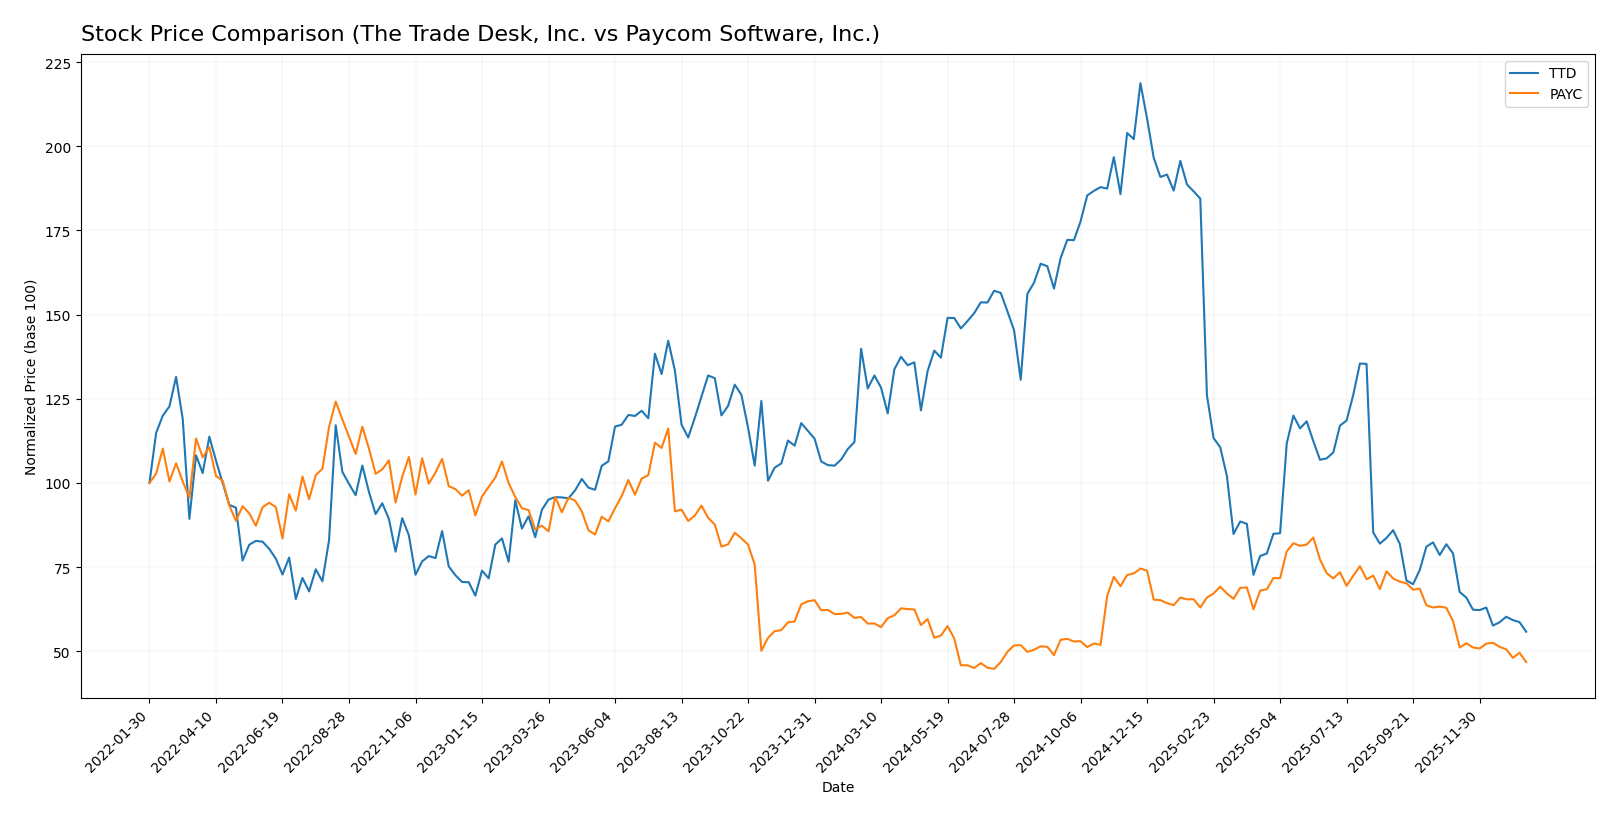
The stock prices of The Trade Desk, Inc. (TTD) and Paycom Software, Inc. (PAYC) have experienced significant declines over the past year, reflecting bearish trends with notable volatility and decelerating momentum.
Trend Analysis
The Trade Desk, Inc. (TTD) showed a bearish trend over the past 12 months with a price decline of -56.43%, decelerating momentum, and a high volatility level indicated by a standard deviation of 28.36. The stock peaked at 139.11 and bottomed at 35.48.
Paycom Software, Inc. (PAYC) also followed a bearish trajectory with a -19.64% price change over the same period, deceleration in trend, and slightly higher volatility with a standard deviation of 31.92. Its price ranged from a high of 265.71 to a low of 141.96.
Comparing the two, TTD delivered the largest market decline, with a more pronounced bearish trend than PAYC, which showed a less severe but still negative market performance over the past year.
Target Prices
Here is the current target price consensus for The Trade Desk, Inc. and Paycom Software, Inc.
| Company | Target High | Target Low | Consensus |
|---|---|---|---|
| The Trade Desk, Inc. | 98 | 39 | 56.73 |
| Paycom Software, Inc. | 290 | 165 | 215 |
Analysts expect significant upside potential for both stocks, with consensus targets well above current prices of $35.48 for The Trade Desk and $148.41 for Paycom. This suggests a generally bullish outlook from the analyst community.
Analyst Opinions Comparison
This section compares the analysts’ ratings and financial scores for The Trade Desk, Inc. (TTD) and Paycom Software, Inc. (PAYC):
Rating Comparison
TTD Rating
- Rating: B, considered Very Favorable.
- Discounted Cash Flow Score: 4, Favorable assessment of future cash flows.
- ROE Score: 4, Favorable efficiency in generating profit from equity.
- ROA Score: 4, Favorable asset utilization to generate earnings.
- Debt To Equity Score: 3, Moderate financial risk from leverage.
- Overall Score: 3, Moderate overall financial standing.
PAYC Rating
- Rating: A, considered Very Favorable.
- Discounted Cash Flow Score: 5, Very Favorable outlook on cash flow.
- ROE Score: 5, Very Favorable profit generation from equity.
- ROA Score: 5, Very Favorable use of assets for earnings.
- Debt To Equity Score: 4, Favorable lower financial risk.
- Overall Score: 4, Favorable overall financial standing.
Which one is the best rated?
Based strictly on the provided data, PAYC holds higher ratings and scores across all financial metrics compared to TTD. PAYC’s overall and individual scores indicate a stronger financial position and more favorable analyst opinion.
Scores Comparison
The comparison of The Trade Desk (TTD) and Paycom Software (PAYC) scores is as follows:
TTD Scores
- Altman Z-Score: 4.30, indicating a safe zone status, low bankruptcy risk.
- Piotroski Score: 5, reflecting average financial strength and investment potential.
PAYC Scores
- Altman Z-Score: 3.84, indicating a safe zone status, low bankruptcy risk.
- Piotroski Score: 5, reflecting average financial strength and investment potential.
Which company has the best scores?
Both TTD and PAYC are in the safe zone for Altman Z-Score, with TTD slightly higher. Both have identical Piotroski Scores of 5, indicating average financial strength. Thus, TTD has a marginally better bankruptcy risk score.
Grades Comparison
The following presents a detailed comparison of recent grades assigned to The Trade Desk, Inc. and Paycom Software, Inc.:
The Trade Desk, Inc. Grades
Below is a table summarizing recent analyst grades for The Trade Desk, Inc.:
| Grading Company | Action | New Grade | Date |
|---|---|---|---|
| Morgan Stanley | Maintain | Equal Weight | 2026-01-13 |
| Wells Fargo | Maintain | Equal Weight | 2026-01-12 |
| Cantor Fitzgerald | Maintain | Neutral | 2026-01-08 |
| Wolfe Research | Maintain | Outperform | 2026-01-06 |
| Guggenheim | Maintain | Buy | 2026-01-05 |
| Jefferies | Maintain | Hold | 2025-12-11 |
| Wedbush | Maintain | Neutral | 2025-12-08 |
| DA Davidson | Maintain | Buy | 2025-11-10 |
| Truist Securities | Maintain | Buy | 2025-11-07 |
| Wells Fargo | Maintain | Equal Weight | 2025-11-07 |
The overall trend for The Trade Desk shows a spectrum from Hold/Neutral to Buy and Outperform, with a consensus rating of “Buy,” indicating moderate analyst confidence.
Paycom Software, Inc. Grades
Below is a table summarizing recent analyst grades for Paycom Software, Inc.:
| Grading Company | Action | New Grade | Date |
|---|---|---|---|
| Barclays | Maintain | Equal Weight | 2026-01-12 |
| TD Cowen | Maintain | Buy | 2026-01-08 |
| Citigroup | Maintain | Neutral | 2025-12-23 |
| Keybanc | Maintain | Overweight | 2025-11-06 |
| TD Cowen | Maintain | Buy | 2025-11-06 |
| UBS | Maintain | Buy | 2025-11-06 |
| Jefferies | Maintain | Hold | 2025-11-06 |
| JP Morgan | Maintain | Neutral | 2025-11-06 |
| Mizuho | Maintain | Neutral | 2025-11-06 |
| Barclays | Maintain | Equal Weight | 2025-11-06 |
Paycom’s grades range from Hold/Neutral to Buy and Overweight, with a consensus rating of “Hold,” reflecting a more cautious analyst view compared to The Trade Desk.
Which company has the best grades?
The Trade Desk holds a stronger consensus rating of “Buy” versus Paycom’s “Hold,” supported by more Buy and Outperform grades. This suggests a generally more favorable analyst outlook on The Trade Desk, potentially influencing investor sentiment toward higher expected performance or growth.
Strengths and Weaknesses
Below is a comparison of key strengths and weaknesses for The Trade Desk, Inc. (TTD) and Paycom Software, Inc. (PAYC) based on the most recent financial and strategic data.
| Criterion | The Trade Desk, Inc. (TTD) | Paycom Software, Inc. (PAYC) |
|---|---|---|
| Diversification | Moderate; primarily focused on digital advertising | High; strong focus on recurring SaaS products with steady implementation revenue |
| Profitability | Moderate net margin (16.1%), favorable ROIC (10.0%), but declining value creation | High net margin (26.7%), very favorable ROIC (24.9%) with strong profitability growth |
| Innovation | Strong in advertising technology but facing increasing competition | Leading innovation in HR software with durable competitive advantage |
| Global presence | Solid but mostly North America and expanding internationally | Primarily North America with gradual expansion efforts |
| Market Share | Growing but challenged by competitors; market share gains uncertain | Growing market share in payroll and HR software sectors |
Key takeaways: Paycom Software demonstrates a clear competitive edge with strong profitability, durable innovation, and a robust recurring revenue model. The Trade Desk shows potential but faces challenges in sustaining value creation and market share amid rising competition. Investors should weigh Paycom’s stable growth against The Trade Desk’s higher risk profile.
Risk Analysis
Below is a comparative table of key risks for The Trade Desk, Inc. (TTD) and Paycom Software, Inc. (PAYC) based on their latest financials and market conditions in 2026:
| Metric | The Trade Desk, Inc. (TTD) | Paycom Software, Inc. (PAYC) |
|---|---|---|
| Market Risk | Moderate (Beta 1.105) | Lower (Beta 0.824) |
| Debt level | Low (Debt/Equity 0.11) | Very low (Debt/Equity 0.05) |
| Regulatory Risk | Moderate – Data privacy laws impact | Moderate – Compliance with labor laws |
| Operational Risk | Moderate – Platform reliance on ad tech trends | Moderate – SaaS platform complexity |
| Environmental Risk | Low – Limited environmental footprint | Low – Primarily software-based |
| Geopolitical Risk | Moderate – Global ad market exposure | Moderate – US-centric but sensitive to trade policies |
The most impactful and likely risks are market volatility affecting TTD due to its higher beta and regulatory pressures on data privacy impacting both companies. PAYC’s very low debt level and strong profitability reduce financial risk, while TTD faces valuation concerns despite solid fundamentals.
Which Stock to Choose?
The Trade Desk, Inc. (TTD) shows strong income growth with a 25.63% revenue increase in 2024 and favorable profitability margins. Its financial ratios are mostly favorable, featuring low debt and strong liquidity, though valuation metrics like P/E and P/B appear high. The company’s rating is very favorable with a “B” grade, yet its economic moat is slightly unfavorable due to declining ROIC below WACC.
Paycom Software, Inc. (PAYC) demonstrates solid income growth and superior profitability, including a 26.66% net margin and 31.85% ROE. Its financial ratios are largely favorable with low debt levels and healthy liquidity, supported by a very favorable “A” rating. The company maintains a very favorable economic moat with a growing ROIC well above WACC, indicating durable competitive advantage.
Considering ratings and comprehensive financial evaluations, PAYC might appear more attractive for investors prioritizing strong profitability and sustainable value creation. Conversely, TTD could be more suitable for those focused on growth potential despite some valuation and profitability concerns. Each stock’s suitability depends on the investor’s risk tolerance and strategic focus.
Disclaimer: Investment carries a risk of loss of initial capital. The past performance is not a reliable indicator of future results. Be sure to understand risks before making an investment decision.
Go Further
I encourage you to read the complete analyses of The Trade Desk, Inc. and Paycom Software, Inc. to enhance your investment decisions: