Investors seeking growth in the technology sector often face tough choices, especially between innovative software companies like ServiceTitan, Inc. (TTAN) and Paycom Software, Inc. (PAYC). Both operate in the software-application industry but target different niches—field service management versus human capital management—while sharing a focus on cloud-based solutions and process automation. In this article, I will analyze their strengths and risks to help you decide which company deserves a place in your portfolio.
Table of contents
Companies Overview
I will begin the comparison between ServiceTitan and Paycom by providing an overview of these two companies and their main differences.
ServiceTitan Overview
ServiceTitan, Inc. focuses on software solutions that support field service operations for residential and commercial infrastructure and systems. Founded in 2008 and based in Glendale, CA, the company aims to streamline installation, maintenance, and service activities for its clients. It operates within the technology sector and trades on the NASDAQ with a market cap around 8.5B USD.
Paycom Overview
Paycom Software, Inc. delivers cloud-based human capital management (HCM) software-as-a-service tailored for small to mid-sized U.S. companies. Founded in 1998 and headquartered in Oklahoma City, OK, the company provides an extensive suite of applications covering recruitment, payroll, labor management, and compliance. It operates in the technology sector with a market cap near 8.3B USD, listed on the NYSE.
Key similarities and differences
Both companies operate in the software application industry within the U.S. technology sector and serve niche markets with SaaS solutions. ServiceTitan targets field service management, while Paycom specializes in comprehensive HCM platforms. ServiceTitan is younger with fewer employees (3K vs. 7.3K) and trades on NASDAQ, whereas Paycom is more established, listed on NYSE, and distributes dividends. Their business models focus on subscription-based software but address distinct operational needs.
Income Statement Comparison
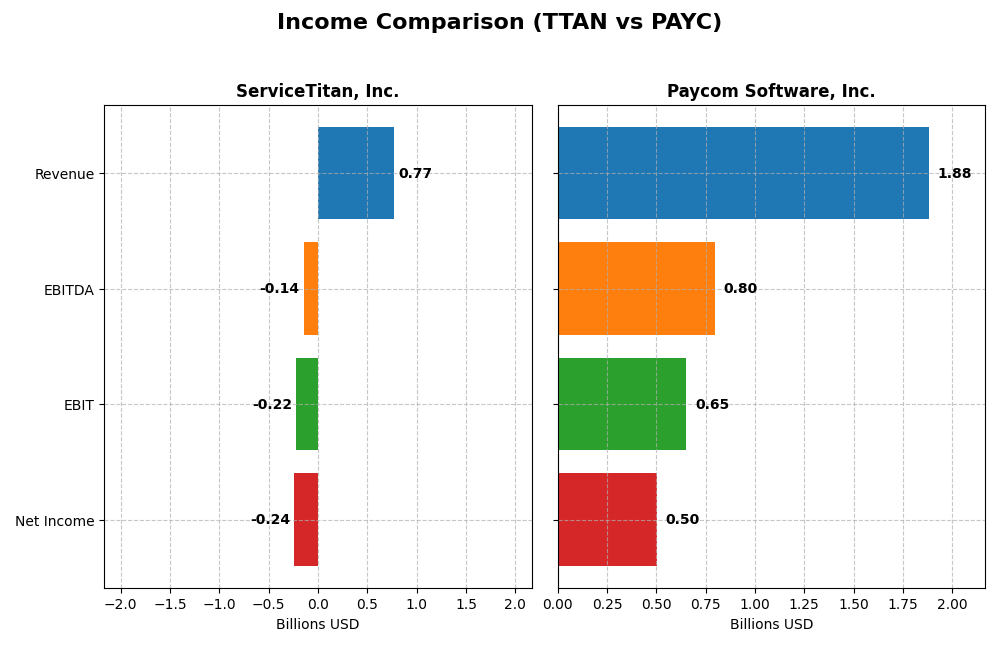
Below is a comparison of key income statement metrics for ServiceTitan, Inc. and Paycom Software, Inc. for their most recent fiscal years.
| Metric | ServiceTitan, Inc. (TTAN) | Paycom Software, Inc. (PAYC) |
|---|---|---|
| Market Cap | 8.5B | 8.3B |
| Revenue | 772M | 1.88B |
| EBITDA | -141M | 798M |
| EBIT | -221M | 652M |
| Net Income | -239M | 502M |
| EPS | -8.53 | 8.93 |
| Fiscal Year | 2025 | 2024 |
Income Statement Interpretations
ServiceTitan, Inc.
ServiceTitan’s revenue rose significantly by 65% from 2023 to 2025, with a favorable gross margin of 64.9%. However, net income remained negative, with a slight 11% improvement overall and a net margin near -31%. The latest fiscal year showed strong revenue growth of 25.6%, yet operating expenses grew at the same pace, resulting in a decline in EBIT and EPS margins.
Paycom Software, Inc.
Paycom exhibited robust growth, with revenue increasing 124% over five years and a healthy gross margin of 82.23%. Net income surged 250%, supported by a net margin of 26.66%. In 2024, revenue grew 11.2%, EBIT jumped 37.6%, and net margins improved by 32.5%, reflecting efficient expense management and solid profitability gains.
Which one has the stronger fundamentals?
Paycom demonstrates stronger fundamentals with consistent favorable margins, significant revenue, and net income growth, plus positive EPS trends. ServiceTitan shows promising top-line growth but struggles with negative net income and operating profitability. Paycom’s comprehensive favorable metrics indicate more stable and profitable financial health compared to ServiceTitan’s mixed income statement results.
Financial Ratios Comparison
This table presents a side-by-side comparison of key financial ratios for ServiceTitan, Inc. (TTAN) and Paycom Software, Inc. (PAYC) based on their most recent fiscal year data.
| Ratios | ServiceTitan, Inc. (TTAN) 2025 | Paycom Software, Inc. (PAYC) 2024 |
|---|---|---|
| ROE | -16.4% | 31.9% |
| ROIC | -14.1% | 24.9% |
| P/E | -18.1 | 22.9 |
| P/B | 3.0 | 7.3 |
| Current Ratio | 3.74 | 1.10 |
| Quick Ratio | 3.74 | 1.10 |
| D/E (Debt-to-Equity) | 0.11 | 0.05 |
| Debt-to-Assets | 9.4% | 1.4% |
| Interest Coverage | -14.8 | 186.6 |
| Asset Turnover | 0.44 | 0.32 |
| Fixed Asset Turnover | 9.57 | 2.93 |
| Payout Ratio | 0% | 16.9% |
| Dividend Yield | 0% | 0.74% |
Interpretation of the Ratios
ServiceTitan, Inc.
ServiceTitan shows a mixed ratio profile with significant weaknesses in profitability, reflected by negative net margin (-30.98%) and return on equity (-16.44%). Liquidity ratios are strong but the current ratio is unusually high at 3.74, which may indicate inefficient asset use. The company does not pay dividends, likely due to ongoing losses and reinvestment in growth, with no share buyback programs noted.
Paycom Software, Inc.
Paycom displays robust profitability metrics with a net margin of 26.66% and return on equity at 31.85%, signaling efficient capital use. Liquidity and solvency ratios are generally favorable, despite a high price-to-book ratio of 7.31. Paycom pays dividends with a modest 0.74% yield, supported by free cash flow, and maintains a balanced payout without excessive distributions or repurchases.
Which one has the best ratios?
Paycom Software’s ratios are overall more favorable, showing strong profitability, adequate liquidity, and manageable leverage. ServiceTitan’s negative profitability and some liquidity concerns weigh on its assessment. While Paycom’s valuation multiples appear stretched, its financial health and dividend policy reflect a more stable position than ServiceTitan’s slight unfavorable ratio profile.
Strategic Positioning
This section compares the strategic positioning of ServiceTitan and Paycom, including their market position, key segments, and exposure to technological disruption:
ServiceTitan, Inc.
- Mid-sized market cap with niche focus on field service software; faces moderate competitive pressure.
- Key segments include platform and subscription revenues targeting residential and commercial service industries.
- Exposure to technological disruption is moderate, relying on application software for field services without explicit innovation drivers noted.
Paycom Software, Inc.
- Similar market cap with strong presence in cloud-based human capital management; competes intensively in SaaS HR solutions.
- Focused on recurring revenues from SaaS HCM solutions for small to mid-sized U.S. companies, including payroll and talent management.
- Faces ongoing disruption risk but leverages proprietary tech like Microfence Bluetooth and advanced analytics within cloud HCM solutions.
ServiceTitan, Inc. vs Paycom Software, Inc. Positioning
ServiceTitan pursues a more concentrated strategy focused on field service software for infrastructure maintenance, while Paycom offers diversified cloud-based HCM solutions across recruitment, payroll, and compliance. ServiceTitan’s narrower focus may limit scale advantages compared to Paycom’s broader business drivers.
Which has the best competitive advantage?
Paycom holds a very favorable moat status with growing ROIC and durable competitive advantage, whereas ServiceTitan is shedding value with an unfavorable moat, indicating Paycom’s stronger competitive positioning based on capital efficiency.
Stock Comparison
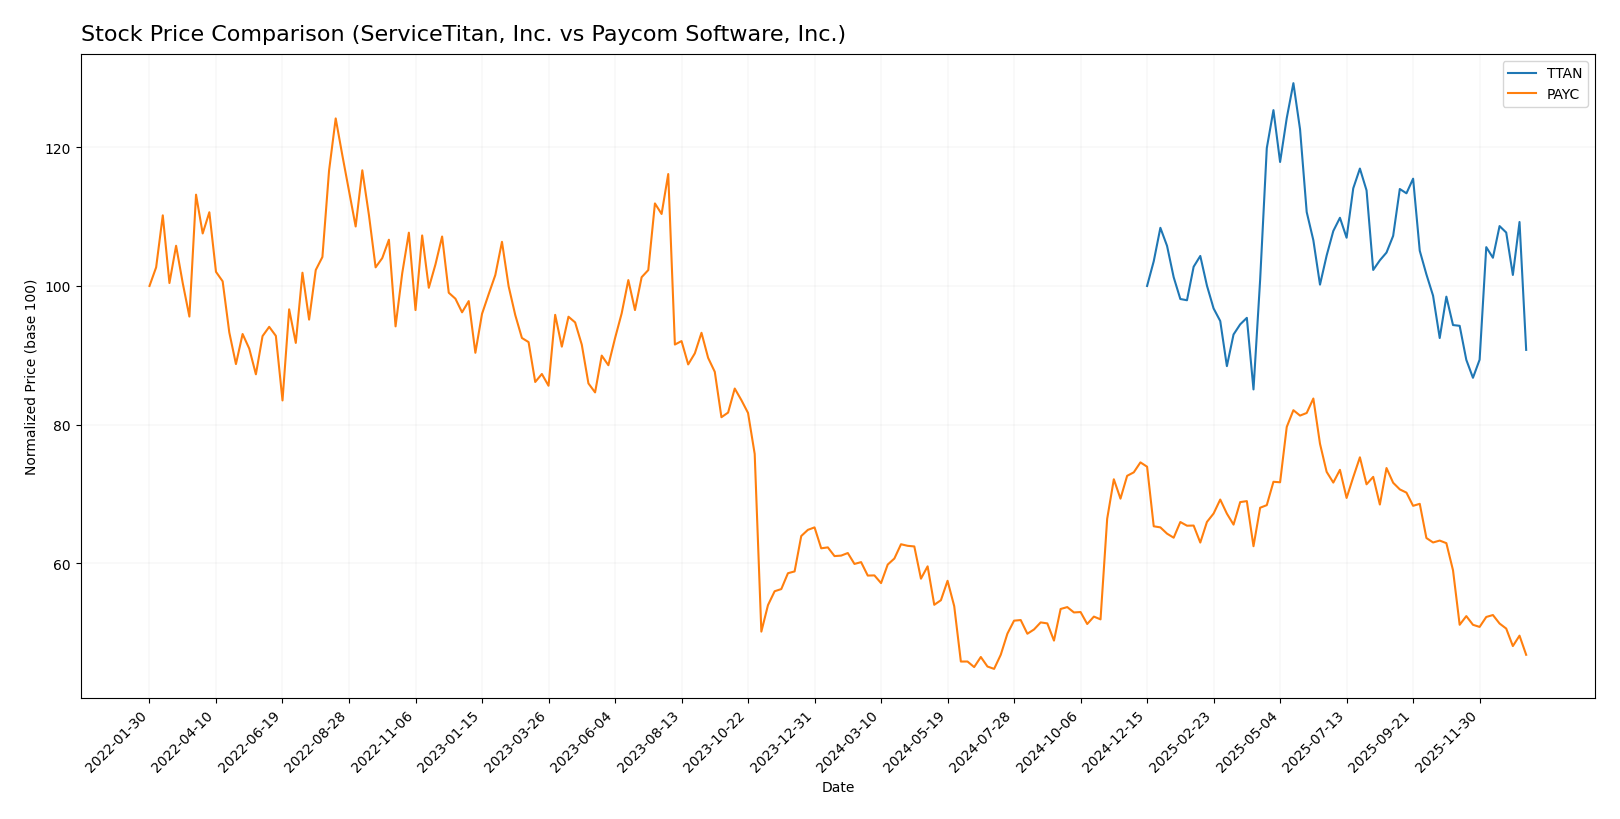
The stock prices of ServiceTitan, Inc. (TTAN) and Paycom Software, Inc. (PAYC) have experienced notable bearish trends over the past 12 months, reflecting distinct trading dynamics and volume shifts within this period.
Trend Analysis
ServiceTitan, Inc. (TTAN) stock has declined by 9.22% over the past year, indicating a bearish trend with accelerating downward momentum. The price ranged from a high of 129.26 to a low of 85.07, with moderate volatility (std deviation 9.86).
Paycom Software, Inc. (PAYC) experienced a steeper bearish trend, falling 19.64% over the same period. The trend shows deceleration, with a higher volatility level (std deviation 31.92) and a price range between 265.71 and 141.96.
Comparing both, ServiceTitan’s stock outperformed Paycom’s by delivering a smaller percentage loss, suggesting a relatively less severe market decline in the observed timeframe.
Target Prices
The current analyst consensus provides a positive outlook for both ServiceTitan, Inc. and Paycom Software, Inc.
| Company | Target High | Target Low | Consensus |
|---|---|---|---|
| ServiceTitan, Inc. | 145 | 117 | 132.44 |
| Paycom Software, Inc. | 290 | 165 | 215 |
Analysts expect both stocks to appreciate significantly, with consensus targets well above current prices of $90.78 for ServiceTitan and $148.41 for Paycom. This indicates potential upside opportunities for investors.
Analyst Opinions Comparison
This section compares analysts’ ratings and financial grades for ServiceTitan, Inc. and Paycom Software, Inc.:
Rating Comparison
ServiceTitan Rating
- Rating: C-, indicating a very unfavorable overall financial standing.
- Discounted Cash Flow Score: 1, assessed as very unfavorable, suggesting overvaluation risk.
- ROE Score: 1, very unfavorable, showing weak profit generation from equity.
- ROA Score: 1, very unfavorable, signaling poor asset utilization.
- Debt To Equity Score: 3, moderate level, reflecting balanced financial risk.
- Overall Score: 1, very unfavorable, signaling weak overall financial health.
Paycom Software Rating
- Rating: A, reflecting a very favorable overall financial standing.
- Discounted Cash Flow Score: 5, very favorable, indicating undervaluation potential.
- ROE Score: 5, very favorable, indicating efficient profit generation from equity.
- ROA Score: 5, very favorable, demonstrating effective asset use.
- Debt To Equity Score: 4, favorable, indicating lower financial risk.
- Overall Score: 4, favorable, indicating strong overall financial health.
Which one is the best rated?
Based strictly on the provided data, Paycom Software is clearly better rated with higher scores across all key financial metrics except Price-to-Book. ServiceTitan’s ratings are predominantly very unfavorable, while Paycom demonstrates strong financial health and valuation metrics.
Scores Comparison
Here is a comparison of the Altman Z-Score and Piotroski Score for ServiceTitan and Paycom Software:
ServiceTitan Scores
- Altman Z-Score: 15.74, indicating a safe zone.
- Piotroski Score: 6, reflecting average financial health.
Paycom Software Scores
- Altman Z-Score: 3.84, indicating a safe zone.
- Piotroski Score: 5, reflecting average financial health.
Which company has the best scores?
ServiceTitan shows a higher Altman Z-Score than Paycom, suggesting stronger bankruptcy protection. Its Piotroski Score is slightly higher, indicating marginally better financial strength based on the provided data.
Grades Comparison
Here is a detailed comparison of the recent grades assigned to ServiceTitan, Inc. and Paycom Software, Inc.:
ServiceTitan, Inc. Grades
The table below summarizes the latest grades assigned by recognized financial firms to ServiceTitan, Inc.:
| Grading Company | Action | New Grade | Date |
|---|---|---|---|
| Piper Sandler | Maintain | Overweight | 2025-12-05 |
| BMO Capital | Maintain | Outperform | 2025-12-05 |
| TD Cowen | Maintain | Buy | 2025-12-05 |
| Morgan Stanley | Maintain | Equal Weight | 2025-12-05 |
| BMO Capital | Maintain | Outperform | 2025-11-20 |
| Wells Fargo | Maintain | Overweight | 2025-09-19 |
| Stifel | Maintain | Buy | 2025-09-19 |
| Piper Sandler | Maintain | Overweight | 2025-09-19 |
| Canaccord Genuity | Maintain | Buy | 2025-09-19 |
| Citigroup | Maintain | Neutral | 2025-09-09 |
ServiceTitan shows a strong trend towards buy and outperform ratings, with most recent grades maintaining a positive outlook.
Paycom Software, Inc. Grades
The table below presents the latest grades assigned by established grading firms to Paycom Software, Inc.:
| Grading Company | Action | New Grade | Date |
|---|---|---|---|
| Barclays | Maintain | Equal Weight | 2026-01-12 |
| TD Cowen | Maintain | Buy | 2026-01-08 |
| Citigroup | Maintain | Neutral | 2025-12-23 |
| Keybanc | Maintain | Overweight | 2025-11-06 |
| TD Cowen | Maintain | Buy | 2025-11-06 |
| UBS | Maintain | Buy | 2025-11-06 |
| Jefferies | Maintain | Hold | 2025-11-06 |
| JP Morgan | Maintain | Neutral | 2025-11-06 |
| Mizuho | Maintain | Neutral | 2025-11-06 |
| Barclays | Maintain | Equal Weight | 2025-11-06 |
Paycom’s grades show a mixed consensus with a blend of buy, hold, and neutral ratings, indicating a more cautious market stance.
Which company has the best grades?
ServiceTitan, Inc. holds a stronger overall grade consensus, marked by consistent buy and outperform ratings, while Paycom Software, Inc. exhibits a more balanced mix including many hold and neutral grades. This difference suggests ServiceTitan may be viewed more favorably by analysts, potentially impacting investor confidence and portfolio positioning.
Strengths and Weaknesses
Below is a comparison of key strengths and weaknesses for ServiceTitan, Inc. (TTAN) and Paycom Software, Inc. (PAYC) based on their latest financial and strategic metrics.
| Criterion | ServiceTitan, Inc. (TTAN) | Paycom Software, Inc. (PAYC) |
|---|---|---|
| Diversification | Moderate, primarily SaaS platform and subscription revenue (approx. $740M and $566M respectively in 2025) | High, with strong recurring revenue growth ($1.73B recurring in 2024) and implementation services |
| Profitability | Unfavorable, negative net margin (-31%), negative ROIC (-14%), value destroying | Favorable, strong net margin (26.7%), high ROIC (25%), and value creating |
| Innovation | Moderate, with stable asset turnover but limited growth in ROIC | High, demonstrated by growing ROIC (+54% trend) and durable competitive advantage |
| Global presence | Limited information suggests a more regional focus | Stronger presence with scalable SaaS offerings and expanding client base |
| Market Share | Growing platform adoption but profitability challenges | Solid market position supported by recurring revenues and efficient capital use |
Key takeaways: Paycom Software exhibits robust profitability and a durable competitive moat with growing returns and recurring revenues, making it a more favorable investment. ServiceTitan shows potential in revenue diversification but struggles with profitability and value creation, warranting cautious consideration.
Risk Analysis
Below is a comparative table highlighting key risk factors for ServiceTitan, Inc. (TTAN) and Paycom Software, Inc. (PAYC) based on the latest financial and market data from 2025 and 2024 respectively:
| Metric | ServiceTitan, Inc. (TTAN) | Paycom Software, Inc. (PAYC) |
|---|---|---|
| Market Risk | Negative beta (-0.85) indicates potential inverse market movement risk | Positive beta (0.82), moderate market correlation risk |
| Debt level | Low debt-to-equity ratio (0.11), low financial leverage | Very low debt-to-equity ratio (0.05), very low leverage risk |
| Regulatory Risk | Moderate; operates in tech with data/privacy regulations | Moderate; faces compliance risks in payroll and HCM software |
| Operational Risk | Negative margins and returns suggest operational inefficiencies | Strong profitability and returns mitigate operational risks |
| Environmental Risk | Low; software industry with minimal direct environmental impact | Low; primarily cloud-based services with limited environmental footprint |
| Geopolitical Risk | US-based, limited international exposure | US-focused but some exposure through cloud infrastructure |
Synthesis: ServiceTitan faces higher operational and market risks due to negative profitability and an inverse beta, indicating volatility and potential losses. Paycom benefits from strong financial health and stable returns, though its high price-to-book ratio could imply valuation risk. Investors should weigh ServiceTitan’s growth potential against its current financial challenges, while Paycom appears a safer choice with manageable risks.
Which Stock to Choose?
ServiceTitan, Inc. (TTAN) shows favorable revenue growth of 25.6% in 2025 and a positive overall income statement outlook, but profitability metrics like net margin (-31%) and returns on equity and assets are unfavorable. Debt levels are low and financial ratios are slightly unfavorable overall, with a very favorable rating but weak operational scores. The company is currently shedding value as ROIC remains below WACC.
Paycom Software, Inc. (PAYC) presents consistent favorable income growth and profitability, with a strong net margin of 26.7% and high returns on equity (32%) and invested capital. Its financial ratios are predominantly favorable, though price-to-book is unfavorable. PAYC holds a very favorable rating, demonstrates value creation with ROIC well above WACC, and maintains strong financial health scores.
Investors prioritizing durable competitive advantage and value creation may find Paycom’s fundamentals and favorable rating indicative of quality investing potential, while those focused on growth might consider ServiceTitan’s revenue expansion despite its current profitability challenges and value destruction signals.
Disclaimer: Investment carries a risk of loss of initial capital. The past performance is not a reliable indicator of future results. Be sure to understand risks before making an investment decision.
Go Further
I encourage you to read the complete analyses of ServiceTitan, Inc. and Paycom Software, Inc. to enhance your investment decisions: