Home > Comparison > Technology > NOW vs PAYC
The strategic rivalry between ServiceNow, Inc. and Paycom Software, Inc. shapes the evolution of the technology software application sector. ServiceNow operates as a capital-intensive enterprise cloud computing leader, delivering broad workflow automation solutions. In contrast, Paycom focuses on high-margin, cloud-based human capital management software for small to mid-sized firms. This analysis evaluates which company’s operational model offers superior risk-adjusted returns for diversified portfolios amid the intensifying competition for sector dominance.
Table of contents
Companies Overview
ServiceNow and Paycom command significant roles in the enterprise software market, shaping workflows and workforce management.
ServiceNow, Inc.: Enterprise Cloud Workflow Leader
ServiceNow dominates the enterprise cloud computing sector with its Now platform, automating workflows across IT, HR, and customer service. It generates revenue primarily through subscription-based SaaS solutions that consolidate service management. In 2026, the company focuses on expanding automation capabilities and strategic partnerships, notably with Celonis, to enhance process optimization for global enterprises.
Paycom Software, Inc.: Human Capital Management Pioneer
Paycom specializes in cloud-based human capital management (HCM) software, serving small to mid-sized U.S. businesses. Its revenue stems from SaaS offerings that streamline recruitment, payroll, and talent management. The company prioritizes innovation in data analytics and mobile manager tools, aiming to provide comprehensive workforce lifecycle solutions and improve client engagement in 2026.
Strategic Collision: Similarities & Divergences
Both firms leverage SaaS models but diverge in focus—ServiceNow champions broad workflow automation, while Paycom zeroes in on HCM. Their competitive battleground lies in capturing enterprise efficiency improvements, yet ServiceNow targets large, complex organizations, contrasting with Paycom’s emphasis on mid-market clients. This difference shapes distinct investment profiles: ServiceNow offers scale and diversification, Paycom delivers niche specialization and growth potential.
Income Statement Comparison
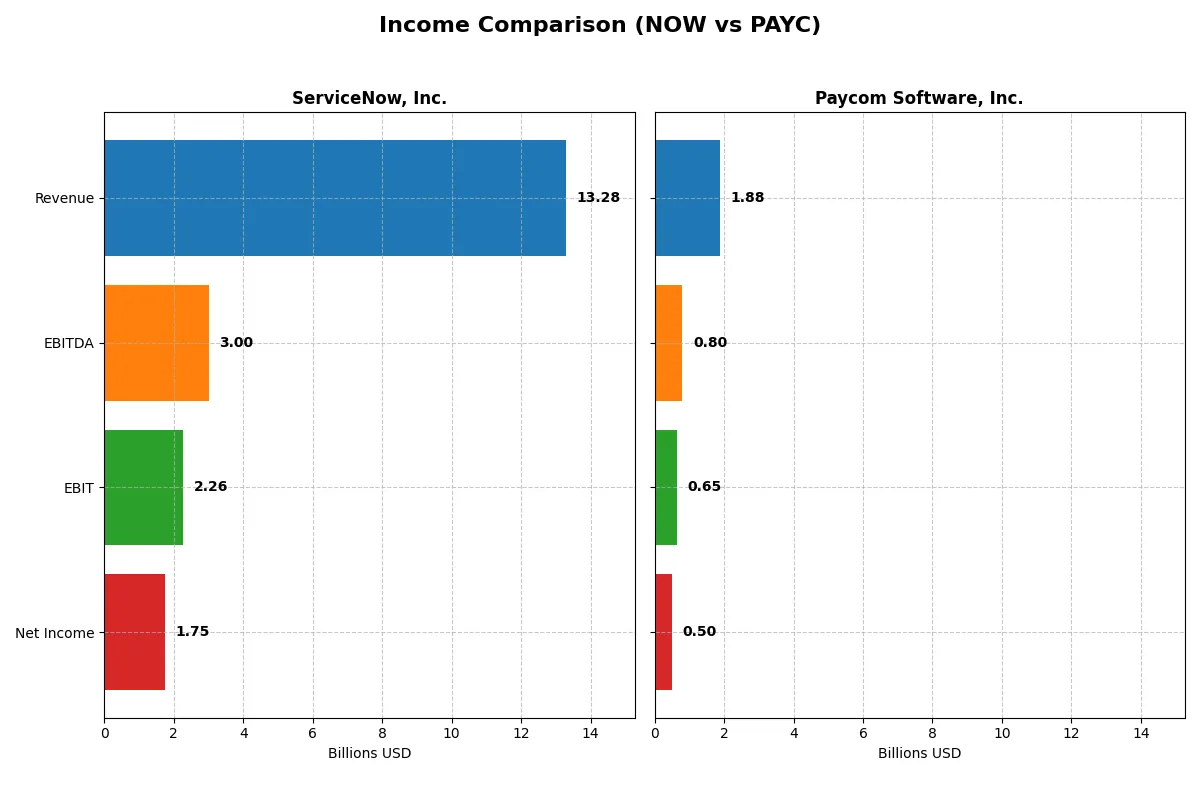
This data dissects the core profitability and scalability of both corporate engines to reveal who dominates the bottom line:
| Metric | ServiceNow, Inc. (NOW) | Paycom Software, Inc. (PAYC) |
|---|---|---|
| Revenue | 13.3B | 1.88B |
| Cost of Revenue | 2.98B | 335M |
| Operating Expenses | 8.47B | 914M |
| Gross Profit | 10.3B | 1.55B |
| EBITDA | 3.00B | 798M |
| EBIT | 2.26B | 652M |
| Interest Expense | 0 | 3.4M |
| Net Income | 1.75B | 502M |
| EPS | 1.69 | 8.93 |
| Fiscal Year | 2025 | 2024 |
Income Statement Analysis: The Bottom-Line Duel
This income statement comparison reveals how efficiently ServiceNow and Paycom convert sales into profits and growth momentum.
ServiceNow, Inc. Analysis
ServiceNow’s revenue rose 21% in 2025 to $13.3B, with net income climbing 23% to $1.75B. Its gross margin holds strong at 77.5%, while net margin remains steady at 13.2%. The company sustains favorable operating leverage, boosting EBIT by 28%, signaling robust efficiency and expanding scale.
Paycom Software, Inc. Analysis
Paycom grew revenue 11% in 2024 to $1.88B, with net income surging 47% to $502M. It boasts an impressive gross margin of 82.2% and a net margin of 26.7%, reflecting exceptional profitability. EBIT jumped 38%, supported by disciplined expense control and solid margin expansion.
Margin Strength vs. Growth Scale
ServiceNow leads in absolute revenue and net income scale, showing strong margin stability and rapid earnings growth. Paycom excels with superior margin percentages and faster margin expansion despite smaller scale. For investors, ServiceNow offers high momentum in growth; Paycom presents a leaner, more profitable profile.
Financial Ratios Comparison
These vital ratios act as a diagnostic tool to expose the underlying fiscal health, valuation premiums, and capital efficiency of the companies analyzed:
| Ratios | ServiceNow, Inc. (NOW) | Paycom Software, Inc. (PAYC) |
|---|---|---|
| ROE | 13.5% | 31.9% |
| ROIC | 9.0% | 24.9% |
| P/E | 90.9 | 22.9 |
| P/B | 12.3 | 7.3 |
| Current Ratio | 0.95 | 1.10 |
| Quick Ratio | 0.95 | 1.10 |
| D/E | 0.25 | 0.05 |
| Debt-to-Assets | 12.3% | 1.4% |
| Interest Coverage | 0 | 187 |
| Asset Turnover | 0.51 | 0.32 |
| Fixed Asset Turnover | 4.29 | 2.93 |
| Payout Ratio | 0 | 16.9% |
| Dividend Yield | 0 | 0.74% |
| Fiscal Year | 2025 | 2024 |
Efficiency & Valuation Duel: The Vital Signs
Financial ratios act as a company’s DNA, exposing hidden risks and revealing operational strength behind headline numbers.
ServiceNow, Inc.
ServiceNow posts a solid 13.5% ROE and 13.2% net margin, signaling decent profitability. However, its stretched valuation with a P/E near 91 and P/B above 12 raises concerns. The firm pays no dividend, reinvesting heavily in R&D at 22% of revenue, fueling long-term growth but limiting immediate shareholder returns.
Paycom Software, Inc.
Paycom delivers robust profitability with a 31.9% ROE and a 26.7% net margin, reflecting operational efficiency. Its P/E of 23 is reasonable, though a P/B of 7.3 is moderately high. The company offers a small dividend yield of 0.74%, balancing shareholder returns with growth investments in technology and operations.
Premium Valuation vs. Operational Safety
ServiceNow’s valuation multiples appear stretched compared to Paycom’s more reasonable pricing. Paycom’s superior profitability and balanced shareholder returns offer a stronger risk-reward profile. Investors favoring growth with operational efficiency might lean toward Paycom, while those betting on innovation reinvestment may consider ServiceNow’s longer horizon.
Which one offers the Superior Shareholder Reward?
I observe ServiceNow (NOW) pays no dividends, reinvesting heavily in growth, while Paycom (PAYC) offers a 0.74% dividend yield with a 17% payout ratio. NOW’s buybacks are modest; PAYC maintains steady buybacks supporting total return. PAYC’s lower P/E and strong FCF yield signal more sustainable shareholder rewards in 2026. I favor PAYC for a balanced mix of income, growth, and buybacks, delivering superior total shareholder return versus NOW’s aggressive growth-only approach.
Comparative Score Analysis: The Strategic Profile
The radar chart reveals the fundamental DNA and trade-offs of ServiceNow, Inc. and Paycom Software, Inc., illustrating their financial strengths and valuation profiles:
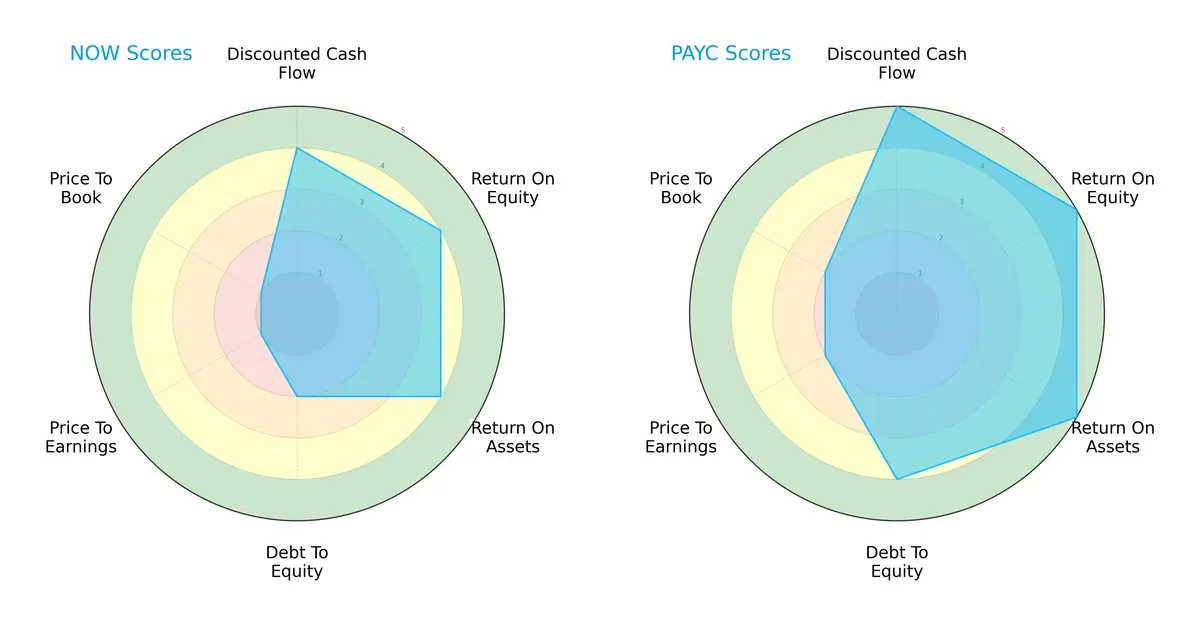
Paycom demonstrates superior scores in discounted cash flow, return on equity, return on assets, and debt-to-equity, indicating a balanced and robust financial position. ServiceNow shows moderate operational efficiency but struggles with valuation metrics, reflecting potential overpricing. Paycom relies on consistent earnings and asset use, while ServiceNow depends more on operational performance despite valuation headwinds.
Bankruptcy Risk: Solvency Showdown
The Altman Z-Score comparison highlights Paycom’s safer financial footing versus ServiceNow in this economic cycle:
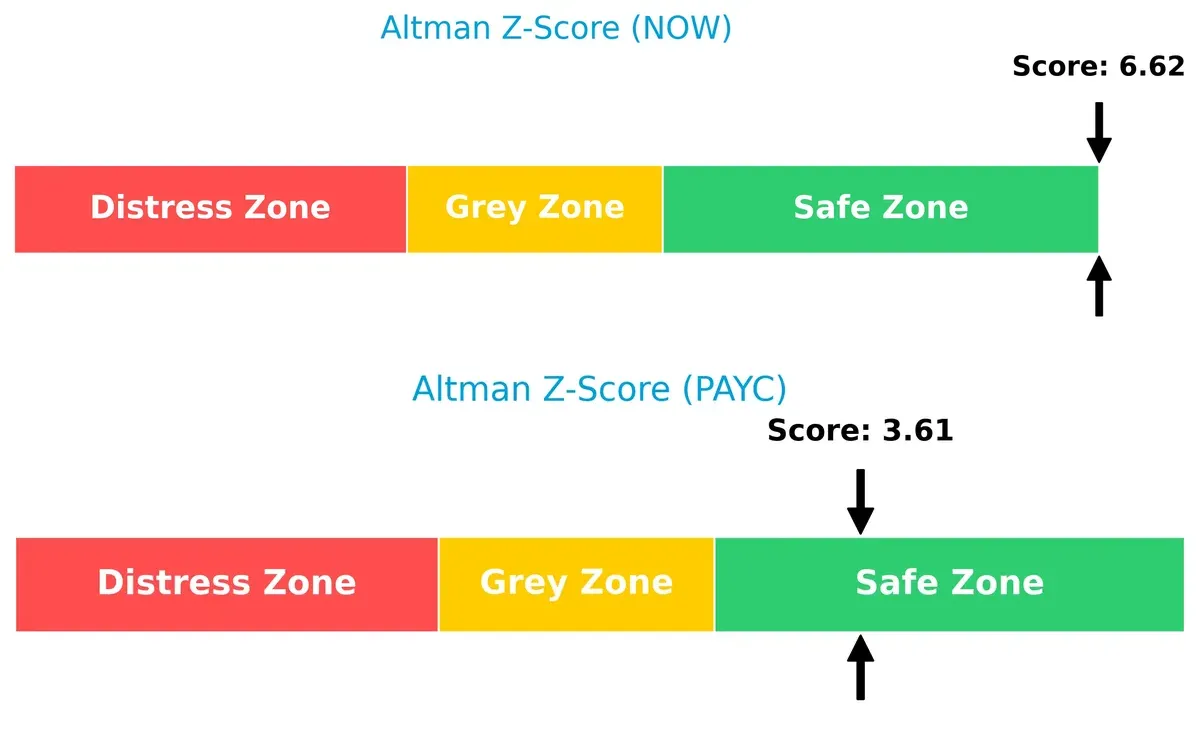
Both firms reside comfortably in the safe zone, but ServiceNow’s higher Z-score of 6.6 suggests stronger solvency and lower bankruptcy risk than Paycom’s 3.6, indicating superior resilience in volatile markets.
Financial Health: Quality of Operations
Piotroski F-Score analysis shows Paycom holds a slight edge in operational quality and financial health:

Paycom scores 5, marginally surpassing ServiceNow’s 4, both reflecting average financial health. Neither firm signals immediate red flags, but Paycom’s slightly higher score hints at more robust internal controls and efficiency.
How are the two companies positioned?
This section dissects the operational DNA of ServiceNow and Paycom by comparing their revenue distribution and internal dynamics. Our goal is to confront their economic moats to reveal which model delivers a more resilient competitive advantage.
Revenue Segmentation: The Strategic Mix
This visual comparison dissects how ServiceNow, Inc. and Paycom Software, Inc. diversify their income streams and reveals where their primary sector bets lie:
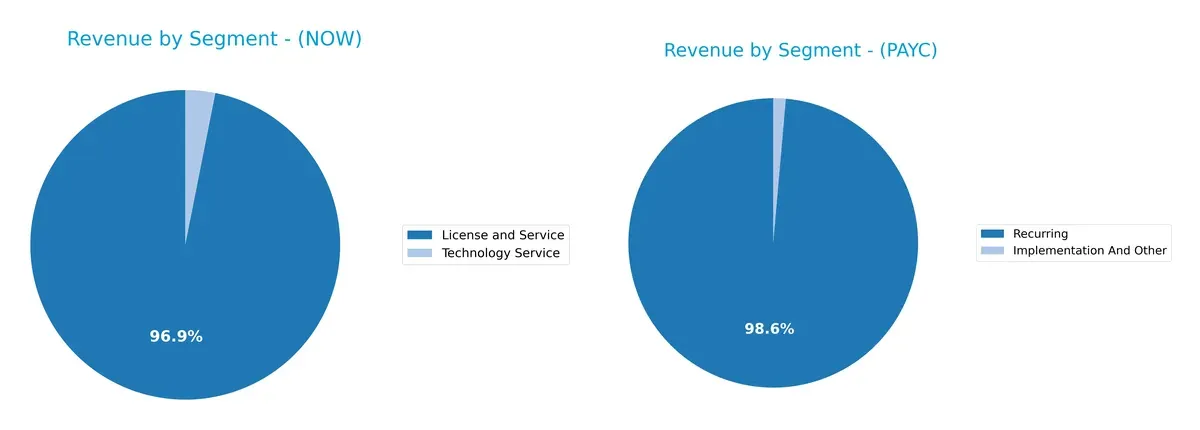
ServiceNow leans heavily on its License and Service segment, generating $12.9B in 2025, dwarfing its Technology Service revenue of $414M. This concentration anchors a strong ecosystem lock-in in digital workflow solutions. Paycom, with $1.73B in Recurring revenue and just $24M from Implementation and Other, relies almost exclusively on subscription-based income. Paycom’s narrow focus risks concentration, while ServiceNow’s mix suggests infrastructure dominance with moderate diversification.
Strengths and Weaknesses Comparison
This table compares the strengths and weaknesses of ServiceNow, Inc. and Paycom Software, Inc.:
ServiceNow Strengths
- Strong global presence with $8.35B North America and $3.4B EMEA revenue
- Favorable debt metrics with low debt to assets at 12.3%
- High fixed asset turnover at 4.29 indicating efficient asset use
Paycom Strengths
- Superior profitability with 26.66% net margin and 31.85% ROE
- Favorable capital structure with very low debt to assets at 1.42%
- Strong liquidity ratios with current and quick ratio at 1.1
ServiceNow Weaknesses
- Unfavorable valuation metrics, PE at 90.88 and PB at 12.25
- Current ratio below 1 at 0.95 signaling liquidity risk
- Zero dividend yield may deter income investors
Paycom Weaknesses
- Lower asset turnover at 0.32 compared to peers
- Unfavorable PB ratio at 7.31 despite strong earnings
- Dividend yield low at 0.74%, limiting income appeal
ServiceNow excels in global scale and asset efficiency but faces valuation and liquidity constraints. Paycom demonstrates robust profitability and balance sheet strength but lags in asset utilization. Both must balance growth with prudent financial management.
The Moat Duel: Analyzing Competitive Defensibility
A strong structural moat shields long-term profits from relentless competition erosion. Here’s how ServiceNow and Paycom stand:
ServiceNow, Inc.: Workflow Automation with Expanding Reach
ServiceNow’s moat lies in its platform’s integration and switching costs. Its modest ROIC above WACC shows early value creation. Expanding into AI-backed enterprise services could deepen its moat in 2026.
Paycom Software, Inc.: Efficient HCM with High Profitability
Paycom’s moat centers on cost advantage and user-friendly HCM integration. It boasts a robust ROIC well above WACC, signaling solid value creation. Continued innovation in analytics and mobile solutions supports moat expansion.
Platform Integration vs. Cost Leadership: The Moat Showdown
Paycom commands a wider and deeper moat thanks to superior ROIC and margin strength. ServiceNow’s growing platform reach is promising but less defensible. Paycom remains better positioned to defend market share amid evolving software demands.
Which stock offers better returns?
Over the past year, both ServiceNow and Paycom Software experienced significant price declines, reflecting bearish trends with decelerating momentum and notable volatility.
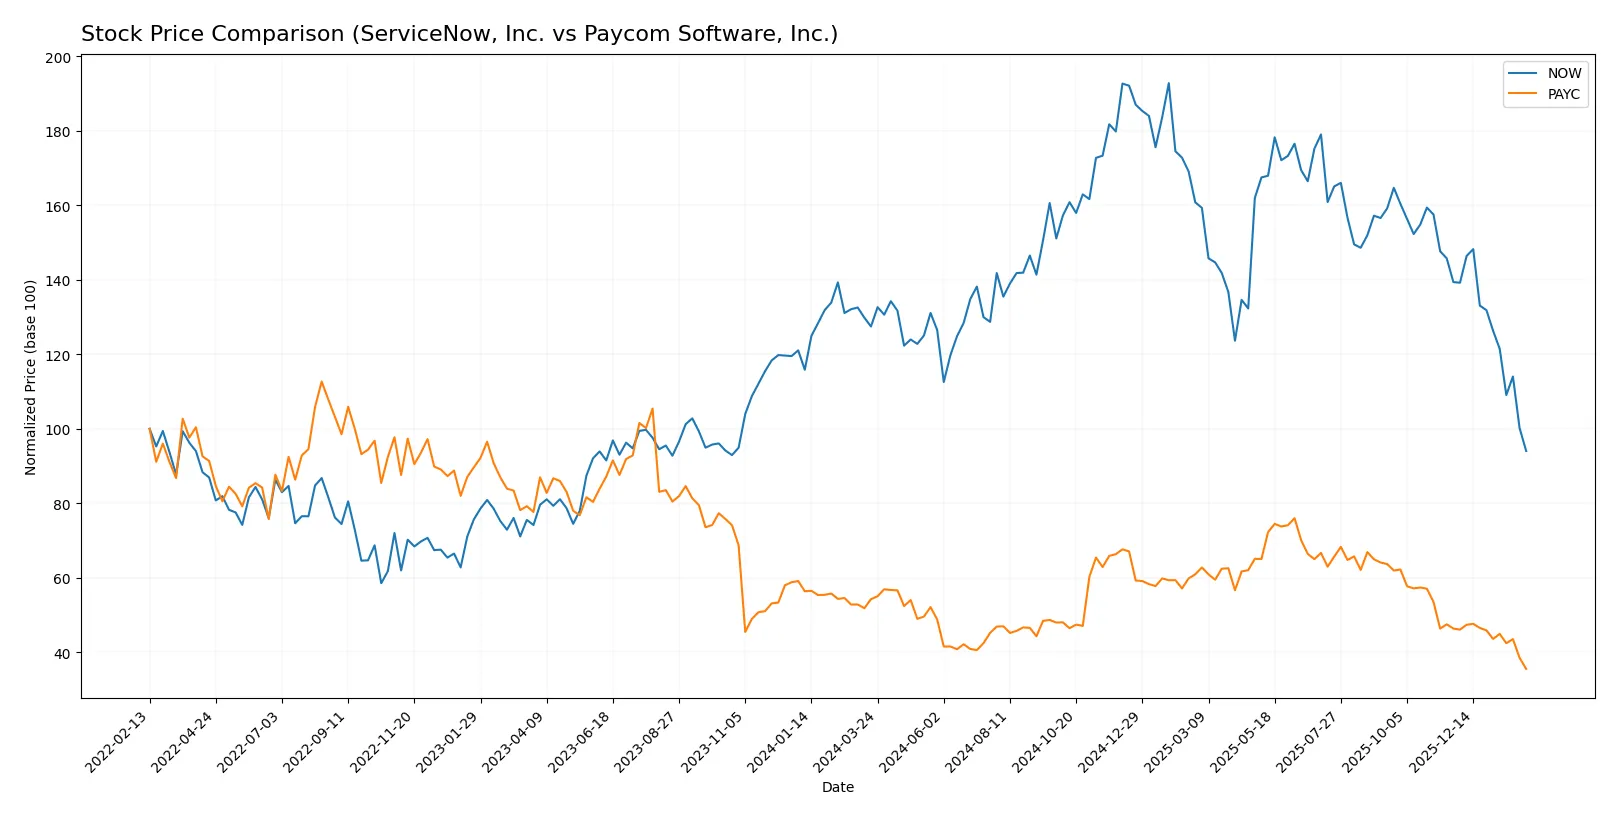
Trend Comparison
ServiceNow’s stock fell 26.22% over 12 months, showing a bearish trend with decelerating losses and a high volatility of 25.07%. The price ranged between 225.0 and 109.77.
Paycom’s stock declined 34.46% over the same period, also bearish with decelerating losses. It exhibited higher volatility at 33.46%, with prices fluctuating from 265.71 to 124.33.
Comparing both, ServiceNow delivered the lesser loss and outperformed Paycom, which showed a steeper decline and higher volatility over the past year.
Target Prices
Analysts show a wide range of target prices, reflecting varied expectations for these tech firms.
| Company | Target Low | Target High | Consensus |
|---|---|---|---|
| ServiceNow, Inc. | 115 | 1315 | 440.64 |
| Paycom Software, Inc. | 135 | 290 | 203.13 |
The consensus targets for ServiceNow and Paycom significantly exceed current prices, suggesting analysts anticipate strong growth despite recent market volatility.

Don’t Let Luck Decide Your Entry Point
Optimize your entry points with our advanced ProRealTime indicators. You’ll get efficient buy signals with precise price targets for maximum performance. Start outperforming now!
How do institutions grade them?
ServiceNow, Inc. Grades
The following table presents the most recent grades assigned by reputable financial institutions.
| Grading Company | Action | New Grade | Date |
|---|---|---|---|
| Citigroup | Maintain | Buy | 2026-01-30 |
| Evercore ISI Group | Maintain | Outperform | 2026-01-29 |
| Macquarie | Maintain | Neutral | 2026-01-29 |
| BTIG | Maintain | Buy | 2026-01-29 |
| RBC Capital | Maintain | Outperform | 2026-01-29 |
| Keybanc | Maintain | Underweight | 2026-01-29 |
| Stifel | Maintain | Buy | 2026-01-29 |
| DA Davidson | Maintain | Buy | 2026-01-29 |
| Cantor Fitzgerald | Maintain | Overweight | 2026-01-29 |
| Needham | Maintain | Buy | 2026-01-29 |
Paycom Software, Inc. Grades
Below are the latest ratings from established grading companies for Paycom Software, Inc.
| Grading Company | Action | New Grade | Date |
|---|---|---|---|
| Cantor Fitzgerald | Maintain | Neutral | 2026-01-29 |
| UBS | Maintain | Buy | 2026-01-26 |
| Barclays | Maintain | Equal Weight | 2026-01-12 |
| TD Cowen | Maintain | Buy | 2026-01-08 |
| Citigroup | Maintain | Neutral | 2025-12-23 |
| Keybanc | Maintain | Overweight | 2025-11-06 |
| TD Cowen | Maintain | Buy | 2025-11-06 |
| UBS | Maintain | Buy | 2025-11-06 |
| Jefferies | Maintain | Hold | 2025-11-06 |
| Mizuho | Maintain | Neutral | 2025-11-06 |
Which company has the best grades?
ServiceNow holds a stronger consensus with multiple Buy and Outperform grades from top-tier firms. Paycom receives more Neutral and Equal Weight ratings. This disparity may influence investor confidence and portfolio positioning.
Risks specific to each company
The following categories identify the critical pressure points and systemic threats facing both firms in the 2026 market environment:
1. Market & Competition
ServiceNow, Inc.
- Faces intense competition in enterprise cloud computing, risking margin pressure.
Paycom Software, Inc.
- Operates in a niche HCM market but faces competition from larger SaaS vendors.
2. Capital Structure & Debt
ServiceNow, Inc.
- Moderate debt with favorable interest coverage but a low current ratio signals liquidity risk.
Paycom Software, Inc.
- Very low debt and strong interest coverage indicate solid financial stability.
3. Stock Volatility
ServiceNow, Inc.
- Beta near 1 signals market-level volatility; high valuation multiples add risk.
Paycom Software, Inc.
- Lower beta suggests less volatility; valuation multiples more reasonable but still elevated.
4. Regulatory & Legal
ServiceNow, Inc.
- Exposure to global data privacy and compliance regulations across multiple sectors.
Paycom Software, Inc.
- Regulatory risk focused on US labor laws and data security in HR solutions.
5. Supply Chain & Operations
ServiceNow, Inc.
- Relies on cloud infrastructure partnerships; potential disruption from tech vendors.
Paycom Software, Inc.
- SaaS model minimizes supply chain risk but dependent on stable software development cycles.
6. ESG & Climate Transition
ServiceNow, Inc.
- Increasing pressure to demonstrate ESG leadership in cloud sustainability and governance.
Paycom Software, Inc.
- ESG efforts less visible; climate transition impact limited but reputational risk exists.
7. Geopolitical Exposure
ServiceNow, Inc.
- Global operations expose it to geopolitical tensions affecting tech supply chains.
Paycom Software, Inc.
- Primarily US-focused, limiting geopolitical risk but vulnerable to domestic policy shifts.
Which company shows a better risk-adjusted profile?
Paycom faces lower capital structure and liquidity risks with a more conservative debt profile and stronger profitability metrics. ServiceNow’s high valuation and liquidity concerns amplify market and operational risks. Both companies operate in competitive, regulated environments, but Paycom’s financial stability and lower volatility create a stronger risk-adjusted position in 2026. ServiceNow’s elevated P/E and P/B ratios, coupled with a current ratio below 1, highlight caution.
Final Verdict: Which stock to choose?
ServiceNow’s superpower lies in its accelerating profitability and robust income growth, signaling a company improving its operational efficiency. However, its stretched valuation and below-par liquidity ratios are points of vigilance. It suits investors chasing aggressive growth with a tolerance for valuation risk.
Paycom boasts a sustainable competitive moat, demonstrated by its strong ROIC exceeding WACC and disciplined capital allocation. Its financial health is more conservative, offering greater stability compared to ServiceNow. This stock aligns well with a GARP strategy focused on quality growth at a reasonable price.
If you prioritize rapid growth and market share expansion, ServiceNow is compelling due to its improving profitability and innovation-driven momentum. However, if you seek a blend of solid financial health and sustainable competitive advantage, Paycom offers better stability and value creation over the long term. Both present viable analytical scenarios depending on your portfolio’s risk appetite and investment horizon.
Disclaimer: Investment carries a risk of loss of initial capital. The past performance is not a reliable indicator of future results. Be sure to understand risks before making an investment decision.
Go Further
I encourage you to read the complete analyses of ServiceNow, Inc. and Paycom Software, Inc. to enhance your investment decisions: