In today’s fast-evolving technology landscape, selecting the right software company for your portfolio requires careful analysis. The Trade Desk, Inc. (TTD) and PagerDuty, Inc. (PD) both operate in the software application sector but target distinct niches—digital advertising versus digital operations management. Their innovation strategies and market approaches offer unique growth prospects. This article will help you decide which company aligns better with your investment goals.

Table of contents
Companies Overview
I will begin the comparison between The Trade Desk and PagerDuty by providing an overview of these two companies and their main differences.
The Trade Desk Overview
The Trade Desk, Inc. operates a self-service cloud-based platform that enables buyers to create, manage, and optimize data-driven digital advertising campaigns across multiple formats and channels. Founded in 2009 and headquartered in Ventura, California, The Trade Desk serves advertising agencies and other service providers, emphasizing programmatic advertising solutions on devices like computers, mobile, and connected TV.
PagerDuty Overview
PagerDuty, Inc. provides a digital operations management platform that collects and analyzes digital signals from software-enabled systems using machine learning to predict issues and opportunities. Founded in 2009 and based in San Francisco, California, PagerDuty serves diverse industries including software, telecommunications, retail, and financial services, focusing on operational efficiency and incident response across multiple sectors.
Key similarities and differences
Both companies operate in the software application industry with cloud-based platforms aimed at enterprise customers. The Trade Desk focuses primarily on digital advertising campaign management, while PagerDuty specializes in digital operations and incident management using machine learning. Each targets different market needs: marketing and advertising versus operational intelligence and incident response, reflecting distinct business models within the technology sector.
Income Statement Comparison
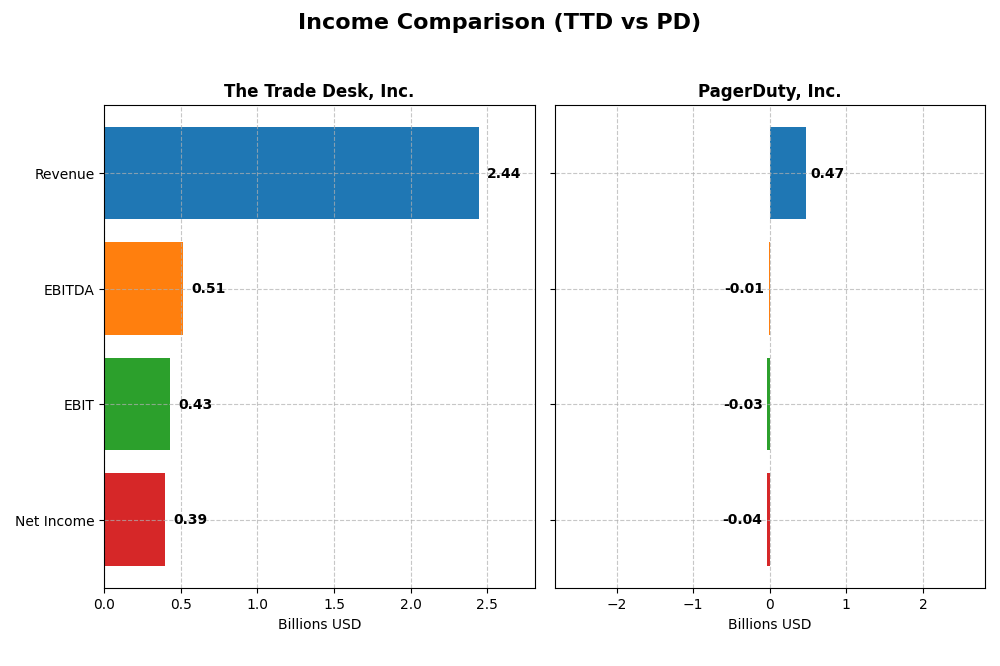
The table below compares key income statement metrics for The Trade Desk, Inc. and PagerDuty, Inc. for their most recent fiscal years, providing a snapshot of their financial performance.
| Metric | The Trade Desk, Inc. (2024) | PagerDuty, Inc. (2025) |
|---|---|---|
| Market Cap | 17.3B | 1.0B |
| Revenue | 2.44B | 467M |
| EBITDA | 515M | -12M |
| EBIT | 427M | -32M |
| Net Income | 393M | -54M |
| EPS | 0.80 | -0.59 |
| Fiscal Year | 2024 | 2025 |
Income Statement Interpretations
The Trade Desk, Inc.
The Trade Desk demonstrated strong overall revenue growth of 192% from 2020 to 2024, with net income increasing by 62%. Gross margin remained stable and favorable at 80.7%, while net margin was also positive at 16.1%. In 2024, revenue surged 25.6%, net income more than doubled, and margins improved, reflecting robust profitability and operational efficiency.
PagerDuty, Inc.
PagerDuty showed steady revenue growth of 119% over 2021-2025, with net income losses narrowing by 38%. Gross margin remained high and favorable at 83%, but negative EBIT and net margins indicate ongoing operational losses. The 2025 fiscal year saw moderate revenue growth of 8.5%, improved EBIT by 55%, and a reduction in net loss, signaling progress toward profitability.
Which one has the stronger fundamentals?
The Trade Desk exhibits stronger fundamentals with consistently positive and improving margins, significant net income growth, and high profitability. PagerDuty, while growing revenue and improving losses, remains unprofitable with negative EBIT and net margins. Overall, The Trade Desk’s financial health and margin stability provide a more favorable income statement profile.
Financial Ratios Comparison
The table below presents key financial ratios for The Trade Desk, Inc. (TTD) and PagerDuty, Inc. (PD) based on their most recent fiscal year data available, providing a snapshot of their financial health and valuation metrics.
| Ratios | The Trade Desk, Inc. (TTD) | PagerDuty, Inc. (PD) |
|---|---|---|
| ROE | 13.3% | -32.9% |
| ROIC | 10.0% | -9.7% |
| P/E | 147 | -39.9 |
| P/B | 19.6 | 13.1 |
| Current Ratio | 1.86 | 1.87 |
| Quick Ratio | 1.86 | 1.87 |
| D/E | 0.11 | 3.57 |
| Debt-to-Assets | 5.1% | 50.0% |
| Interest Coverage | 0 (no data) | -6.46 |
| Asset Turnover | 0.40 | 0.50 |
| Fixed Asset Turnover | 5.17 | 16.6 |
| Payout ratio | 0 | 0 |
| Dividend yield | 0 | 0 |
Interpretation of the Ratios
The Trade Desk, Inc.
The Trade Desk shows a generally favorable financial profile, with strong net margin (16.08%) and return on invested capital (10.02%). Its liquidity and leverage ratios are solid, including a current ratio of 1.86 and low debt-to-assets at 5.11%. However, high valuation multiples like a P/E of 146.77 and P/B of 19.56 are points of caution. The company does not pay dividends, likely reinvesting for growth.
PagerDuty, Inc.
PagerDuty’s ratios indicate financial challenges, with negative net margin (-9.14%), return on equity (-32.92%), and return on invested capital (-9.66%). Liquidity is adequate, with a current ratio of 1.87, but leverage is high, shown by debt-to-assets of 50%. Valuation is mixed, with a negative P/E but a relatively high P/B of 13.12. PagerDuty also does not pay dividends, consistent with its reinvestment and growth focus.
Which one has the best ratios?
The Trade Desk exhibits a more favorable overall ratio profile with stronger profitability, lower leverage, and healthier liquidity compared to PagerDuty. While both companies do not pay dividends, The Trade Desk’s financial metrics suggest better operational efficiency and capital management, whereas PagerDuty faces significant profitability and leverage concerns.
Strategic Positioning
This section compares the strategic positioning of The Trade Desk, Inc. and PagerDuty, Inc., including market position, key segments, and exposure to technological disruption:
The Trade Desk, Inc.
- Leading cloud-based digital advertising platform amid high competition in software applications.
- Focuses on data-driven digital advertising campaigns across multiple channels and devices.
- Operates in a technology-driven advertising space with ongoing innovation risks.
PagerDuty, Inc.
- Digital operations management platform serving diverse industries with moderate competitive pressure.
- Uses machine learning to manage digital signals across various software-enabled systems.
- Exposed to machine learning and AI trends in digital operations management technology.
The Trade Desk, Inc. vs PagerDuty, Inc. Positioning
The Trade Desk has a concentrated focus on digital advertising technology, offering multi-channel campaign management. PagerDuty operates a more diversified digital operations platform across various industries, leveraging machine learning for predictive insights. Both face technological disruption but in distinct niches.
Which has the best competitive advantage?
Both companies have a slightly unfavorable moat status, shedding value currently. The Trade Desk shows declining profitability, while PagerDuty’s profitability is improving, indicating different trajectories in their competitive advantages.
Stock Comparison
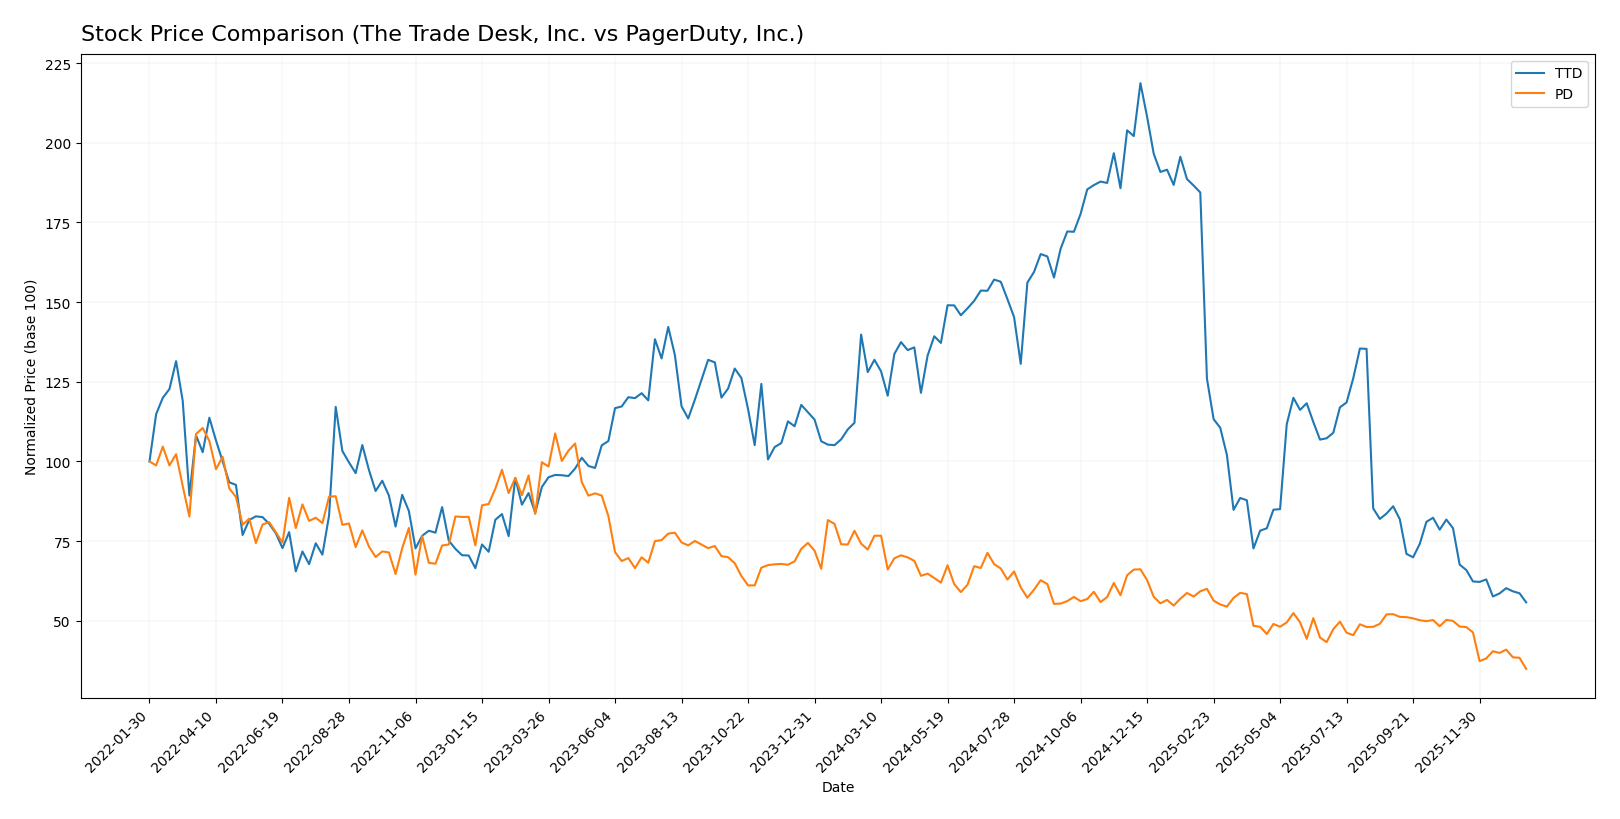
Over the past 12 months, both The Trade Desk, Inc. (TTD) and PagerDuty, Inc. (PD) experienced pronounced bearish trends, marked by significant price declines and decelerating momentum, reflecting challenging trading dynamics in their sectors.
Trend Analysis
The Trade Desk, Inc. (TTD) showed a bearish trend with a -56.43% price change over the past year, accompanied by a deceleration in decline and high volatility (std deviation 28.36). The stock peaked at 139.11 and bottomed at 35.48.
PagerDuty, Inc. (PD) also exhibited a bearish trend, with a -51.76% price change over the same period, decelerating losses and lower volatility (std deviation 2.92). Its highest and lowest prices were 24.66 and 11.22, respectively.
Comparatively, both stocks delivered negative performance, with TTD experiencing a slightly larger decline, indicating PD had the relatively better market performance over the analyzed period.
Target Prices
The current analyst consensus provides a clear range of target prices for these technology application companies.
| Company | Target High | Target Low | Consensus |
|---|---|---|---|
| The Trade Desk, Inc. | 98 | 39 | 56.73 |
| PagerDuty, Inc. | 19 | 15 | 16.2 |
Analysts expect The Trade Desk’s stock to appreciate significantly from its current price of $35.48, with a consensus target almost 60% higher. PagerDuty’s consensus target of $16.2 also suggests upside potential from its current $11.22 price.
Analyst Opinions Comparison
This section compares analysts’ ratings and grades for The Trade Desk, Inc. (TTD) and PagerDuty, Inc. (PD):
Rating Comparison
TTD Rating
- Rating: B, categorized as Very Favorable overall by analysts.
- Discounted Cash Flow Score: 4, indicating a Favorable valuation outlook.
- ROE Score: 4, showing Favorable efficiency in generating profit from equity.
- ROA Score: 4, demonstrating Favorable asset utilization.
- Debt To Equity Score: 3, a Moderate level of financial risk.
- Overall Score: 3, a Moderate overall financial standing.
PD Rating
- Rating: A-, also rated Very Favorable overall by analysts.
- Discounted Cash Flow Score: 5, reflecting a Very Favorable valuation outlook.
- ROE Score: 5, indicating Very Favorable efficiency in profit generation.
- ROA Score: 5, reflecting Very Favorable asset utilization.
- Debt To Equity Score: 1, considered Very Unfavorable due to higher risk.
- Overall Score: 4, a Favorable overall financial standing.
Which one is the best rated?
Based strictly on the provided data, PagerDuty (PD) holds higher ratings across most financial metrics, including discounted cash flow, ROE, and ROA scores, and a better overall score, despite a less favorable debt-to-equity score compared to The Trade Desk (TTD).
Scores Comparison
Here is the comparison of The Trade Desk, Inc. and PagerDuty, Inc. based on their financial scores:
TTD Scores
- Altman Z-Score: 4.3, indicating a safe zone for bankruptcy risk.
- Piotroski Score: 5, reflecting average financial strength.
PD Scores
- Altman Z-Score: 1.26, indicating distress zone with high bankruptcy risk.
- Piotroski Score: 7, reflecting strong financial strength.
Which company has the best scores?
TTD has a significantly higher Altman Z-Score, placing it in the safe zone, whereas PD is in distress zone. PD’s Piotroski Score is higher, suggesting stronger financial health there. Overall, each company shows strengths in different ratings.
Grades Comparison
Here is a comparison of the recent grades issued by reputable financial institutions for both companies:
The Trade Desk, Inc. Grades
The table below summarizes recent grades from well-known grading companies for The Trade Desk:
| Grading Company | Action | New Grade | Date |
|---|---|---|---|
| Morgan Stanley | Maintain | Equal Weight | 2026-01-13 |
| Wells Fargo | Maintain | Equal Weight | 2026-01-12 |
| Cantor Fitzgerald | Maintain | Neutral | 2026-01-08 |
| Wolfe Research | Maintain | Outperform | 2026-01-06 |
| Guggenheim | Maintain | Buy | 2026-01-05 |
| Jefferies | Maintain | Hold | 2025-12-11 |
| Wedbush | Maintain | Neutral | 2025-12-08 |
| DA Davidson | Maintain | Buy | 2025-11-10 |
| Truist Securities | Maintain | Buy | 2025-11-07 |
| Wells Fargo | Maintain | Equal Weight | 2025-11-07 |
Grades for The Trade Desk show a balanced mix of Buy and Hold/Neutral ratings, with no recent upgrades or downgrades, indicating a stable outlook.
PagerDuty, Inc. Grades
The table below summarizes recent grades from credible grading firms for PagerDuty:
| Grading Company | Action | New Grade | Date |
|---|---|---|---|
| Truist Securities | Maintain | Buy | 2026-01-07 |
| RBC Capital | Downgrade | Sector Perform | 2026-01-05 |
| TD Cowen | Maintain | Buy | 2025-11-26 |
| Craig-Hallum | Downgrade | Hold | 2025-11-26 |
| Morgan Stanley | Maintain | Equal Weight | 2025-11-26 |
| RBC Capital | Maintain | Outperform | 2025-11-26 |
| Truist Securities | Maintain | Buy | 2025-11-19 |
| Baird | Maintain | Neutral | 2025-09-04 |
| RBC Capital | Maintain | Outperform | 2025-09-04 |
| Canaccord Genuity | Maintain | Buy | 2025-09-04 |
PagerDuty’s grades present a mix of Buy and Hold ratings, including some recent downgrades, reflecting a cautious stance among analysts.
Which company has the best grades?
The Trade Desk holds a stronger consensus with 28 Buy ratings and a “Buy” consensus, compared to PagerDuty’s 7 Buy ratings and a “Hold” consensus. This suggests The Trade Desk is currently viewed more favorably by analysts, which could influence investor sentiment and portfolio weighting decisions.
Strengths and Weaknesses
Below is a comparative overview of key strengths and weaknesses of The Trade Desk, Inc. (TTD) and PagerDuty, Inc. (PD) based on the most recent financial and operational data.
| Criterion | The Trade Desk, Inc. (TTD) | PagerDuty, Inc. (PD) |
|---|---|---|
| Diversification | Moderate; focused on digital ad tech | Limited; specialized in IT incident management |
| Profitability | Favorable net margin (16.08%), positive ROIC (10.02%) | Unfavorable net margin (-9.14%), negative ROIC (-9.66%) |
| Innovation | Strong fixed asset turnover (5.17), invests in tech | High fixed asset turnover (16.61), growing ROIC trend |
| Global presence | Established global digital advertising footprint | Growing presence, but smaller scale globally |
| Market Share | Significant player in programmatic advertising | Niche market leader in incident response tools |
Key takeaways: The Trade Desk shows stronger profitability and financial stability with favorable margins and value creation, while PagerDuty faces profitability challenges but demonstrates improving efficiency and innovation. Investors should weigh TTD’s stable returns against PD’s growth potential with caution.
Risk Analysis
The table below summarizes key risk factors for The Trade Desk, Inc. (TTD) and PagerDuty, Inc. (PD) based on the most recent financial and market data.
| Metric | The Trade Desk, Inc. (TTD) | PagerDuty, Inc. (PD) |
|---|---|---|
| Market Risk | Beta 1.105; moderate market sensitivity due to tech sector volatility | Beta 0.627; lower market sensitivity but recent share price decline |
| Debt level | Low debt-to-equity 0.11; strong balance sheet | High debt-to-equity 3.57; significant leverage risk |
| Regulatory Risk | Moderate; operates globally in digital advertising with evolving data privacy laws | Moderate; operates in digital operations management subject to software compliance |
| Operational Risk | Medium; relies on platform uptime and data accuracy | Medium-high; depends on real-time incident management and AI algorithms |
| Environmental Risk | Low; primarily a software company with limited physical environmental impact | Low; software-based with minimal direct environmental footprint |
| Geopolitical Risk | Moderate; global reach exposes it to international trade and data regulation risks | Moderate; international operations expose it to geopolitical tensions |
In synthesis, PagerDuty’s elevated debt level and negative profitability metrics pose the most significant financial risks, exacerbated by its Altman Z-score in the distress zone. The Trade Desk shows stronger financial stability and lower leverage, but its high valuation multiples may increase market risk sensitivity. Both companies face moderate operational and regulatory risks typical for tech firms operating globally.
Which Stock to Choose?
The Trade Desk, Inc. (TTD) shows a strong income evolution with 25.63% revenue growth in 2024 and favorable profitability ratios, including a 16.08% net margin. Its debt levels are low with a 0.11 debt-to-equity ratio, and its overall financial ratios are mostly favorable. The company holds a “B” rating, reflecting solid but mixed valuation metrics.
PagerDuty, Inc. (PD) has moderate income growth of 8.54% in 2025 but reports a negative net margin of -9.14% and unfavorable profitability ratios. Its debt burden is higher, with a 3.57 debt-to-equity ratio and 50% debt to assets, though liquidity ratios remain favorable. PD carries an “A-” rating, indicating strong operational scores but financial leverage concerns.
Investors prioritizing stable profitability and low leverage might find The Trade Desk’s financial profile more favorable, while those focusing on growth potential amid improving profitability trends could view PagerDuty as a developing opportunity. The contrasting financial health and ratings suggest a choice largely depends on an investor’s risk tolerance and strategic focus.
Disclaimer: Investment carries a risk of loss of initial capital. The past performance is not a reliable indicator of future results. Be sure to understand risks before making an investment decision.
Go Further
I encourage you to read the complete analyses of The Trade Desk, Inc. and PagerDuty, Inc. to enhance your investment decisions: