In the fast-evolving semiconductor industry, QUALCOMM Incorporated and Onto Innovation Inc. stand out as key players shaping technological progress. QUALCOMM leads in wireless communication technologies and licensing, while Onto Innovation excels in process control and inspection tools critical for chip manufacturing. Both companies drive innovation yet serve distinct market niches. This article will help you decide which stock offers the most compelling investment opportunity in 2026.

Table of contents
Companies Overview
I will begin the comparison between QUALCOMM and Onto Innovation by providing an overview of these two companies and their main differences.
QUALCOMM Overview
QUALCOMM Incorporated focuses on the development and commercialization of foundational wireless technologies globally. Operating through three segments—QCT, QTL, and QSI—it supplies integrated circuits, licenses intellectual property related to 3G to 5G standards, and invests in early-stage tech companies. Founded in 1985 and headquartered in San Diego, it holds a leading position in semiconductors with a workforce of 49,000 employees.
Onto Innovation Overview
Onto Innovation Inc. designs, manufactures, and supports process control tools and software for semiconductor and advanced packaging device manufacturers. Its offerings include macro defect inspection, lithography systems, and process control solutions used across various industries. Established in 1940 and based in Wilmington, Massachusetts, it employs about 1,551 people and serves a specialized niche within the semiconductor industry.
Key similarities and differences
Both QUALCOMM and Onto Innovation operate in the semiconductor sector, focusing on technology development and manufacturing. QUALCOMM is a larger, diversified company with a broad portfolio including wireless communication technologies and intellectual property licensing, while Onto Innovation is more specialized, concentrating on process control and inspection tools for semiconductor manufacturing. Their business models differ in scale, product scope, and market focus.
Income Statement Comparison
The table below compares the key income statement metrics for QUALCOMM Incorporated and Onto Innovation Inc. for their most recent fiscal years, offering a snapshot of their financial performance.

| Metric | QUALCOMM Incorporated | Onto Innovation Inc. |
|---|---|---|
| Market Cap | 175.4B | 10.8B |
| Revenue | 44.28B | 987.3M |
| EBITDA | 14.93B | 249.4M |
| EBIT | 13.33B | 187.1M |
| Net Income | 5.54B | 201.7M |
| EPS | 5.06 | 4.09 |
| Fiscal Year | 2025 | 2024 |
Income Statement Interpretations
QUALCOMM Incorporated
QUALCOMM’s revenue increased steadily from $33.6B in 2021 to $44.3B in 2025, reflecting a 31.9% growth over five years. Despite rising revenues, net income showed a declining trend, dropping from $9.0B in 2021 to $5.5B in 2025, accompanied by a 53.6% decrease in net margin. The 2025 year saw revenue growth of 13.7%, but net margin and EPS declined significantly, indicating margin pressure despite higher sales.
Onto Innovation Inc.
Onto Innovation exhibited robust revenue growth from $556M in 2020 to $987M in 2024, a 77.4% increase over five years. Net income surged impressively from $31M to $202M during this period, with net margin improving to 20.4% in 2024. The most recent year showed a strong 21% revenue increase and a 37.6% net margin growth, highlighting accelerated profitability and operational efficiency gains.
Which one has the stronger fundamentals?
Onto Innovation demonstrates stronger fundamentals with consistent and substantial improvements in revenue, net income, and margins, all rated favorably. QUALCOMM, while growing revenue steadily and maintaining solid gross and EBIT margins, faces unfavorable trends in net income and margin contraction over the period. Overall, Onto’s performance metrics show more notable growth and margin expansion.
Financial Ratios Comparison
This table presents the latest key financial ratios for QUALCOMM Incorporated (QCOM) and Onto Innovation Inc. (ONTO) based on their most recent fiscal year-end data.
| Ratios | QUALCOMM Incorporated (2025) | Onto Innovation Inc. (2024) |
|---|---|---|
| ROE | 26.13% | 10.47% |
| ROIC | 13.19% | 8.77% |
| P/E | 32.70 | 41.76 |
| P/B | 8.54 | 4.37 |
| Current Ratio | 2.82 | 8.69 |
| Quick Ratio | 2.10 | 7.00 |
| D/E (Debt-to-Equity) | 0.70 | 0.008 |
| Debt-to-Assets | 29.54% | 0.72% |
| Interest Coverage | 18.61 | 0 |
| Asset Turnover | 0.88 | 0.47 |
| Fixed Asset Turnover | 9.44 | 7.16 |
| Payout ratio | 68.67% | 0 |
| Dividend yield | 2.10% | 0% |
Interpretation of the Ratios
QUALCOMM Incorporated
QUALCOMM shows predominantly strong financial ratios with favorable net margin (12.51%), ROE (26.13%), and ROIC (13.19%), alongside a solid current ratio of 2.82 indicating good liquidity. However, valuation metrics like PE (32.7) and PB (8.54) appear stretched, which may concern value-conscious investors. The company pays dividends, with a 2.1% yield supported by healthy free cash flow coverage, suggesting a sustainable shareholder return policy.
Onto Innovation Inc.
Onto Innovation presents mixed ratios, with a favorable net margin of 20.43% but neutral ROE (10.47%) and ROIC (8.77%), signaling moderate profitability. The company’s current ratio is high (8.69), but this is marked unfavorable, possibly indicating inefficient asset use. Onto does not pay dividends, likely due to a reinvestment strategy or growth focus, and maintains favorable debt levels with no reported dividend yield, reflecting a conservative financial structure.
Which one has the best ratios?
QUALCOMM’s ratios are globally favorable, reflecting strong profitability, liquidity, and dividend sustainability despite higher valuation multiples. Onto Innovation’s ratios are more balanced between favorable and unfavorable, with some concerns on asset turnover and valuation. Overall, QUALCOMM demonstrates a more consistent financial profile, while Onto Innovation reflects a more cautious, growth-oriented stance.
Strategic Positioning
This section compares the strategic positioning of QUALCOMM and Onto Innovation, focusing on Market position, Key segments, and exposure to technological disruption:
QUALCOMM Incorporated
- Large market cap of 175B, facing competitive pressure in semiconductors and wireless tech industries.
- Operates across three segments: QCT (integrated circuits), QTL (licensing patents), and QSI (investments).
- Positioned in foundational wireless tech; exposed to disruption from evolving wireless standards and AI investments.
Onto Innovation Inc.
- Smaller market cap of 10.8B, competing in niche semiconductor process control tools market.
- Focused on process control tools, lithography, and process control software for semiconductor manufacturing.
- Exposure to disruption through innovation in optical metrology and packaging lithography systems.
QUALCOMM vs Onto Innovation Positioning
QUALCOMM adopts a diversified approach with multiple revenue segments and technology investments, while Onto Innovation concentrates on specialized process control systems. QUALCOMM benefits from scale and IP licensing; Onto focuses on niche manufacturing tools with potential for targeted innovation.
Which has the best competitive advantage?
QUALCOMM demonstrates a slightly favorable moat with value creation despite declining profitability, whereas Onto Innovation shows a slightly unfavorable moat, shedding value but improving profitability, indicating QUALCOMM currently holds a stronger competitive advantage.
Stock Comparison
The stock price movements of QUALCOMM Incorporated and Onto Innovation Inc. over the past year reveal distinct bullish trends with notable acceleration, underscoring differing volatility and trading volumes in their respective markets.
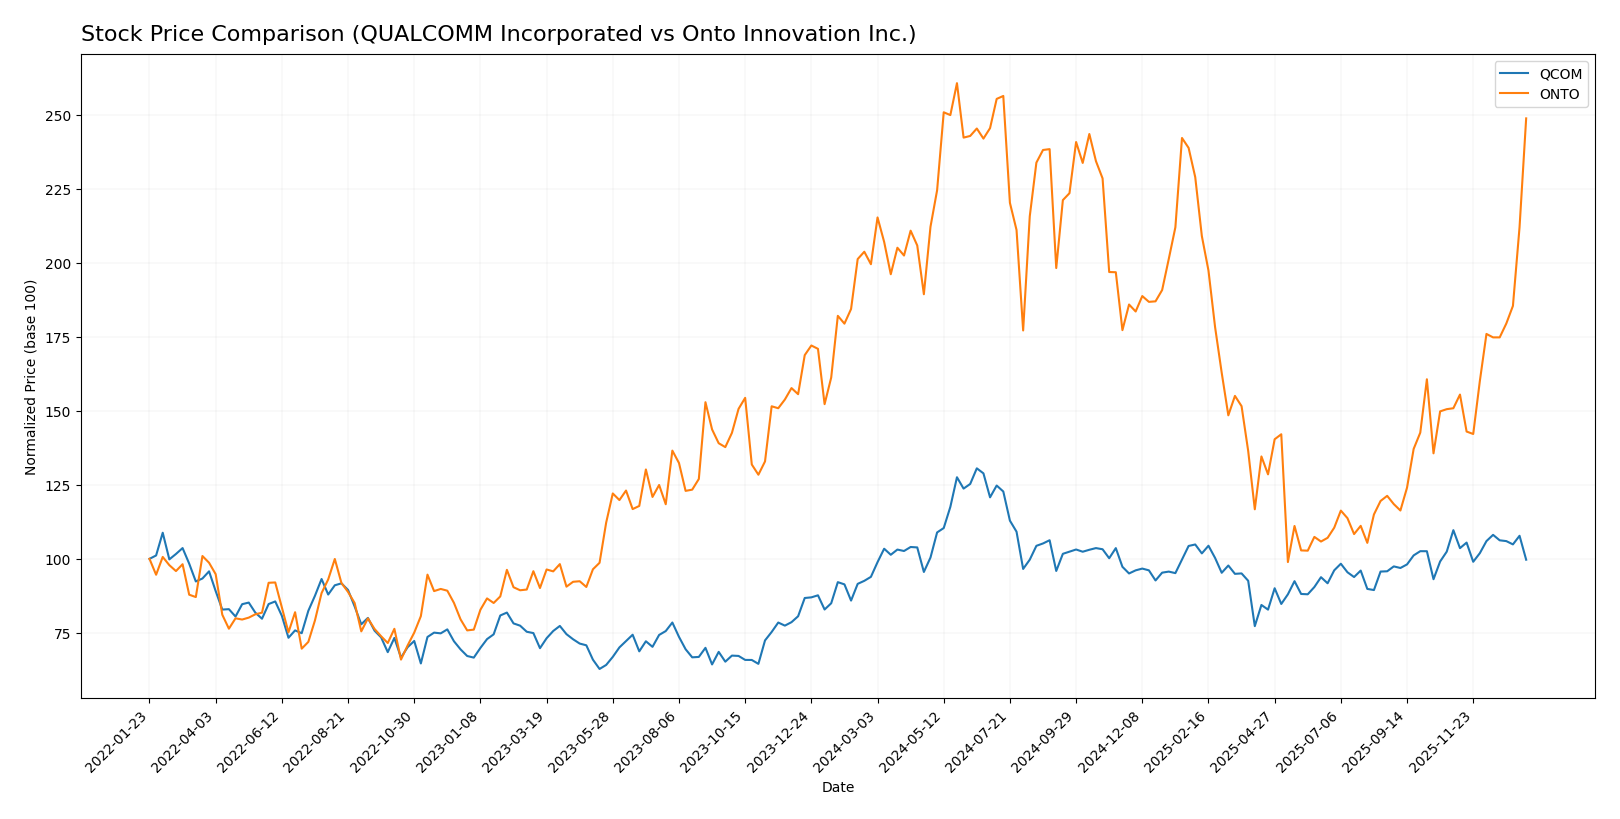
Trend Analysis
QUALCOMM Incorporated’s stock rose by 6.16% over the past 12 months, indicating a bullish trend with acceleration. The price fluctuated between 127.46 and 215.33, with volatility measured by a 16.08 standard deviation. A recent short-term decline of 9.09% shows deceleration.
Onto Innovation Inc. experienced a 24.68% price increase over the same period, reflecting a strong bullish trend with acceleration. The stock price ranged from 88.5 to 233.14, exhibiting higher volatility at 42.68 standard deviation. Recent gains accelerated sharply by 64.87%.
Comparing both, Onto Innovation Inc. outperformed QUALCOMM with the highest market performance, driven by stronger price appreciation and increased buyer dominance in recent trading periods.
Target Prices
The current consensus target prices for QUALCOMM Incorporated and Onto Innovation Inc. indicate varied analyst expectations in the semiconductor sector.
| Company | Target High | Target Low | Consensus |
|---|---|---|---|
| QUALCOMM Incorporated | 210 | 165 | 185.71 |
| Onto Innovation Inc. | 200 | 160 | 178 |
Analysts project moderate upside potential for both QUALCOMM and Onto Innovation compared to their current prices of $163.82 and $220.68, respectively, signaling cautious optimism in these stocks.
Analyst Opinions Comparison
This section compares analysts’ ratings and grades for QUALCOMM Incorporated and Onto Innovation Inc.:
Rating Comparison
QUALCOMM Incorporated Rating
- Rating: Both companies have a B+ rating, considered very favorable.
- Discounted Cash Flow Score: QCOM scores 4, indicating favorable valuation based on future cash flows.
- ROE Score: QCOM achieves a top score of 5, showing very efficient profit generation from equity.
- ROA Score: QCOM scores 5, demonstrating very effective asset utilization.
- Debt To Equity Score: QCOM has a low score of 1, indicating very unfavorable financial risk due to high leverage.
- Overall Score: Both companies have an overall score of 3, categorized as moderate.
Onto Innovation Inc. Rating
- Rating: Both companies have a B+ rating, considered very favorable.
- Discounted Cash Flow Score: ONTO scores 3, reflecting a moderate valuation outlook.
- ROE Score: ONTO scores 3, indicating moderate efficiency in generating profit from equity.
- ROA Score: ONTO scores 4, showing favorable asset utilization.
- Debt To Equity Score: ONTO scores 4, indicating favorable financial stability with lower leverage.
- Overall Score: Both companies have an overall score of 3, categorized as moderate.
Which one is the best rated?
Both QUALCOMM and Onto Innovation share the same B+ rating and overall score of 3, indicating moderate strength. QUALCOMM excels in profitability metrics while Onto Innovation shows better financial stability with lower debt risk.
Scores Comparison
Here is a comparison of the Altman Z-Score and Piotroski Score for the two companies:
QCOM Scores
- Altman Z-Score: 6.37, indicating a strong safe zone financial position.
- Piotroski Score: 7, classified as strong financial health.
ONTO Scores
- Altman Z-Score: 34.16, indicating an exceptionally strong safe zone position.
- Piotroski Score: 4, indicating average financial strength.
Which company has the best scores?
ONTO’s Altman Z-Score is significantly higher than QCOM’s, indicating a very strong financial safety margin. However, QCOM’s Piotroski Score is stronger, suggesting better overall financial health compared to ONTO’s average score.
Grades Comparison
Here is a comparison of the recent grades assigned to QUALCOMM Incorporated and Onto Innovation Inc.:
QUALCOMM Incorporated Grades
The following table summarizes recent grades from reputable grading companies for QUALCOMM Incorporated:
| Grading Company | Action | New Grade | Date |
|---|---|---|---|
| Mizuho | Downgrade | Neutral | 2026-01-09 |
| Rosenblatt | Maintain | Buy | 2025-11-06 |
| B of A Securities | Maintain | Buy | 2025-11-06 |
| Mizuho | Maintain | Outperform | 2025-11-06 |
| Wells Fargo | Maintain | Underweight | 2025-11-06 |
| Piper Sandler | Maintain | Overweight | 2025-11-06 |
| UBS | Maintain | Neutral | 2025-11-06 |
| JP Morgan | Maintain | Overweight | 2025-11-04 |
| Citigroup | Maintain | Neutral | 2025-10-28 |
| Rosenblatt | Maintain | Buy | 2025-10-28 |
QUALCOMM’s grades show a mix of buy and neutral ratings, with a recent downgrade to neutral by Mizuho, indicating some caution among analysts.
Onto Innovation Inc. Grades
The following table displays recent grades from reputable grading companies for Onto Innovation Inc.:
| Grading Company | Action | New Grade | Date |
|---|---|---|---|
| Needham | Maintain | Buy | 2026-01-06 |
| Jefferies | Maintain | Buy | 2025-12-15 |
| Needham | Maintain | Buy | 2025-11-18 |
| B. Riley Securities | Maintain | Buy | 2025-11-18 |
| Evercore ISI Group | Maintain | Outperform | 2025-11-05 |
| Oppenheimer | Maintain | Outperform | 2025-10-14 |
| Stifel | Maintain | Hold | 2025-10-13 |
| B. Riley Securities | Maintain | Buy | 2025-10-10 |
| Jefferies | Upgrade | Buy | 2025-09-23 |
| Benchmark | Maintain | Buy | 2025-08-08 |
Onto Innovation’s grades predominantly reflect buy and outperform ratings, suggesting strong analyst confidence in the company.
Which company has the best grades?
Onto Innovation Inc. has received consistently higher grades, mainly buy and outperform, compared to QUALCOMM’s mixed buy and neutral ratings with some recent downgrades. This contrast could influence investors’ perception of growth potential and risk profiles.
Strengths and Weaknesses
Below is a comparison of strengths and weaknesses for QUALCOMM Incorporated (QCOM) and Onto Innovation Inc. (ONTO) based on the most recent financial and operational data.
| Criterion | QUALCOMM Incorporated (QCOM) | Onto Innovation Inc. (ONTO) |
|---|---|---|
| Diversification | Strong diversification with dominant segments in QCT ($38.4B in 2025) and QTL ($5.6B) | Moderate diversification focused on Systems and Software ($850M in 2024) with smaller parts and service revenues |
| Profitability | Favorable net margin (12.5%), ROE (26.1%), and ROIC (13.2%) indicating strong profitability | Higher net margin (20.4%) but neutral ROE (10.5%) and ROIC (8.8%), with unfavorable WACC (10.6%) |
| Innovation | Known for innovation in semiconductor technology, sustaining competitive advantage but facing declining ROIC trend | Innovation improving, reflected by rapidly growing ROIC trend (+344%), but still value destroying overall |
| Global presence | Extensive global footprint with significant scale and market reach | Smaller global footprint, more niche markets in semiconductor equipment |
| Market Share | Large market share in mobile chipsets and licensing | Smaller market share, focused on semiconductor process control and metrology |
Key takeaways: QCOM demonstrates strong profitability and global reach with well-diversified revenue streams, though profitability shows signs of decline. ONTO shows promising growth in profitability metrics and innovation but currently destroys value and holds a smaller market position. Investors should weigh QCOM’s stable scale against ONTO’s growth potential and higher risk.
Risk Analysis
Below is a comparative table outlining key risks for QUALCOMM Incorporated (QCOM) and Onto Innovation Inc. (ONTO) based on the most recent data available:
| Metric | QUALCOMM Incorporated (QCOM) | Onto Innovation Inc. (ONTO) |
|---|---|---|
| Market Risk | Beta 1.21 – moderate volatility | Beta 1.46 – higher volatility |
| Debt level | Debt/Equity 0.7 – moderate risk | Debt/Equity 0.01 – very low risk |
| Regulatory Risk | Moderate – exposure to tech/IP laws | Moderate – semiconductor industry regulation |
| Operational Risk | Moderate – complex global operations | Moderate – specialized manufacturing processes |
| Environmental Risk | Moderate – industry-related compliance | Moderate – manufacturing environmental impact |
| Geopolitical Risk | Moderate – global supply chain exposure | Moderate – global tech supply chain dependencies |
Synthesis: The most impactful risks for both companies lie in market volatility and operational challenges due to the semiconductor sector’s complexity. Onto Innovation faces higher market risk with a beta of 1.46, while Qualcomm’s moderate debt level poses balanced financial risk. Regulatory and geopolitical risks remain moderate with ongoing global tech trade tensions.
Which Stock to Choose?
QUALCOMM Incorporated (QCOM) shows a favorable income evolution with strong revenue and EBIT growth, despite net margin declines. Financial ratios are largely favorable, highlighting solid profitability, moderate debt, and a very favorable rating. The company creates value but faces a slightly declining profitability trend.
Onto Innovation Inc. (ONTO) exhibits robust income growth across all key metrics, including net margin and EPS, with a neutral financial ratios profile. Its debt levels are very low, and rating status is very favorable. However, the company is currently shedding value despite improving profitability and a growing ROIC.
For investors focused on value creation and overall financial strength, QCOM’s favorable rating and stable income performance might appear more suitable. Conversely, those prioritizing high growth potential and improving profitability trends could find ONTO’s profile more appealing, despite its neutral ratios and value destruction status.
Disclaimer: Investment carries a risk of loss of initial capital. The past performance is not a reliable indicator of future results. Be sure to understand risks before making an investment decision.
Go Further
I encourage you to read the complete analyses of QUALCOMM Incorporated and Onto Innovation Inc. to enhance your investment decisions: