Home > Comparison > Technology > QCOM vs NXPI
The strategic rivalry between QUALCOMM Incorporated and NXP Semiconductors N.V. defines the current trajectory of the semiconductor industry. QUALCOMM operates as a technology innovator focused on wireless communication and licensing, while NXP emphasizes diversified semiconductor solutions across automotive and IoT sectors. This head-to-head pits a licensing-driven powerhouse against a product-centric innovator. This analysis will determine which corporate path offers superior risk-adjusted returns for a diversified portfolio.

Table of contents
Companies Overview
QUALCOMM and NXP Semiconductors lead innovation in the global semiconductor market with distinct strategic approaches.
QUALCOMM: Wireless Technology Pioneer
QUALCOMM dominates the wireless industry by developing foundational technologies for 3G to 5G communications. Its revenues stem from integrated circuits and licensing its vast patent portfolio. In 2026, the company focuses on expanding its 5G ecosystem and investing in AI, automotive, and IoT through strategic initiatives.
NXP Semiconductors: Diverse Semiconductor Solutions
NXP Semiconductors excels in delivering broad semiconductor products including microcontrollers, processors, and wireless connectivity solutions. Its core revenue comes from automotive, industrial, and IoT markets. In 2026, NXP emphasizes innovation in communication processors and sensors, targeting automotive safety and connectivity growth.
Strategic Collision: Similarities & Divergences
QUALCOMM relies on a patent-driven licensing model, while NXP builds strength through product diversification. Both compete fiercely in wireless and automotive chips, but QUALCOMM leans on ecosystem control. NXP bets on broad application reach. Their investment profiles differ: QUALCOMM offers steady licensing income versus NXP’s growth from product expansion.
Income Statement Comparison
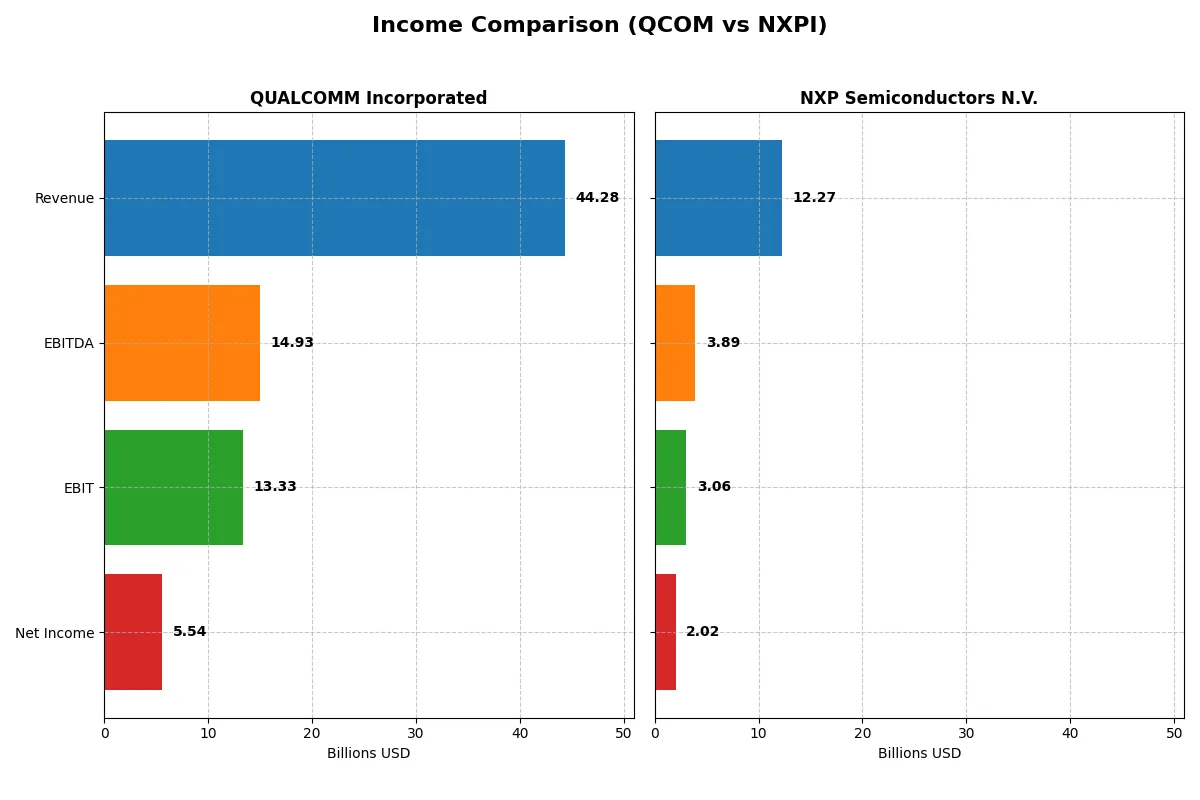
This data dissects the core profitability and scalability of both corporate engines to reveal who dominates the bottom line:
| Metric | QUALCOMM Incorporated (QCOM) | NXP Semiconductors N.V. (NXPI) |
|---|---|---|
| Revenue | 44.3B | 12.3B |
| Cost of Revenue | 19.7B | 5.6B |
| Operating Expenses | 12.2B | 3.4B |
| Gross Profit | 24.5B | 6.7B |
| EBITDA | 14.9B | 3.9B |
| EBIT | 13.3B | 3.1B |
| Interest Expense | 664M | 384M |
| Net Income | 5.5B | 2.0B |
| EPS | 5.06 | 8.00 |
| Fiscal Year | 2025 | 2025 |
Income Statement Analysis: The Bottom-Line Duel
This income statement comparison reveals which company converts revenue into profit with greater efficiency and sustainability.
QUALCOMM Incorporated Analysis
QUALCOMM’s revenue grew strongly by 13.7% in 2025, reaching $44.3B, yet its net income halved year-over-year to $5.54B. The gross margin remains robust at 55.4%, and EBIT margin impresses at 30.1%, signaling operational strength. However, net margin contracted sharply, reflecting increased tax burden and other expenses, dampening bottom-line momentum despite solid revenue gains.
NXP Semiconductors N.V. Analysis
NXP’s 2025 revenue declined 2.7% to $12.3B, with net income falling 19% to $2.02B. Gross margin stands healthy at 54.4%, but EBIT margin trails QUALCOMM at 24.9%. The company faces headwinds in profitability with shrinking revenue and net margin compressing to 16.5%. Still, NXP’s net income and EPS have grown moderately over the longer term, suggesting resilient core profitability.
Margin Dominance vs. Steady Growth
QUALCOMM leads in scale and operating efficiency but suffers from volatile net income and margin compression. NXP shows steadier net income growth over time but struggles with recent revenue and profit declines. For investors, QUALCOMM’s profile suits those prioritizing margin power, while NXP appeals to those valuing consistent earnings growth amid cyclical pressures.
Financial Ratios Comparison
These vital ratios act as a diagnostic tool to expose the underlying fiscal health, valuation premiums, and capital efficiency of the companies compared below:
| Ratios | QUALCOMM Incorporated (QCOM) | NXP Semiconductors N.V. (NXPI) |
|---|---|---|
| ROE | 26.13% | 20.10% |
| ROIC | 13.19% | 11.03% |
| P/E | 32.70 | 27.14 |
| P/B | 8.54 | 5.45 |
| Current Ratio | 2.82 | 2.05 |
| Quick Ratio | 2.10 | 1.38 |
| D/E (Debt-to-Equity) | 0.70 | 1.22 |
| Debt-to-Assets | 29.54% | 46.02% |
| Interest Coverage | 18.61 | 8.62 |
| Asset Turnover | 0.88 | 0.46 |
| Fixed Asset Turnover | 9.44 | 4.12 |
| Payout Ratio | 68.67% | 50.72% |
| Dividend Yield | 2.10% | 1.87% |
| Fiscal Year | 2025 | 2025 |
Efficiency & Valuation Duel: The Vital Signs
Ratios act as a company’s DNA, revealing hidden risks and operational excellence essential for evaluating investment potential.
QUALCOMM Incorporated
QUALCOMM posts a strong ROE at 26.13% and a solid net margin of 12.51%, demonstrating robust profitability. Its P/E of 32.7 and P/B of 8.54 suggest a stretched valuation compared to sector averages. The company rewards shareholders with a 2.1% dividend yield, reflecting balanced capital allocation and shareholder returns.
NXP Semiconductors N.V.
NXP delivers a favorable net margin of 16.47% and a respectable ROE of 20.1%, indicating efficient operations. Its P/E of 27.14 and P/B of 5.45 show a relatively lower valuation multiple than QUALCOMM but still on the higher side. NXP’s 1.87% dividend yield is modest, signaling a cautious approach to shareholder returns amid higher leverage.
Premium Valuation vs. Operational Safety
QUALCOMM’s superior profitability and dividend yield contrast with a higher valuation and lower leverage. NXP offers a leaner valuation but carries elevated debt and weaker asset turnover. Investors prioritizing operational safety may lean towards QUALCOMM, while those tolerating more risk might consider NXP’s growth profile.
Which one offers the Superior Shareholder Reward?
I compare QUALCOMM and NXP Semiconductors’ payout approaches to total shareholder returns. QUALCOMM yields ~2.1%, with a high payout ratio near 69%, supported by strong free cash flow of $11.7/share. Its buybacks are consistent and substantial, enhancing shareholder value. NXP yields slightly less at ~1.9%, with a moderate payout ratio around 51%, backed by $9.6/share free cash flow. NXP’s buyback program is less intense, reflecting its higher leverage and capital expenditures. I see QUALCOMM’s balanced mix of dividends and aggressive buybacks as more sustainable and rewarding in 2026. Thus, QUALCOMM offers the more attractive total return profile for long-term investors.
Comparative Score Analysis: The Strategic Profile
The radar chart reveals the fundamental DNA and trade-offs of QUALCOMM Incorporated and NXP Semiconductors N.V., highlighting their distinct financial strengths and vulnerabilities:
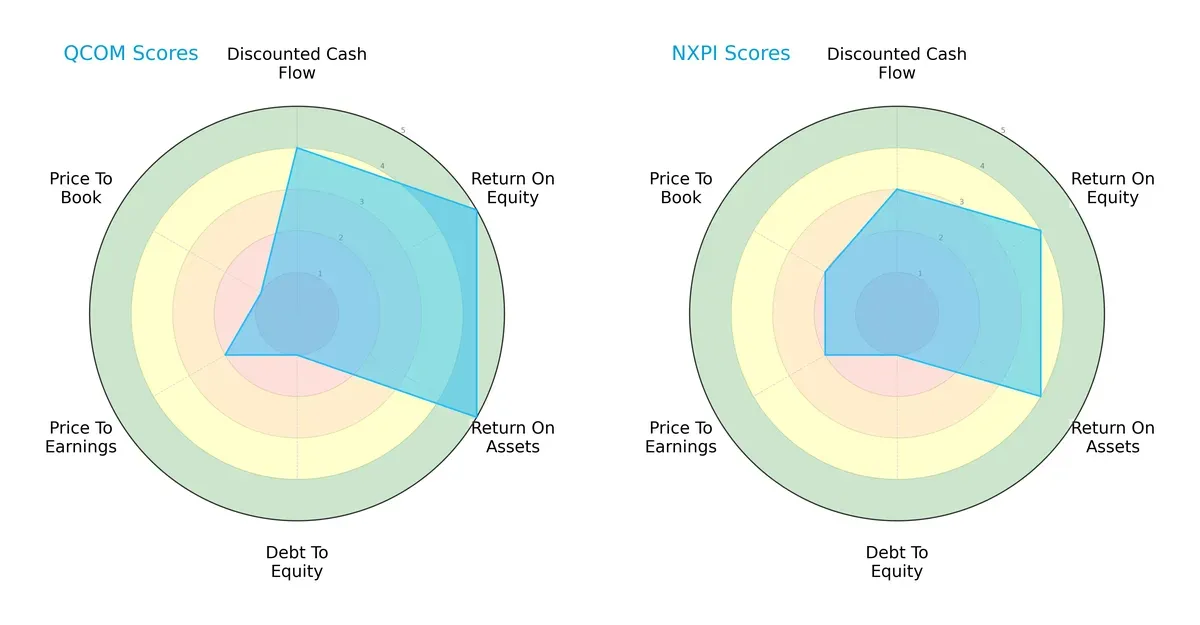
QUALCOMM leads with superior profitability metrics, scoring 5 in both ROE and ROA, reflecting efficient capital and asset utilization. NXP lags slightly with scores of 4 in these areas but shows a more balanced valuation profile, scoring 2 in price-to-book versus QUALCOMM’s 1. Both firms suffer from weak debt-to-equity scores (1), signaling elevated leverage risks. QUALCOMM’s edge lies in its cash flow valuation (DCF score 4), while NXP maintains a steadier valuation balance. Overall, QUALCOMM relies on operational excellence, whereas NXP offers a more moderate but diversified financial stance.
Bankruptcy Risk: Solvency Showdown
The Altman Z-Score comparison underscores a clear solvency advantage for QUALCOMM over NXP in this cycle:
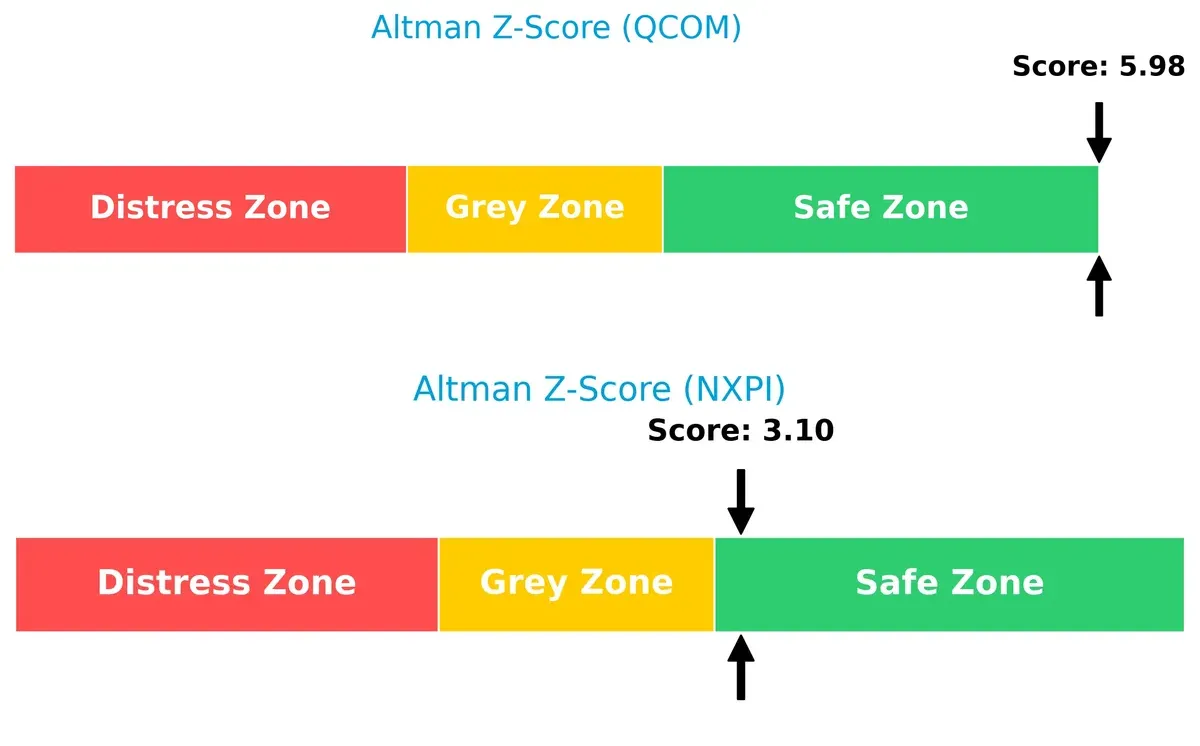
QUALCOMM’s robust Z-Score of 5.98 places it firmly in the safe zone, indicating minimal bankruptcy risk. NXP’s score of 3.10, while also in the safe zone, is closer to the grey area threshold, signaling a more moderate margin of safety. Investors should note QUALCOMM’s stronger resilience in adverse market conditions.
Financial Health: Quality of Operations
Piotroski F-Scores reveal a notable divergence in internal financial health between the two companies:
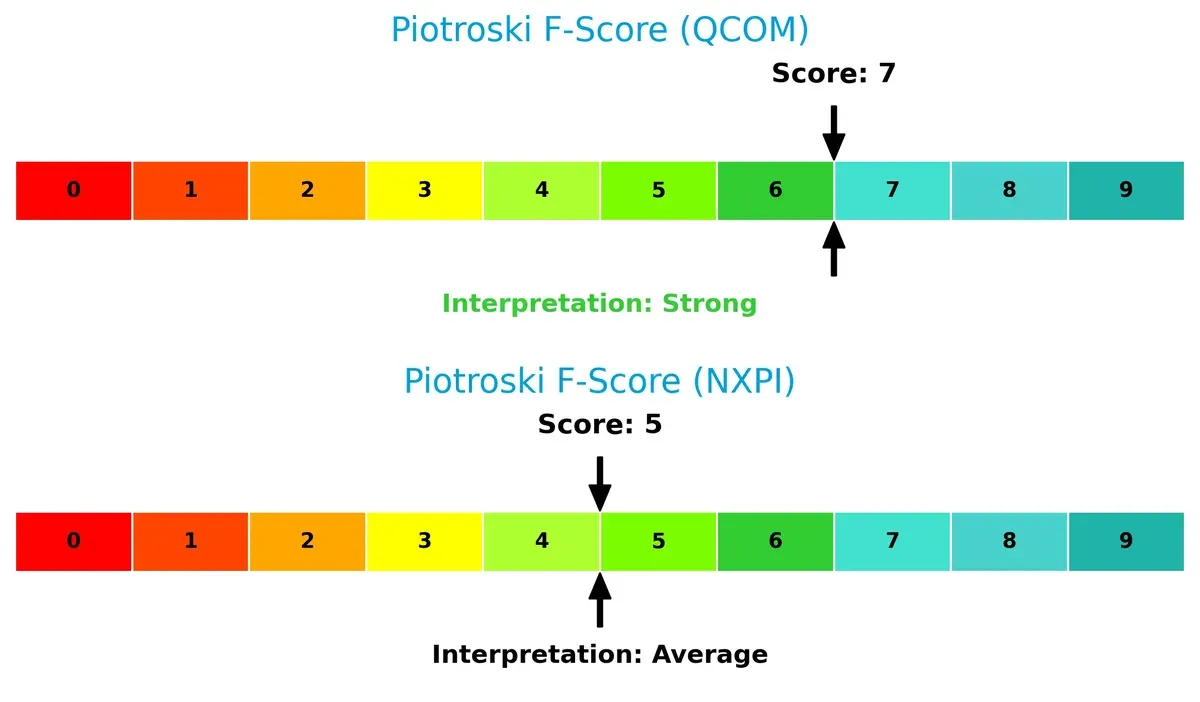
QUALCOMM’s score of 7 signals strong financial fundamentals, reflecting solid profitability, leverage, and operational efficiency. NXP’s score of 5 is average, suggesting potential red flags in some internal metrics and less robust financial quality. This gap highlights QUALCOMM’s superior operational discipline and risk management.
How are the two companies positioned?
This section dissects QUALCOMM and NXP’s operational DNA by comparing their revenue distribution and internal dynamics—strengths and weaknesses. The goal is to confront their economic moats and identify which model offers the most resilient competitive advantage today.
Revenue Segmentation: The Strategic Mix
The following comparison dissects how QUALCOMM Incorporated and NXP Semiconductors N.V. diversify their income streams and highlights their primary sector bets:
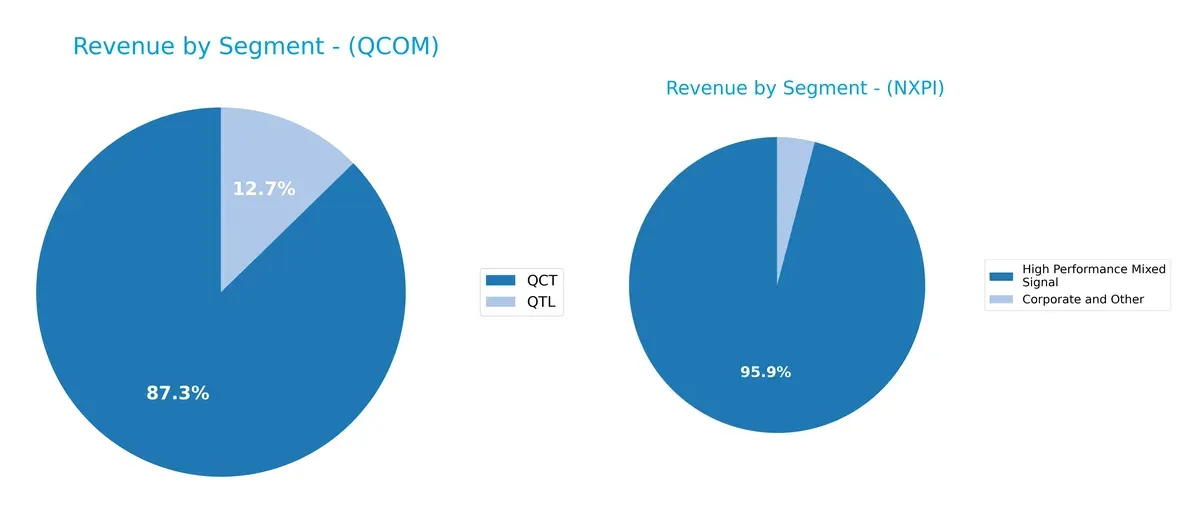
QUALCOMM anchors its revenue in the QCT segment with $38.4B in 2025, while QTL contributes $5.6B, showing moderate diversification. In contrast, NXP relies heavily on High Performance Mixed Signal at $9B, dwarfing its Standard Products segment. QUALCOMM’s mix reflects a strong ecosystem lock-in via chipsets plus licensing. NXP’s concentration risks hinge on mixed-signal dominance but signals infrastructure strength in automotive and industrial markets.
Strengths and Weaknesses Comparison
This table compares the strengths and weaknesses of QUALCOMM and NXP Semiconductors based on diversification, profitability, financials, innovation, global presence, and market share:
QUALCOMM Strengths
- Strong profitability with 12.5% net margin and 26.1% ROE
- Robust liquidity with current ratio 2.82
- Lower debt-to-assets at 29.5%
- High fixed asset turnover at 9.44 indicating efficient asset use
- Large revenue from diverse geographic markets including China and Korea
- Leading market share in QCT segment
NXP Semiconductors Strengths
- Higher net margin at 16.5%
- Solid ROE at 20.1%
- Favorable quick ratio at 1.38
- Strong dividend yield support
- Diversified revenue across Europe, Asia, and the U.S.
- Significant sales in High Performance Mixed Signal products
QUALCOMM Weaknesses
- High P/E of 32.7 and P/B of 8.54 suggest overvaluation risk
- Neutral debt-to-equity ratio at 0.7 limits leverage benefits
- Neutral asset turnover at 0.88 implies moderate capital efficiency
- Concentrated revenue with heavy reliance on China
- Limited segment diversification outside core QCT and QTL
NXP Semiconductors Weaknesses
- Higher debt-to-equity at 1.22 flags leverage risk
- Lower asset turnover at 0.46 indicates less efficient use of assets
- P/E of 27.1 and P/B of 5.45 signal valuation concerns
- Lower dividend yield at 1.87%
- Slightly less favorable global ratio profile
- Revenue more concentrated in High Performance Mixed Signal segment
Both companies show strong profitability but face valuation pressures. QUALCOMM’s superior liquidity and asset efficiency contrast with NXP’s higher leverage and lower asset turnover. Geographic and segment diversification vary, influencing strategic risk profiles.
The Moat Duel: Analyzing Competitive Defensibility
A structural moat is the only reliable shield against competitive erosion of long-term profits. Let’s dissect the moats of two semiconductor leaders:
QUALCOMM Incorporated: Licensing Powerhouse with Network Effects
QUALCOMM’s primary moat stems from its vast patent portfolio and licensing model. This creates recurring revenue and high ROIC near 4%, though profitability has declined recently. New 5G innovations could either fortify or pressure this moat in 2026.
NXP Semiconductors N.V.: Diversified Product Portfolio with Cost Discipline
NXP relies on product breadth and cost advantages, contrasting QUALCOMM’s IP dominance. Its ROIC lags below WACC, indicating value erosion, but steady expansion in automotive and IoT markets offers growth potential.
Licensing Dominance vs. Product Breadth: Who Holds the Stronger Moat?
QUALCOMM’s wider moat, evidenced by sustained value creation and licensing scale, outmatches NXP’s shrinking returns. QUALCOMM remains better equipped to defend market share amid intensifying industry competition.
Which stock offers better returns?
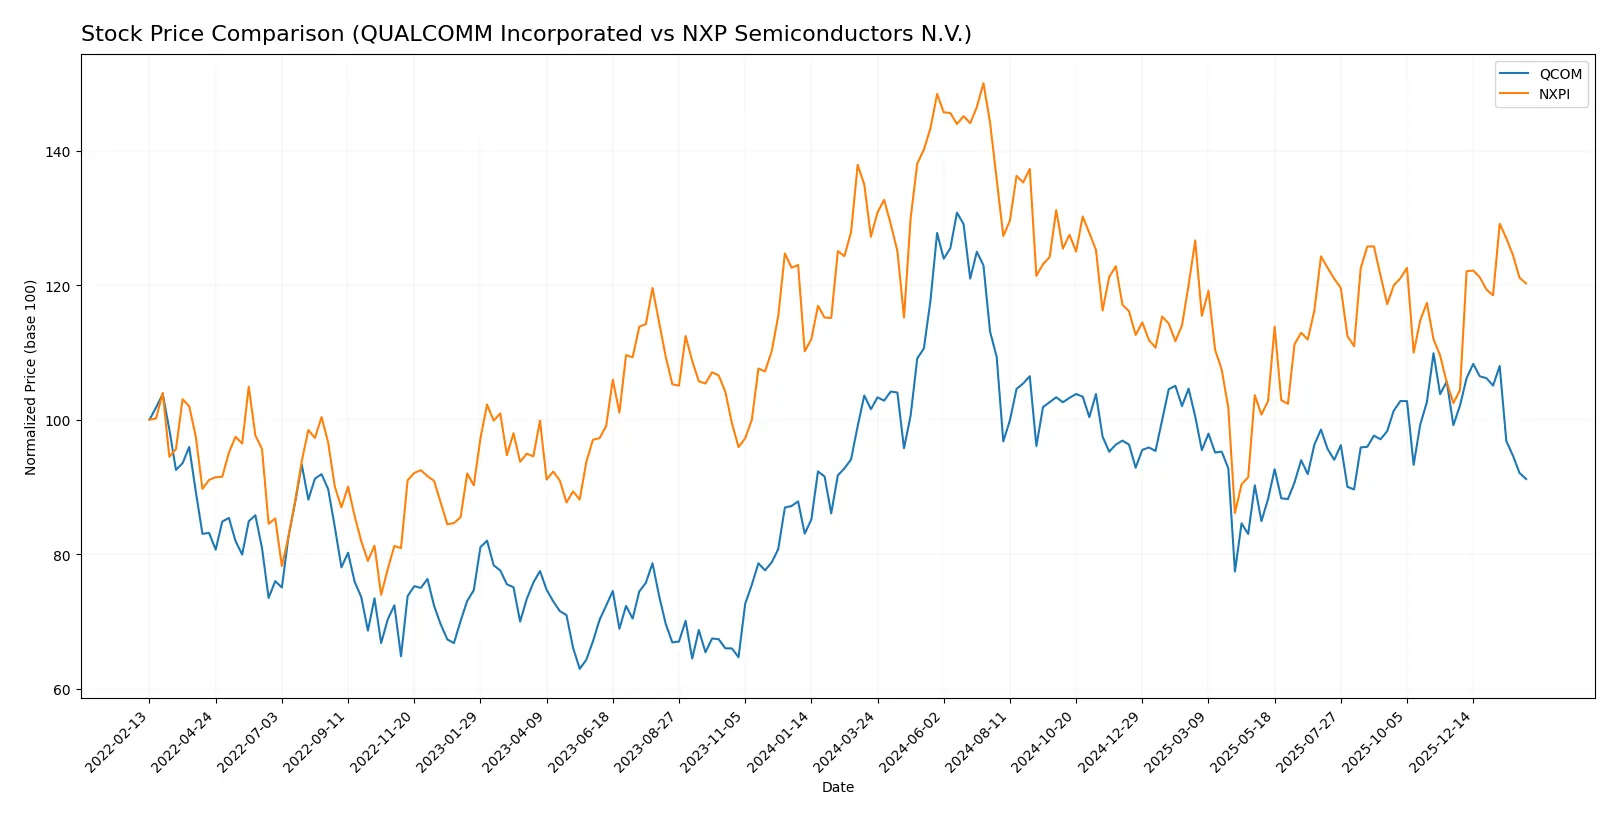
The past year shows contrasting price dynamics for QUALCOMM and NXP Semiconductors, with QCOM trending downward steadily, while NXPI exhibits recent strong upward momentum despite an overall decline.
Trend Comparison
QUALCOMM’s stock declined 10.23% over the past 12 months, signaling a bearish trend with deceleration and a high volatility of 16.23%. The stock peaked at 215.33 and troughed at 127.46.
NXP Semiconductors fell 5.46% overall in the same period, marking a bearish but accelerating trend. Volatility is higher at 24.1%, with a recent sharp 17.36% gain indicating strong recovery momentum.
Comparing both, NXPI delivered superior market performance recently and less severe overall losses, outperforming QCOM over the past year despite both stocks facing bearish pressure.
Target Prices
Analysts project solid upside potential for QUALCOMM Incorporated and NXP Semiconductors N.V. over the next 12 months.
| Company | Target Low | Target High | Consensus |
|---|---|---|---|
| QUALCOMM Incorporated | 160 | 210 | 181.43 |
| NXP Semiconductors N.V. | 215 | 280 | 250 |
QUALCOMM’s consensus target of $181.43 suggests a 21% upside from its current $150 price. NXP’s $250 target implies a 11% gain from $224, reflecting bullish sentiment on both semiconductor leaders.

Don’t Let Luck Decide Your Entry Point
Optimize your entry points with our advanced ProRealTime indicators. You’ll get efficient buy signals with precise price targets for maximum performance. Start outperforming now!
How do institutions grade them?
QUALCOMM Incorporated Grades
The following table summarizes recent institutional grades for QUALCOMM Incorporated:
| Grading Company | Action | New Grade | Date |
|---|---|---|---|
| Cantor Fitzgerald | Maintain | Neutral | 2026-02-02 |
| Mizuho | Maintain | Neutral | 2026-01-26 |
| UBS | Maintain | Neutral | 2026-01-26 |
| Mizuho | Downgrade | Neutral | 2026-01-09 |
| Wells Fargo | Maintain | Underweight | 2025-11-06 |
| Piper Sandler | Maintain | Overweight | 2025-11-06 |
| UBS | Maintain | Neutral | 2025-11-06 |
| Mizuho | Maintain | Outperform | 2025-11-06 |
| Rosenblatt | Maintain | Buy | 2025-11-06 |
| B of A Securities | Maintain | Buy | 2025-11-06 |
NXP Semiconductors N.V. Grades
Recent institutional grades for NXP Semiconductors N.V. are detailed in the table below:
| Grading Company | Action | New Grade | Date |
|---|---|---|---|
| Evercore ISI Group | Maintain | Outperform | 2026-02-04 |
| B of A Securities | Maintain | Buy | 2026-02-04 |
| Truist Securities | Maintain | Buy | 2026-02-04 |
| Mizuho | Maintain | Outperform | 2026-02-04 |
| Citigroup | Maintain | Buy | 2026-02-04 |
| JP Morgan | Maintain | Neutral | 2026-02-04 |
| Needham | Maintain | Buy | 2026-02-03 |
| Citigroup | Maintain | Buy | 2026-01-15 |
| Wells Fargo | Maintain | Overweight | 2026-01-15 |
| Truist Securities | Maintain | Buy | 2025-12-19 |
Which company has the best grades?
NXP Semiconductors consistently receives higher grades, mostly Buy and Outperform, compared to QUALCOMM’s mixed Neutral and Underweight ratings. This suggests stronger institutional confidence in NXP’s near-term prospects, potentially influencing investor sentiment positively.
Risks specific to each company
The following categories identify the critical pressure points and systemic threats facing both QUALCOMM Incorporated and NXP Semiconductors N.V. in the 2026 market environment:
1. Market & Competition
QUALCOMM Incorporated
- Strong position in wireless tech licensing with high barriers to entry. Faces intense competition in 5G chipsets.
NXP Semiconductors N.V.
- Diverse semiconductor portfolio with automotive and IoT focus. Competitive pressures from larger players and evolving tech trends.
2. Capital Structure & Debt
QUALCOMM Incorporated
- Moderate debt-to-equity (0.7), strong interest coverage (20x). Capital structure supports growth with relatively low financial risk.
NXP Semiconductors N.V.
- Higher leverage (debt-to-equity 1.22) increases financial risk despite adequate interest coverage (8x). Debt burden is a key vulnerability.
3. Stock Volatility
QUALCOMM Incorporated
- Beta of 1.24 indicates moderate volatility, aligned with sector norms.
NXP Semiconductors N.V.
- Higher beta (1.46) suggests greater price swings and sensitivity to market shocks.
4. Regulatory & Legal
QUALCOMM Incorporated
- Faces ongoing scrutiny over licensing practices and antitrust investigations globally.
NXP Semiconductors N.V.
- Exposed to EU and U.S. export controls and semiconductor trade regulations, impacting supply and sales.
5. Supply Chain & Operations
QUALCOMM Incorporated
- Relies on complex global suppliers but maintains strong operational execution and innovation pipeline.
NXP Semiconductors N.V.
- Supply chain exposed to geopolitical tensions, particularly in Asia, affecting production continuity.
6. ESG & Climate Transition
QUALCOMM Incorporated
- Advancing sustainability initiatives with focus on energy-efficient products and reduced carbon footprint.
NXP Semiconductors N.V.
- Strong ESG commitment but faces challenges integrating climate transition costs into capital planning.
7. Geopolitical Exposure
QUALCOMM Incorporated
- Significant exposure to U.S.-China tensions impacting licensing and sales in China.
NXP Semiconductors N.V.
- Broader multinational footprint raises risks amid EU-U.S.-China trade frictions and sanctions regimes.
Which company shows a better risk-adjusted profile?
QUALCOMM’s moderate leverage and strong interest coverage underpin a more resilient capital structure. Its leading IP licensing business offers a moat against competition despite regulatory risks. NXP’s higher debt and supply chain vulnerabilities raise caution. The most impactful risk for QUALCOMM is regulatory scrutiny on licensing, while for NXP it is capital structure strain amid geopolitical and operational pressures. QUALCOMM’s Altman Z-score of 5.98 and Piotroski score of 7 reflect stronger financial health compared to NXP’s safer but more fragile profile. Recent data show QUALCOMM’s superior interest coverage (20x vs. 8x) justifies my confidence in its risk-adjusted resilience.
Final Verdict: Which stock to choose?
QUALCOMM’s superpower lies in its unmatched capital efficiency and robust cash generation. It consistently creates value by earning returns well above its cost of capital. A point of vigilance is its declining profitability trend, which could pressure margins. QUALCOMM suits portfolios seeking aggressive growth backed by strong operational leverage.
NXP Semiconductors boasts a strategic moat through its solid recurring revenue and niche market positioning. While it trails QUALCOMM in capital efficiency, it offers relatively steadier income growth and less valuation premium. This stock fits well in GARP portfolios aiming for balanced growth with moderate risk exposure.
If you prioritize superior capital returns and strong free cash flow, QUALCOMM is the compelling choice due to its economic moat and cash conversion prowess. However, if you seek more stability with consistent revenue streams and a modest valuation, NXP offers better stability despite a weaker moat and profitability trend. Both present analytical scenarios worth considering, aligned to distinct investor profiles.
Disclaimer: Investment carries a risk of loss of initial capital. The past performance is not a reliable indicator of future results. Be sure to understand risks before making an investment decision.
Go Further
I encourage you to read the complete analyses of QUALCOMM Incorporated and NXP Semiconductors N.V. to enhance your investment decisions: