Home > Comparison > Technology > NXPI vs MCHP
The strategic rivalry between NXP Semiconductors N.V. and Microchip Technology Incorporated defines the trajectory of the semiconductor sector. NXP operates as a diversified, innovation-driven semiconductor leader, focusing on automotive and communication solutions. Microchip emphasizes embedded control and mixed-signal products with strong manufacturing integration. This analysis pits NXP’s growth-centric model against Microchip’s value-oriented approach, aiming to identify which offers superior risk-adjusted returns for a diversified portfolio.
Table of contents
Companies Overview
NXP Semiconductors and Microchip Technology are pivotal players in the semiconductor industry, shaping embedded control innovation globally.
NXP Semiconductors N.V.: Advanced Semiconductor Solutions Leader
NXP Semiconductors specializes in diverse semiconductor products including microcontrollers, application processors, and wireless connectivity solutions. Its revenue primarily stems from supplying automotive, industrial IoT, mobile, and communication infrastructure sectors. In 2026, NXP focuses strategically on expanding its portfolio of secure, high-performance processors and sensors to capitalize on growing demand in automotive and IoT markets.
Microchip Technology Incorporated: Embedded Control Innovator
Microchip Technology develops and sells embedded control solutions with a broad range of microcontrollers, microprocessors, and analog products. Its core revenue comes from automotive, industrial, and communication applications worldwide. In 2026, the company emphasizes enhancing its secure, connected microcontroller offerings and expanding its development tool ecosystem to support diverse customer needs and accelerate adoption.
Strategic Collision: Similarities & Divergences
Both firms compete fiercely in embedded control and connectivity, yet NXP leans toward a broader product portfolio with a strong automotive focus, while Microchip prioritizes microcontroller specialization and development tools. Their battleground centers on the expanding IoT and automotive electronics markets. Investors face distinct profiles: NXP’s scale and innovation breadth contrast with Microchip’s niche expertise and customer-centric platform approach.
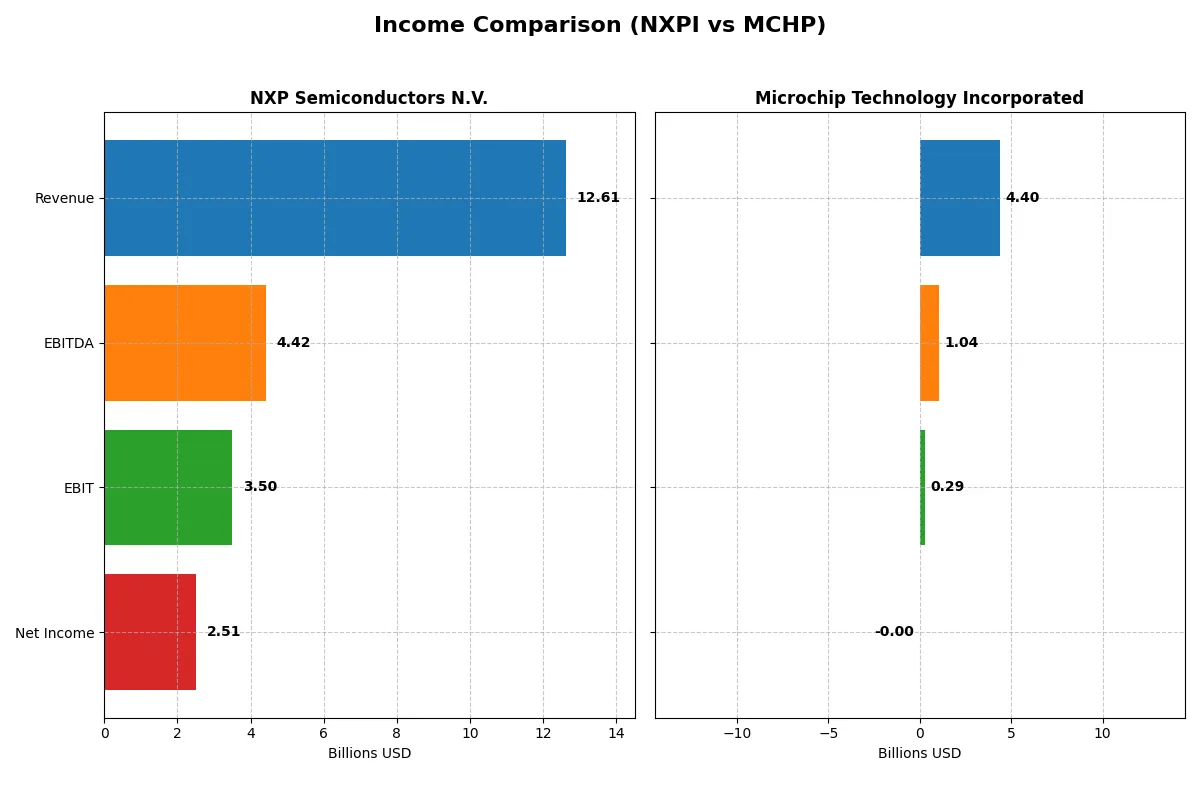
Income Statement Comparison
This data dissects the core profitability and scalability of both corporate engines to reveal who dominates the bottom line:
| Metric | NXP Semiconductors N.V. (NXPI) | Microchip Technology Incorporated (MCHP) |
|---|---|---|
| Revenue | 12.6B | 4.4B |
| Cost of Revenue | 5.5B | 1.9B |
| Operating Expenses | 3.7B | 2.2B |
| Gross Profit | 7.1B | 2.5B |
| EBITDA | 4.4B | 1.0B |
| EBIT | 3.5B | 0.3B |
| Interest Expense | 0.4B | 0.3B |
| Net Income | 2.5B | -0.5M |
| EPS | 9.84 | -0.005 |
| Fiscal Year | 2024 | 2025 |
Income Statement Analysis: The Bottom-Line Duel
This income statement comparison reveals which company runs its business model with greater efficiency and sustainability in profitability.
NXP Semiconductors N.V. Analysis
NXP’s revenue grew by 46% from 2020 to 2024, reaching $12.6B in 2024, despite a slight 5% dip from 2023. Net income surged over 4700% across the period, landing at $2.51B in 2024. Gross and net margins remain robust at 56.4% and 19.9%, signaling strong cost control and operational efficiency, even amid recent margin pressure.
Microchip Technology Incorporated Analysis
Microchip’s revenue declined nearly 20% over 2021-2025, dropping sharply to $4.4B in 2025. The company swung to a net loss of $2.7M in 2025, a steep deterioration from prior profits. While its gross margin holds steady near 56%, weak EBIT and net margins reflect operational challenges and eroding profitability, highlighting a fragile bottom line.
Margin Strength vs. Revenue Resilience
NXP clearly outperforms Microchip on both scale and profitability metrics. NXP’s sizable revenue base and expanding net income with healthy margins contrast sharply with Microchip’s shrinking revenues and net losses. For investors prioritizing consistent earnings and margin stability, NXP presents a more attractive fundamental profile.
Financial Ratios Comparison
These vital ratios act as a diagnostic tool to expose the underlying fiscal health, valuation premiums, and capital efficiency of the companies compared below:
| Ratios | NXP Semiconductors N.V. (NXPI) | Microchip Technology Inc. (MCHP) |
|---|---|---|
| ROE | 27.33% | -0.007% |
| ROIC | 12.91% | -0.027% |
| P/E | 21.13 | -52021 |
| P/B | 5.78 | 3.67 |
| Current Ratio | 2.36 | 2.59 |
| Quick Ratio | 1.60 | 1.47 |
| D/E | 1.18 | 0.80 |
| Debt-to-Assets | 44.51% | 36.85% |
| Interest Coverage | 8.59 | 1.18 |
| Asset Turnover | 0.52 | 0.29 |
| Fixed Asset Turnover | 3.86 | 3.72 |
| Payout ratio | 41.35% | -1951.4% |
| Dividend yield | 1.96% | 3.75% |
| Fiscal Year | 2024 | 2025 |
Efficiency & Valuation Duel: The Vital Signs
Financial ratios serve as a company’s DNA, exposing hidden risks and operational strengths crucial for investment decisions.
NXP Semiconductors N.V.
NXP shows strong profitability with a 27.33% ROE and a solid 19.9% net margin, reflecting operational efficiency. Its P/E of 21.13 signals a fairly priced stock, though a high P/B ratio of 5.78 flags valuation concerns. The firm sustains shareholder value through a 1.96% dividend yield and reinvests heavily in R&D.
Microchip Technology Incorporated
Microchip reports negative profitability with ROE and net margin near zero, indicating operational struggles. Its P/E is anomalous but the P/B of 3.67 suggests moderate valuation. The company offers a generous 3.75% dividend yield despite weak returns, reflecting a focus on shareholder income over growth or reinvestment.
Premium Valuation vs. Operational Safety
NXP balances robust profitability with a reasonable valuation, offering operational safety alongside modest shareholder returns. Microchip’s metrics reveal significant risk with weak earnings but higher dividend income. Investors prioritizing growth and operational strength may prefer NXP, while income-focused profiles might consider Microchip’s yield despite its risks.
Which one offers the Superior Shareholder Reward?
I see NXP Semiconductors (NXPI) offers a balanced distribution with a 1.96% dividend yield and a 41% payout ratio, well-covered by strong free cash flow (FCF). NXPI also executes substantial buybacks, enhancing total shareholder return. Microchip Technology (MCHP) yields higher at 3.75%, but its payout ratio is erratic, even negative recently, signaling sustainability risks. MCHP’s buyback intensity is lower and less consistent. Historically, NXPI’s steady dividends plus aggressive buybacks signal a more sustainable, shareholder-friendly capital allocation. For 2026, I favor NXPI for superior total return potential and distribution durability.
Comparative Score Analysis: The Strategic Profile
The radar chart reveals the fundamental DNA and trade-offs of both firms, highlighting their financial strengths and valuation dynamics:
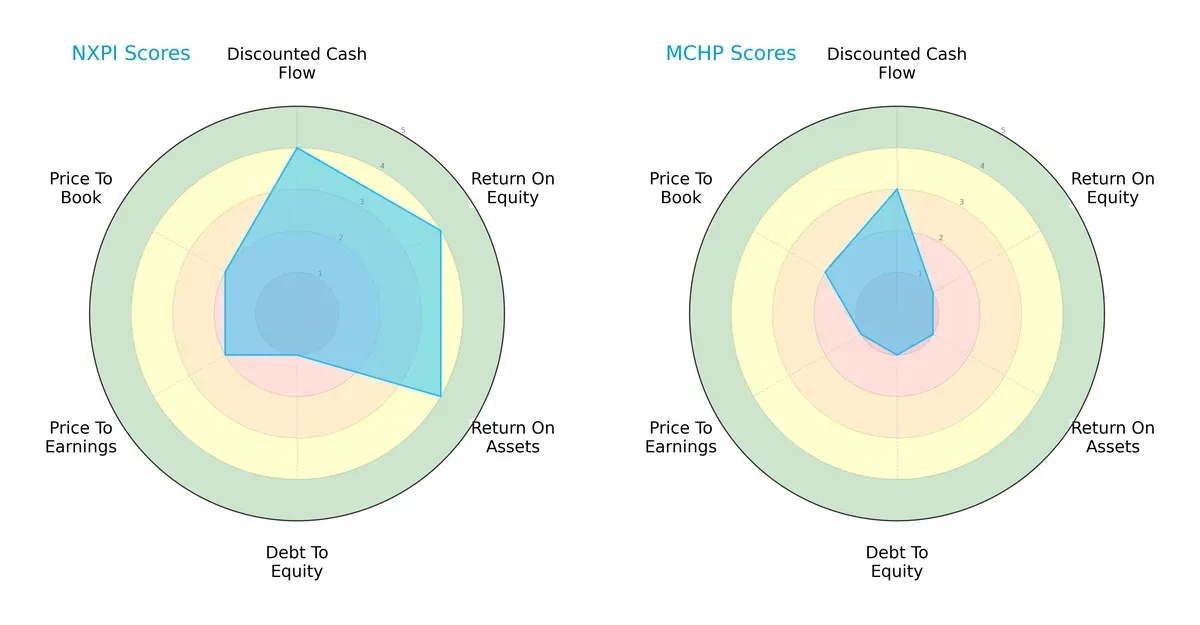
NXP Semiconductors delivers a balanced profile with strong DCF, ROE, and ROA scores, signaling efficient capital use and profitability. However, its weak debt-to-equity score flags financial risk. Microchip Technology shows uniformly low profitability and valuation scores, indicating struggles beyond leverage. NXP relies on operational excellence, while Microchip lacks a clear competitive edge.
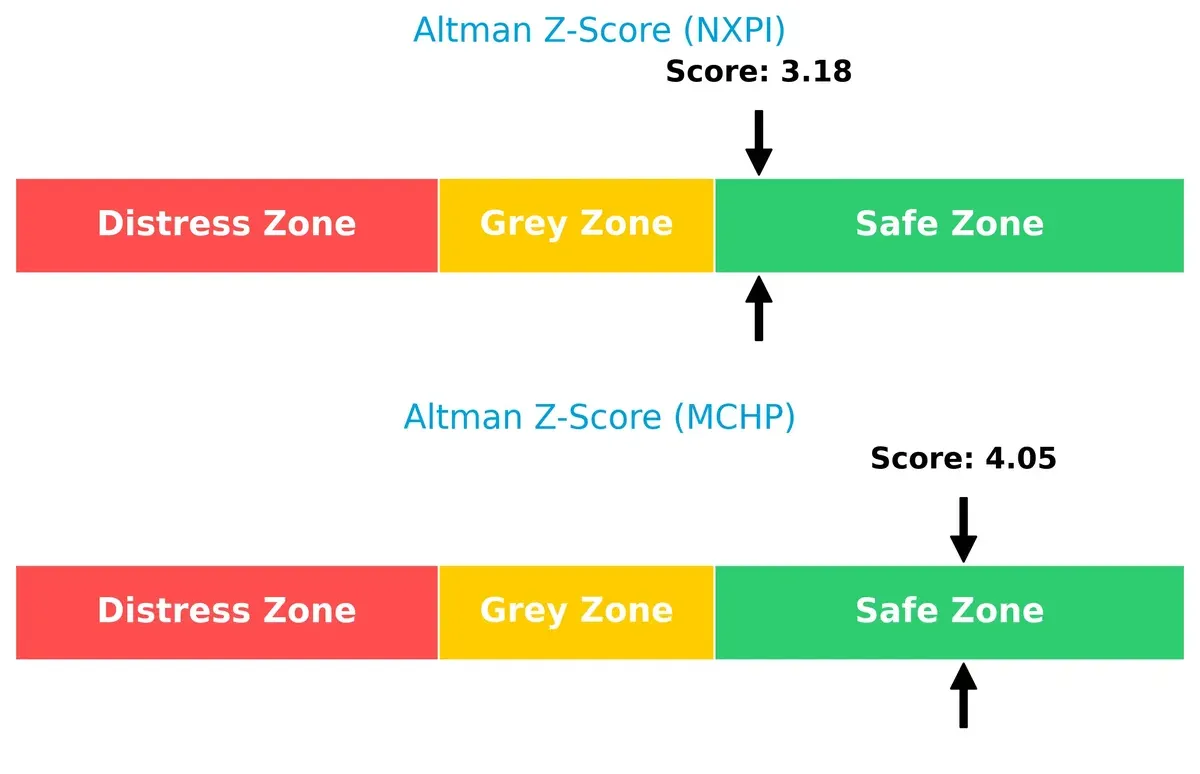
Bankruptcy Risk: Solvency Showdown
NXP’s Altman Z-Score at 3.18 versus Microchip’s 4.05 suggests both firms reside safely above bankruptcy risk, but Microchip holds a more secure solvency position in this cycle:
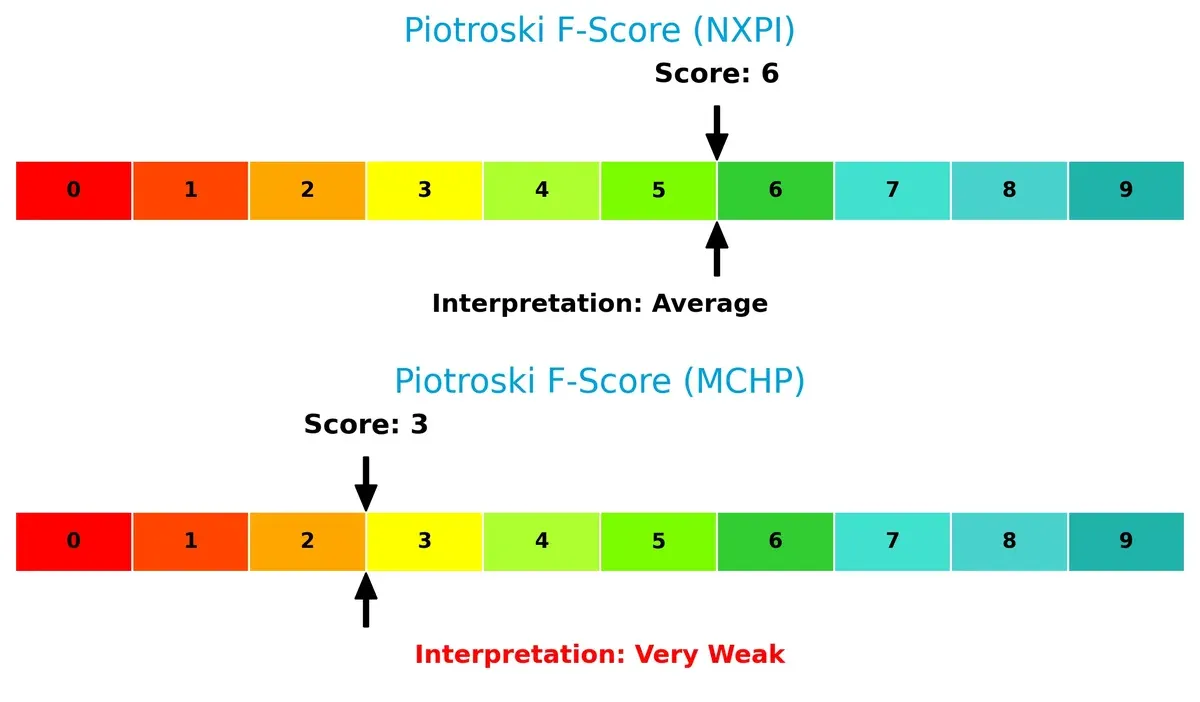
Financial Health: Quality of Operations
NXP’s Piotroski F-Score of 6 indicates average financial health, outperforming Microchip’s weak score of 3, which signals red flags in internal operations and potential value traps:
How are the two companies positioned?
This section dissects the operational DNA of NXP and Microchip by comparing their revenue distribution and internal dynamics. The goal is to confront their economic moats and identify which model offers the most durable competitive edge today.
Revenue Segmentation: The Strategic Mix
This visual comparison dissects how NXP Semiconductors N.V. and Microchip Technology Incorporated diversify their income streams and where their primary sector bets lie:
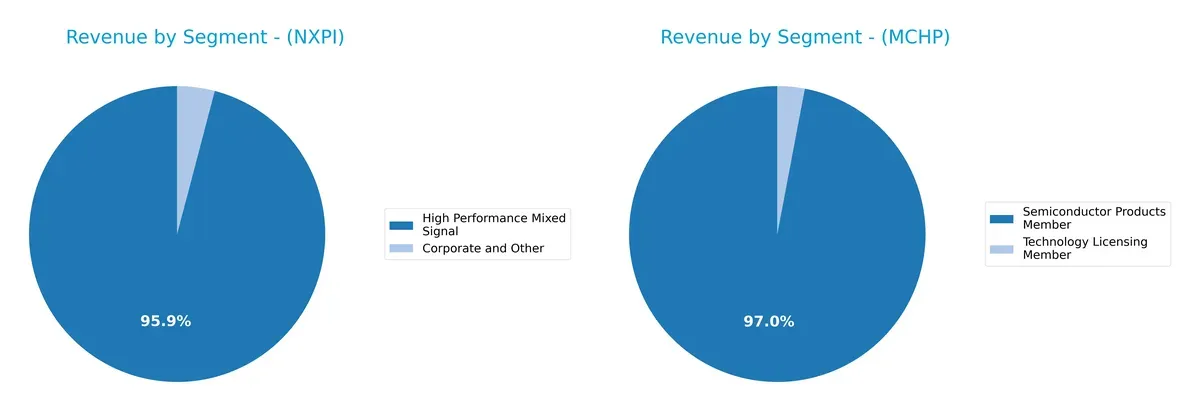
NXP Semiconductors anchors its revenue heavily on High Performance Mixed Signal, generating $9B in 2018, dwarfing its Corporate and Other segment at $385M. Microchip Technology pivots around Semiconductor Products, with $4.3B in 2025, and a minimal Technology Licensing contribution of $131M. NXP’s concentration suggests ecosystem lock-in, while Microchip’s reliance on one segment signals potential concentration risk but also infrastructure dominance in semiconductors.
Strengths and Weaknesses Comparison
This table compares the Strengths and Weaknesses of NXP Semiconductors N.V. and Microchip Technology Incorporated:
NXP Semiconductors Strengths
- Strong profitability with 19.9% net margin
- Robust ROE at 27.33%
- Favorable ROIC above WACC
- Solid liquidity ratios above 1.4
- High fixed asset turnover at 3.86
- Diverse global revenue exposure including China and US
Microchip Technology Strengths
- Favorable P/E ratio despite negative earnings
- Higher current ratio at 2.59 supports liquidity
- Dividend yield of 3.75% attractive for income
- Moderate debt-to-equity ratio at 0.8
- Favorable fixed asset turnover at 3.72
- Stable semiconductor product revenues
NXP Semiconductors Weaknesses
- Elevated price-to-book ratio at 5.78 signals premium valuation
- Debt-to-equity at 1.18 indicates higher leverage
- Moderate asset turnover at 0.52 limits efficiency
- Neutral WACC at 9.46% limits capital advantage
- Limited product segment diversification beyond mixed signal
Microchip Technology Weaknesses
- Negative profitability metrics with net margin and ROE near zero
- Low interest coverage ratio at 1.15 risks solvency
- Unfavorable asset turnover at 0.29 signals underutilization
- Higher proportion of unfavorable financial ratios
- Reliance on semiconductor products with limited geographic diversification
NXP Semiconductors shows clear strengths in profitability, liquidity, and global footprint, but faces valuation and leverage concerns. Microchip Technology struggles with profitability and efficiency yet offers attractive dividend yield and reasonable liquidity. These contrasts highlight different strategic challenges and financial profiles within the semiconductor industry.
The Moat Duel: Analyzing Competitive Defensibility
A structural moat is the only thing protecting long-term profits from relentless competition and margin erosion. Let’s dissect the competitive advantages of two semiconductor giants:
NXP Semiconductors N.V.: Innovation and Scale Lock-in
NXP leverages a robust blend of intangible assets and network effects, evident in its 27.7% EBIT margin and growing ROIC exceeding WACC by 3.5%. Its automotive and IoT leadership deepens its moat in 2026.
Microchip Technology Incorporated: Cost-Driven Niche Focus
Microchip relies primarily on cost advantage in embedded control markets but suffers from declining ROIC and negative net margins. Its shrinking footprint contrasts sharply with NXP’s growth prospects and margin stability.
Moat Strength: Innovation Leadership vs. Cost Pressure
NXP’s widening moat, driven by innovation and scale, vastly outpaces Microchip’s shrinking cost-based moat. NXP is better positioned to defend and grow market share amid increasing semiconductor complexity.
Which stock offers better returns?
Stock prices of NXP Semiconductors N.V. and Microchip Technology Incorporated have shown divergent trends over the past year, with notable price swings and shifting trading volumes.
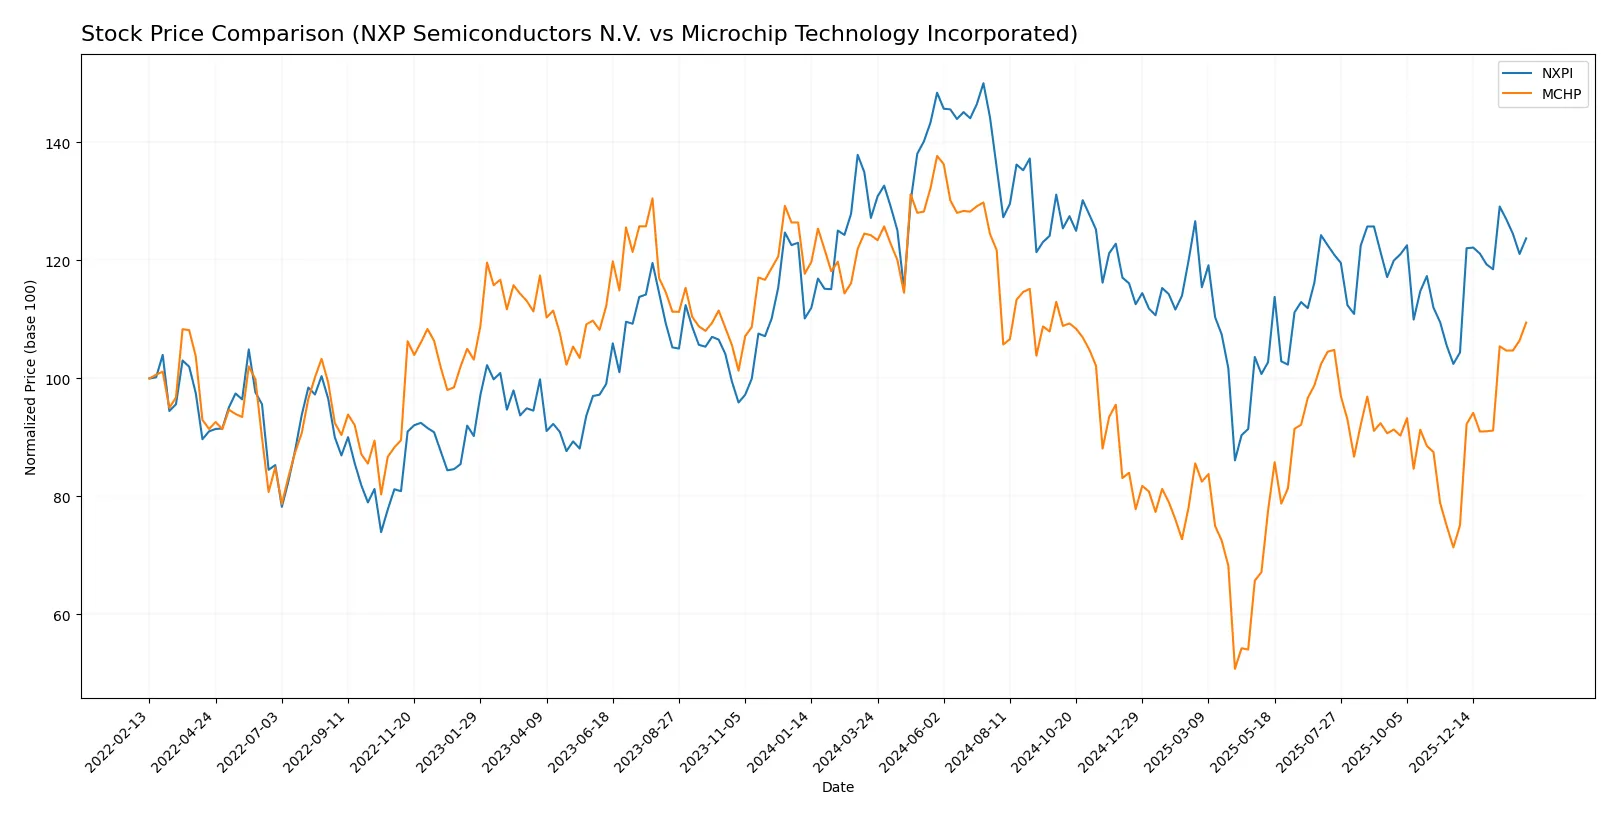
Trend Comparison
NXP Semiconductors N.V. declined 2.72% over the past 12 months, marking a bearish trend with accelerating downward momentum. The stock traded between 160.81 and 280.19, showing high volatility (24.1 std dev).
Microchip Technology Incorporated fell 11.91% over the same period, a clear bearish trend with accelerating losses. Its price ranged from 36.22 to 98.23, exhibiting lower volatility (14.14 std dev) compared to NXP.
Comparing recent momentum, Microchip outperformed NXP with a 53.4% gain versus NXP’s 20.76% from November 2025 to February 2026, delivering the highest market performance in that interval.
Target Prices
Analysts present a cautiously optimistic consensus for these semiconductor leaders.
| Company | Target Low | Target High | Consensus |
|---|---|---|---|
| NXP Semiconductors N.V. | 215 | 280 | 242.5 |
| Microchip Technology Incorporated | 60 | 100 | 82.46 |
NXP’s consensus target of 242.5 exceeds its current price of 231, signaling moderate upside potential. Microchip’s target consensus at 82.46 also suggests room for appreciation from its 78.08 price, reflecting steady analyst confidence.

Don’t Let Luck Decide Your Entry Point
Optimize your entry points with our advanced ProRealTime indicators. You’ll get efficient buy signals with precise price targets for maximum performance. Start outperforming now!
How do institutions grade them?
The latest institutional grades for NXP Semiconductors N.V. and Microchip Technology Incorporated are as follows:
NXP Semiconductors N.V. Grades
The table below summarizes recent grades from major financial institutions for NXP Semiconductors N.V.:
| Grading Company | Action | New Grade | Date |
|---|---|---|---|
| Wells Fargo | Maintain | Overweight | 2026-01-15 |
| Citigroup | Maintain | Buy | 2026-01-15 |
| Truist Securities | Maintain | Buy | 2025-12-19 |
| Truist Securities | Maintain | Buy | 2025-10-29 |
| JP Morgan | Maintain | Neutral | 2025-10-29 |
| Truist Securities | Maintain | Buy | 2025-07-23 |
| Susquehanna | Maintain | Neutral | 2025-07-23 |
| Wells Fargo | Maintain | Overweight | 2025-07-23 |
| JP Morgan | Maintain | Neutral | 2025-07-23 |
| Needham | Maintain | Buy | 2025-07-22 |
Microchip Technology Incorporated Grades
Recent grades from reputable financial firms for Microchip Technology Incorporated are detailed below:
| Grading Company | Action | New Grade | Date |
|---|---|---|---|
| Cantor Fitzgerald | Maintain | Overweight | 2026-02-02 |
| UBS | Maintain | Buy | 2026-01-26 |
| Susquehanna | Maintain | Positive | 2026-01-22 |
| B of A Securities | Maintain | Neutral | 2026-01-21 |
| Citigroup | Maintain | Buy | 2026-01-15 |
| Piper Sandler | Maintain | Overweight | 2026-01-15 |
| B. Riley Securities | Maintain | Buy | 2026-01-12 |
| Mizuho | Maintain | Outperform | 2026-01-09 |
| Wells Fargo | Maintain | Equal Weight | 2026-01-07 |
| JP Morgan | Maintain | Overweight | 2026-01-06 |
Which company has the best grades?
Microchip Technology Incorporated generally receives higher and more diverse positive ratings, including “Outperform” and multiple “Overweight” grades. NXP Semiconductors N.V. shows consistent “Buy” and “Overweight” ratings but also several “Neutral” grades. Investors might perceive Microchip’s broader positive sentiment as a stronger institutional confidence signal.
Risks specific to each company
The following categories identify the critical pressure points and systemic threats facing both firms in the 2026 market environment:
1. Market & Competition
NXP Semiconductors N.V.
- Strong market presence in automotive and IoT segments; intense competition in semiconductors.
Microchip Technology Incorporated
- Diverse embedded solutions but faces fierce competition and margin pressure in general microcontroller markets.
2. Capital Structure & Debt
NXP Semiconductors N.V.
- High debt-to-equity ratio at 1.18 signals leveraged balance sheet and higher financial risk.
Microchip Technology Incorporated
- Moderate leverage with debt-to-equity at 0.8; better debt management but interest coverage is weak.
3. Stock Volatility
NXP Semiconductors N.V.
- Beta of 1.458 indicates above-market volatility, typical for semiconductor cyclicality.
Microchip Technology Incorporated
- Similar beta at 1.438, reflecting comparable market sensitivity and sector risk.
4. Regulatory & Legal
NXP Semiconductors N.V.
- Exposure to cross-border regulations, especially in China and Europe; technology export controls risk.
Microchip Technology Incorporated
- U.S.-based with regulatory scrutiny focused on domestic and international trade compliance.
5. Supply Chain & Operations
NXP Semiconductors N.V.
- Global footprint with complex supply chains; risks from geopolitical tensions and component shortages.
Microchip Technology Incorporated
- Heavy reliance on foundry services; supply chain disruptions can impact production and delivery cycles.
6. ESG & Climate Transition
NXP Semiconductors N.V.
- Increasing pressure to meet sustainability targets; semiconductor manufacturing is energy-intensive.
Microchip Technology Incorporated
- Emerging ESG initiatives but lagging in comprehensive climate transition plans compared to peers.
7. Geopolitical Exposure
NXP Semiconductors N.V.
- Significant operations in China and Europe increase geopolitical risk amid trade tensions.
Microchip Technology Incorporated
- Primarily U.S.-focused but global sales expose it to tariffs and sanctions risks.
Which company shows a better risk-adjusted profile?
NXP’s highest risk is its leveraged capital structure, raising financial vulnerability despite solid profitability. Microchip’s main risk lies in operational weaknesses and poor profitability metrics. Overall, NXP presents a better risk-adjusted profile supported by stronger financial scores and safer Altman Z-Score, while Microchip’s negative margins and weak interest coverage flag caution. Recent data shows NXP’s interest coverage at 8.79, compared to Microchip’s precarious 1.15, underscoring financial resilience differences.
Final Verdict: Which stock to choose?
NXP Semiconductors N.V. (NXPI) impresses with its durable competitive advantage and efficient capital use, driving consistent value creation. Its superpower lies in a strong economic moat supported by growing ROIC well above WACC. A point of vigilance is the elevated debt-to-equity ratio, which demands close monitoring. NXPI suits portfolios targeting aggressive growth with a tolerance for leverage risk.
Microchip Technology Incorporated (MCHP) stands out for its niche in embedded control solutions, offering strategic moat through specialized R&D. Relative to NXPI, it presents a safer balance sheet with a higher current ratio but suffers from declining profitability and value destruction. MCHP fits more conservative GARP portfolios seeking potential turnaround plays with cautious risk appetite.
If you prioritize sustainable value creation and operational efficiency, NXPI is the compelling choice due to its very favorable moat and strong income profile. However, if you seek defensive exposure with a focus on specialized product niches, MCHP offers better stability despite weaker profitability trends and higher risk of value erosion. Both scenarios require careful risk management aligned with individual investment goals.
Disclaimer: Investment carries a risk of loss of initial capital. The past performance is not a reliable indicator of future results. Be sure to understand risks before making an investment decision.
Go Further
I encourage you to read the complete analyses of NXP Semiconductors N.V. and Microchip Technology Incorporated to enhance your investment decisions: