Home > Analyses > Technology > Electronic Arts Inc.
Electronic Arts shapes how millions experience digital entertainment, bringing immersive worlds to life across consoles, PCs, and mobile devices. Its flagship franchises—FIFA, Madden NFL, Apex Legends—dominate global gaming culture with innovation and quality. Renowned for blending cutting-edge technology with compelling storytelling, EA remains a powerhouse in a fiercely competitive industry. The critical question is whether its robust fundamentals can sustain growth amid evolving market dynamics and rising consumer expectations.

Table of contents
Business Model & Company Overview
Electronic Arts Inc., founded in 1982 and headquartered in Redwood City, California, stands as a leader in the electronic gaming and multimedia industry. Its portfolio weaves together iconic franchises like Battlefield, The Sims, and Apex Legends into a cohesive entertainment ecosystem. EA’s mission revolves around creating immersive, diverse gaming experiences across consoles, PCs, and mobile devices, solidifying its dominant market position.
The company’s revenue engine balances game development, digital distribution, and licensing. EA monetizes through a mix of upfront game sales, recurring in-game purchases, and licensed content, reaching consumers across the Americas, Europe, and Asia. This blend fosters a resilient cash flow and global footprint. EA’s deep intellectual property portfolio and digital-first approach build a formidable economic moat, shaping the future of interactive entertainment.
Financial Performance & Fundamental Metrics
I will analyze Electronic Arts Inc.’s income statement, key financial ratios, and dividend payout policy to assess its overall financial health in 2026.
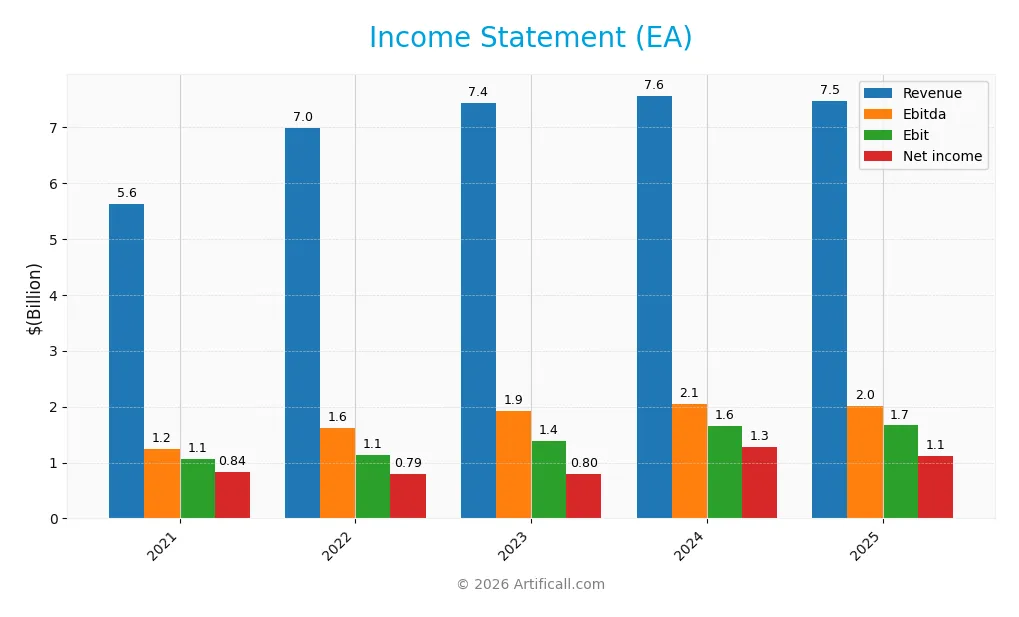
Income Statement
The table below presents Electronic Arts Inc.’s key income statement figures for fiscal years 2021 through 2025, highlighting revenue, profitability, and earnings per share.
| 2021 | 2022 | 2023 | 2024 | 2025 | |
|---|---|---|---|---|---|
| Revenue | 5.63B | 6.99B | 7.43B | 7.56B | 7.46B |
| Cost of Revenue | 1.49B | 1.86B | 1.79B | 1.71B | 1.54B |
| Operating Expenses | 3.09B | 4.00B | 4.30B | 4.33B | 4.40B |
| Gross Profit | 4.14B | 5.13B | 5.63B | 5.85B | 5.92B |
| EBITDA | 1.24B | 1.63B | 1.92B | 2.05B | 2.02B |
| EBIT | 1.06B | 1.14B | 1.38B | 1.65B | 1.66B |
| Interest Expense | 45M | 58M | 58M | 58M | 58M |
| Net Income | 837M | 789M | 802M | 1.27B | 1.12B |
| EPS | 2.90 | 2.78 | 2.90 | 4.71 | 4.28 |
| Filing Date | 2021-05-26 | 2022-05-25 | 2023-05-24 | 2024-05-22 | 2025-05-13 |
Income Statement Evolution
From 2021 to 2025, Electronic Arts’ revenue grew 32.6%, signaling solid expansion. However, revenue dipped 1.3% in the latest year, reflecting some stall. Gross margin hovered near 79%, stable and favorable, while net margin showed a slight positive trend over the period. Earnings per share increased 47.4%, but declined 9.6% in the past year.
Is the Income Statement Favorable?
In 2025, EA posted $7.46B revenue and $1.12B net income, yielding a 15% net margin. The EBIT margin of 22.3% underscores operational efficiency. Interest expenses remain low at 0.78% of revenue, supporting profitability. Despite a recent dip in revenue and EPS, the income statement fundamentals appear generally favorable with consistent margin strength and healthy bottom-line results.
Financial Ratios
The following table summarizes key financial ratios for Electronic Arts Inc. over the last five fiscal years:
| Ratios | 2021 | 2022 | 2023 | 2024 | 2025 |
|---|---|---|---|---|---|
| Net Margin | 15% | 11% | 11% | 17% | 15% |
| ROE | 11% | 10% | 11% | 17% | 18% |
| ROIC | 8% | 8% | 8% | 12% | 11% |
| P/E | 47 | 46 | 42 | 28 | 34 |
| P/B | 5.0 | 4.7 | 4.6 | 4.8 | 5.9 |
| Current Ratio | 2.43 | 1.18 | 1.21 | 1.37 | 0.95 |
| Quick Ratio | 2.43 | 1.18 | 1.21 | 1.37 | 0.95 |
| D/E | 0.25 | 0.26 | 0.27 | 0.26 | 0.35 |
| Debt-to-Assets | 15% | 14% | 14% | 15% | 18% |
| Interest Coverage | 23 | 19 | 23 | 26 | 26 |
| Asset Turnover | 0.42 | 0.51 | 0.55 | 0.56 | 0.60 |
| Fixed Asset Turnover | 11.5 | 12.7 | 13.5 | 13.1 | 12.7 |
| Dividend Yield | 0.25% | 0.54% | 0.63% | 0.57% | 0.53% |
Evolution of Financial Ratios
Over the reviewed period, Electronic Arts’ Return on Equity (ROE) improved moderately, reaching 17.55% in 2025, signaling stronger profitability. The Current Ratio declined from a robust 2.43 in 2021 to 0.95 in 2025, indicating reduced short-term liquidity. The Debt-to-Equity Ratio rose slightly but remained moderate at 0.35, reflecting stable leverage management.
Are the Financial Ratios Fovorable?
In 2025, EA’s profitability metrics such as net margin (15.02%) and ROE (17.55%) were favorable, outperforming typical market benchmarks. Liquidity ratios showed mixed signals: a low current ratio (0.95) flagged caution, while the quick ratio was neutral. Leverage metrics, including debt-to-equity (0.35) and interest coverage (28.67x), were favorable. Market multiples (PE 33.78, PB 5.93) and dividend yield (0.53%) appeared unfavorable, balancing the overall favorable assessment.
Shareholder Return Policy
Electronic Arts Inc. maintains a consistent dividend policy with a payout ratio around 18%, offering a modest yield near 0.53%. The dividend per share has steadily increased, supported by strong free cash flow coverage and supplemented by share buybacks.
This balanced approach aligns with sustainable shareholder value creation. The company avoids excessive distributions or repurchases, preserving capital for growth while rewarding investors with dependable returns.
Score analysis
The following radar chart presents Electronic Arts Inc.’s fundamental and valuation scores across key financial metrics:
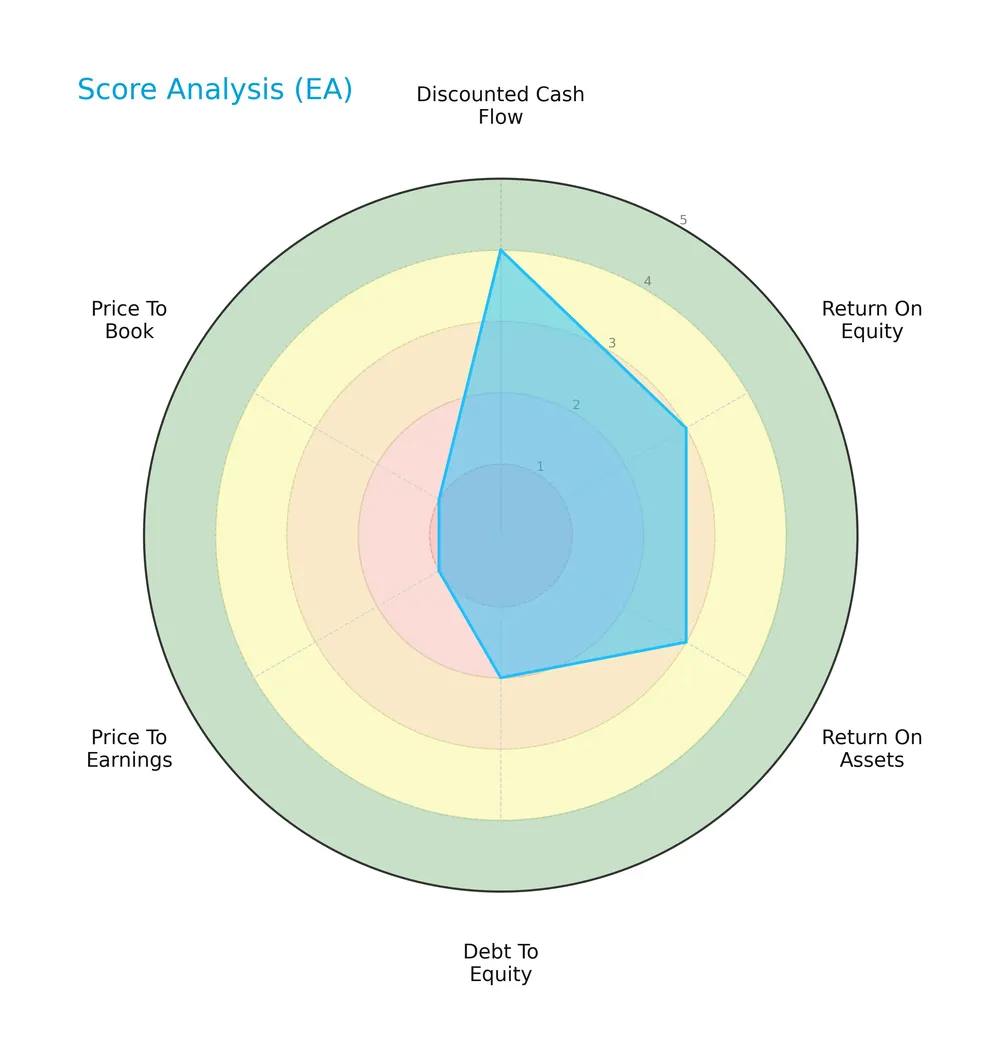
The discounted cash flow score stands favorable at 4, reflecting solid intrinsic value estimates. Return on equity and assets both show moderate scores of 3, indicating average profitability efficiency. Debt to equity rates moderate at 2, suggesting cautious leverage. Valuation metrics, price-to-earnings and price-to-book, score very unfavorable at 1, highlighting concerns about market pricing levels.
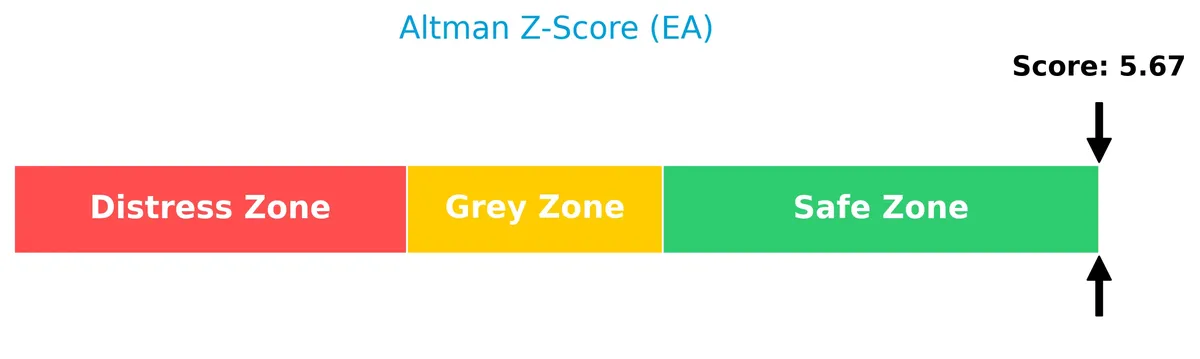
Analysis of the company’s bankruptcy risk
Electronic Arts Inc. sits comfortably in the safe zone for bankruptcy risk, supported by a robust Altman Z-Score of 5.67:
Is the company in good financial health?
The Piotroski Score diagram illustrates the company’s financial strength and operational efficiency:

With a strong score of 7, Electronic Arts demonstrates solid financial health. This suggests effective profitability, liquidity, and leverage management, positioning the company well above weak or average peers.
Competitive Landscape & Sector Positioning
This section examines Electronic Arts Inc.’s standing within the electronic gaming and multimedia sector. I will analyze its strategic positioning, revenue streams, product portfolio, and main competitors. The analysis aims to determine whether Electronic Arts maintains a competitive advantage in its industry.
Strategic Positioning
Electronic Arts focuses on diversified revenue streams, with live services generating $5.46B in 2025, surpassing full game downloads at $1.48B and packaged goods at $524M. Geographically, it balances exposure between international markets ($4.39B) and North America ($3.08B), underscoring a broad global footprint.
Revenue by Segment
The pie chart presents Electronic Arts Inc.’s revenue breakdown by product segment for fiscal year 2025, highlighting the composition of its gaming and service revenues.
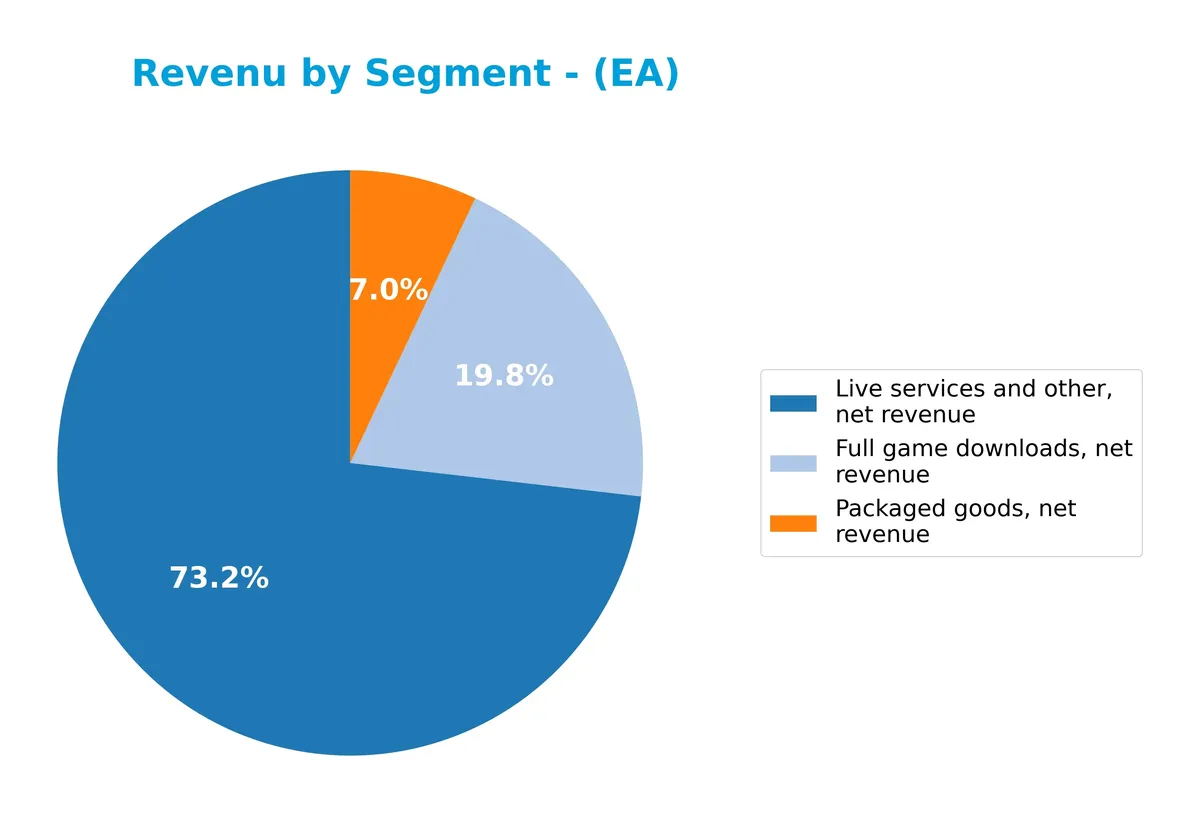
Live services and other revenue dominate with $5.46B, reflecting EA’s strong shift towards recurring monetization. Full game downloads contribute $1.48B, showing steady growth from prior years. Packaged goods, at $524M, continue to decline, evidencing a clear industry trend away from physical sales. The 2025 data confirms EA’s strategic focus on live services as its primary growth engine.
Key Products & Brands
The table below details Electronic Arts Inc.’s key products and brands with concise descriptions:
| Product | Description |
|---|---|
| Full Game Downloads | Digital sales of complete games for consoles, PCs, mobile phones, and tablets, driving significant net revenue. |
| Live Services and Other | Recurring revenue from online game services, in-game purchases, and subscriptions, a major growth driver. |
| Packaged Goods | Physical copies of games sold through retail channels, contributing a smaller but steady revenue portion. |
| Battlefield | Popular first-person shooter franchise developed and published by EA. |
| The Sims | Life simulation game series, a consistent performer in EA’s portfolio. |
| Apex Legends | Free-to-play battle royale game generating substantial live service revenue. |
| Need for Speed | Racing game franchise with a long market presence under EA’s brand. |
| Licensed Games: FIFA, Madden NFL, UFC, Star Wars | Games published under licenses from major sports and entertainment brands, expanding EA’s audience reach. |
Electronic Arts monetizes through digital full game downloads, live service offerings, and packaged goods. Its portfolio includes iconic franchises and licensed titles, balancing recurring revenue and traditional sales streams.
Main Competitors
Electronic Arts Inc. operates in a competitive field with 2 main players, listing the top 10 leaders by market capitalization:
| Competitor | Market Cap. |
|---|---|
| Electronic Arts Inc. | 51B |
| Take-Two Interactive Software, Inc. | 46B |
Electronic Arts ranks 1st among its competitors, holding a market cap just below the top leader benchmark at 97.5%. It stands above both the average market cap of the top 10 and the median sector value. The company’s market cap is 7% higher than its closest rival, highlighting a solid lead position.
Comparisons with competitors
Check out how we compare the company to its competitors:
Does EA have a competitive advantage?
Electronic Arts Inc. demonstrates a sustainable competitive advantage with a very favorable moat. Its ROIC exceeds WACC by 4.16%, signaling efficient capital use and value creation. The company maintains strong margins, including a gross margin of 79.3% and an EBIT margin of 22.3%, reflecting operational strength in the competitive gaming industry.
Looking ahead, EA’s portfolio spans popular franchises like Battlefield and The Sims, with licensed brands such as FIFA and Star Wars. Continued innovation across platforms and genres, along with expansion in international markets generating $4.39B in revenue in 2025, supports its growth opportunities amid evolving consumer preferences.
SWOT Analysis
This SWOT analysis highlights Electronic Arts Inc.’s core strategic factors to guide investment decisions.
Strengths
- strong brand portfolio
- high gross margin (79%)
- ROIC well above WACC
- favorable net margin (15%)
- robust interest coverage
- solid international revenue base
Weaknesses
- declining 1-year revenue growth (-1.3%)
- high valuation multiples (PE 33.8, PB 5.9)
- current ratio below 1 (0.95)
- dividend yield low (0.53%)
- recent net margin contraction (-10.8%)
Opportunities
- expanding digital distribution
- growth in mobile gaming
- licensing popular franchises
- international market expansion
- leveraging esports trends
Threats
- intense competition in gaming
- rapid tech changes
- regulatory risks in content
- currency fluctuations
- dependency on licensed IP
Electronic Arts demonstrates strong profitability and a sustainable competitive advantage. However, near-term revenue softness and valuation concerns require caution. Strategic focus should target digital growth and international markets while managing competitive and operational risks.
Stock Price Action Analysis
The following weekly stock chart illustrates Electronic Arts Inc.’s price movement and volatility over the last 12 months:
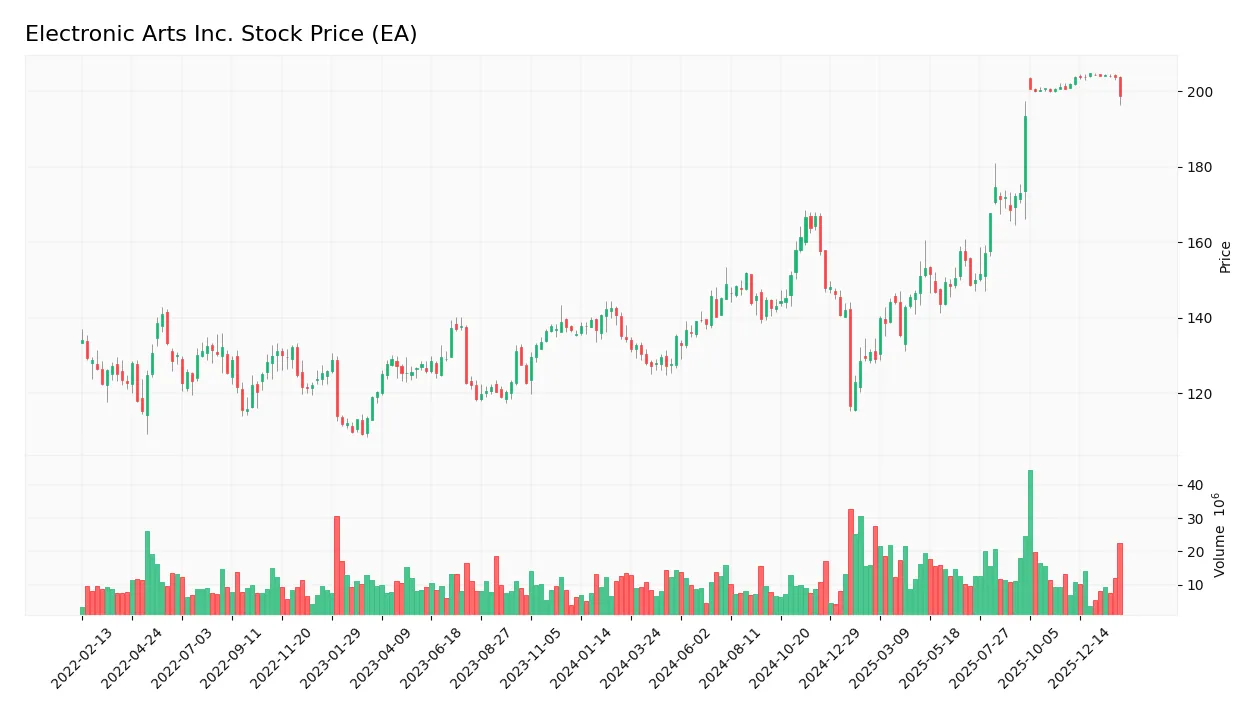
Trend Analysis
Over the past year, EA’s stock price gained 48.01%, indicating a strong bullish trend despite recent deceleration. The price ranged from a low of 116.56 to a high of 204.79, with notable volatility reflected by a 25.28 standard deviation. However, from November 2025 to February 2026, the trend turned neutral with a slight -0.97% decline.
Volume Analysis
Trading volume has increased overall, with buyers accounting for 59.15% of total activity, suggesting buyer-driven momentum. In the recent three months, selling dominated with buyers at 36.3%, implying cautious investor sentiment and potential profit-taking amid sideways price movement.
Target Prices
Analysts show a bullish outlook for Electronic Arts Inc., with a strong consensus on upside potential.
| Target Low | Target High | Consensus |
|---|---|---|
| 191 | 210 | 206.78 |
The target prices suggest confidence in EA’s growth prospects, with most analysts expecting the stock to trade near the upper end.

Don’t Let Luck Decide Your Entry Point
Optimize your entry points with our advanced ProRealTime indicators. You’ll get efficient buy signals with precise price targets for maximum performance. Start outperforming now!
Analyst & Consumer Opinions
This section examines Electronic Arts Inc.’s recent analyst grades alongside consumer feedback to provide balanced insights.
Stock Grades
Here are the latest verified stock grades for Electronic Arts Inc. from recognized financial institutions:
| Grading Company | Action | New Grade | Date |
|---|---|---|---|
| Citigroup | Maintain | Neutral | 2026-02-04 |
| Citigroup | Maintain | Neutral | 2025-10-30 |
| Morgan Stanley | Maintain | Equal Weight | 2025-10-20 |
| Roth Capital | Downgrade | Neutral | 2025-10-02 |
| Jefferies | Downgrade | Hold | 2025-09-30 |
| Wedbush | Maintain | Neutral | 2025-09-30 |
| BMO Capital | Maintain | Market Perform | 2025-09-30 |
| Argus Research | Maintain | Buy | 2025-09-30 |
| Freedom Capital Markets | Downgrade | Hold | 2025-09-29 |
| HSBC | Downgrade | Hold | 2025-09-29 |
The trend indicates a cautious shift, with multiple downgrades from Buy to Hold or Neutral in late 2025. Most firms maintain neutral or hold ratings, reflecting a tempered market outlook on EA.
Consumer Opinions
Electronic Arts (EA) evokes strong reactions from gamers and investors alike, reflecting its deep impact on the gaming industry.
| Positive Reviews | Negative Reviews |
|---|---|
| Consistently delivers high-quality graphics and immersive gameplay. | Frequent complaints about aggressive microtransactions. |
| Strong franchise lineup with popular titles like FIFA and Madden. | Customer support response times often lag behind expectations. |
| Innovative features and regular content updates keep players engaged. | Some users cite bugs and glitches reducing gameplay experience. |
Overall, consumers praise EA for its engaging franchises and innovation. However, persistent issues with monetization strategies and customer service dampen enthusiasm.
Risk Analysis
The following table summarizes key risks facing Electronic Arts Inc. that investors should monitor closely:
| Category | Description | Probability | Impact |
|---|---|---|---|
| Valuation Risk | Elevated P/E (33.78) and P/B (5.93) ratios suggest overvaluation. | High | High |
| Liquidity Risk | Current ratio below 1 (0.95) indicates potential short-term liquidity constraints. | Moderate | Moderate |
| Market Competition | Intense competition in gaming sector could pressure margins. | High | High |
| Regulatory Risk | Changes in content licensing or data privacy laws may affect revenues. | Moderate | Moderate |
| Product Dependency | Heavy reliance on a few franchises like FIFA and Battlefield. | Moderate | High |
| Economic Sensitivity | Consumer discretionary spend volatility during downturns. | High | Moderate |
Valuation and market competition present the most significant risks. EA’s stretched valuation multiples exceed sector averages, increasing downside if growth slows. Additionally, fierce competition and reliance on key franchises expose EA to profit volatility. The current ratio below 1 flags liquidity caution amid these headwinds.
Should You Buy Electronic Arts Inc.?
Electronic Arts Inc. appears to be a robust value creator with a very favorable, durable competitive moat supported by growing ROIC above WACC. Despite moderate leverage and mixed valuation metrics, its overall B- rating suggests a generally healthy financial profile worth analytical consideration.
Strength & Efficiency Pillars
Electronic Arts Inc. showcases robust profitability with a net margin of 15.02% and a return on equity of 17.55%. Its return on invested capital (ROIC) stands at 11.32%, comfortably above the weighted average cost of capital (WACC) at 7.16%, confirming the company as a clear value creator. Financially, EA is solid with an Altman Z-Score of 5.67 in the safe zone and a strong Piotroski Score of 7, underscoring healthy financial stability and operational strength.
Weaknesses and Drawbacks
Despite its strengths, EA faces valuation challenges with a high price-to-earnings ratio of 33.78 and a price-to-book ratio of 5.93, signaling a premium market valuation that could limit upside. The current ratio of 0.95 is below the ideal threshold, flagging potential liquidity concerns. Additionally, recent market dynamics show seller dominance with only 36.3% buyer volume since late 2025, creating short-term pressure and volatility despite an overall bullish trend.
Our Verdict about Electronic Arts Inc.
The company’s long-term fundamentals appear favorable, supported by strong profitability and financial health. However, despite the bullish overall trend, recent seller dominance suggests caution. Investors might consider a wait-and-see approach for a better entry point, as valuation premiums and near-term market pressure could weigh on performance. EA’s profile may appear attractive for disciplined investors focused on sustainable value creation.
Disclaimer: This content is for informational purposes only and does not constitute financial, investment, or other professional advice. Investing in financial markets involves a significant risk of loss, and past performance is not indicative of future results.
Additional Resources
- Electronic Arts: 5% Upside From Merger Arbitrage (NASDAQ:EA) – Seeking Alpha (Feb 05, 2026)
- BI Asset Management Fondsmaeglerselskab A S Increases Stake in Electronic Arts Inc. $EA – MarketBeat (Feb 05, 2026)
- EA SPORTS™ Madden NFL 26 Simulation Reveals Seattle Seahawks to Win Super Bowl LX – Electronic Arts Home Page (Feb 02, 2026)
- Machina Capital S.A.S. Has $779,000 Holdings in Electronic Arts Inc. $EA – MarketBeat (Feb 05, 2026)
- AlphaQuest LLC Sells 6,511 Shares of Electronic Arts Inc. $EA – MarketBeat (Feb 05, 2026)
For more information about Electronic Arts Inc., please visit the official website: ea.com