Home > Comparison > Technology > QCOM vs NVEC
The strategic rivalry between QUALCOMM Incorporated and NVE Corporation shapes the evolution of the semiconductor industry. QUALCOMM operates as a capital-intensive technology giant specializing in wireless communication chips and licensing, while NVE focuses on niche spintronic sensors with a lean operational model. This analysis pits broad-based innovation against specialized disruption, aiming to identify which trajectory delivers superior risk-adjusted returns for a diversified portfolio in 2026.

Table of contents
Companies Overview
QUALCOMM Incorporated and NVE Corporation stand as distinct players in the dynamic semiconductor landscape.
QUALCOMM Incorporated: Wireless Technology Pioneer
QUALCOMM dominates as a foundational technology developer for the wireless industry. Its core revenue stems from integrated circuits and licensing patents essential for 3G, 4G, and 5G communications. In 2026, QUALCOMM strategically invests in early-stage ventures spanning AI, automotive, and IoT, reinforcing its innovation-driven growth.
NVE Corporation: Spintronics Specialist
NVE Corporation leads in spintronic device innovation, focusing on sensors and couplers that use electron spin for data acquisition and transmission. Its revenue primarily comes from customized sensors for factory automation and medical applications. The company emphasizes expanding the industrial IoT market while advancing research in magnetoresistive memory technology.
Strategic Collision: Similarities & Divergences
QUALCOMM pursues a broad ecosystem approach leveraging patents and diversified tech ventures. NVE opts for a niche, highly specialized spintronics focus. Their primary battleground is the semiconductor innovation cycle, though QUALCOMM targets wireless infrastructure while NVE zeroes in on industrial and medical sensor markets. These differences create distinct risk-reward profiles for investors.
Income Statement Comparison
This data dissects the core profitability and scalability of both corporate engines to reveal who dominates the bottom line:

| Metric | QUALCOMM Incorporated (QCOM) | NVE Corporation (NVEC) |
|---|---|---|
| Revenue | 44.3B | 26M |
| Cost of Revenue | 19.7B | 4.2M |
| Operating Expenses | 12.2B | 5.6M |
| Gross Profit | 24.5B | 22M |
| EBITDA | 14.9B | 16M |
| EBIT | 13.3B | 16M |
| Interest Expense | 664M | 0 |
| Net Income | 5.5B | 15M |
| EPS | 5.06 | 3.12 |
| Fiscal Year | 2025 | 2025 |
Income Statement Analysis: The Bottom-Line Duel
This income statement comparison exposes the underlying profitability and operational efficiency driving each company’s financial engine.
QUALCOMM Incorporated Analysis
QUALCOMM’s revenue grew steadily from $33.6B in 2021 to $44.3B in 2025, reflecting a 32% increase over five years. Gross margin remains healthy at 55.4%, supporting solid operating income. However, net income shrank by 39% over the period, falling to $5.5B in 2025, signaling margin pressure despite revenue growth. The latest year shows a revenue jump of 13.7% but net margin contracted sharply by 52%, indicating rising costs or tax impacts.
NVE Corporation Analysis
NVE’s revenue expanded by 21% from $21.4M in 2021 to $25.9M in 2025, though it dipped 13% in the latest year. The company boasts an impressive gross margin of 83.6% and net margin of 58.2%, reflecting exceptional cost control and profitability. Net income rose 29% over five years to $15.1M, with a slight net margin improvement overall. Despite recent revenue softness, NVE sustains strong earnings momentum and high operational leverage.
Margin Power vs. Revenue Scale
QUALCOMM excels in scale and revenue growth but struggles with declining net profitability, highlighting operational or tax challenges. NVE delivers superior margins and consistent net income growth, albeit on a smaller revenue base. For investors, QUALCOMM’s profile suits those prioritizing scale and growth potential, while NVE attracts those valuing high-margin, efficient earnings expansion.
Financial Ratios Comparison
These vital ratios act as a diagnostic tool to expose the underlying fiscal health, valuation premiums, and capital efficiency of each company:
| Ratios | QUALCOMM Incorporated (QCOM) | NVE Corporation (NVEC) |
|---|---|---|
| ROE | 26.1% (2025) | 24.2% (2025) |
| ROIC | 13.2% (2025) | 21.1% (2025) |
| P/E | 32.7 (2025) | 20.5 (2025) |
| P/B | 8.54 (2025) | 4.95 (2025) |
| Current Ratio | 2.82 (2025) | 28.4 (2025) |
| Quick Ratio | 2.10 (2025) | 22.0 (2025) |
| D/E | 0.70 (2025) | 0.01 (2025) |
| Debt-to-Assets | 29.5% (2025) | 1.4% (2025) |
| Interest Coverage | 18.6 (2025) | 0 (2025) |
| Asset Turnover | 0.88 (2025) | 0.40 (2025) |
| Fixed Asset Turnover | 9.44 (2025) | 8.91 (2025) |
| Payout ratio | 68.7% (2025) | 128.4% (2025) |
| Dividend yield | 2.10% (2025) | 6.28% (2025) |
| Fiscal Year | 2025 | 2025 |
Efficiency & Valuation Duel: The Vital Signs
Financial ratios act as a company’s DNA, revealing hidden risks and operational excellence that shape investor confidence and valuation.
QUALCOMM Incorporated
QUALCOMM delivers solid profitability with a 26.1% ROE and a 12.5% net margin, signaling efficient operations. However, its P/E of 32.7 and P/B of 8.54 mark the stock as stretched compared to industry norms. The company supports shareholders with a 2.1% dividend yield, reflecting steady cash returns alongside robust R&D investment.
NVE Corporation
NVE posts a strong 58.2% net margin and a 24.2% ROE, indicating impressive profitability. Its P/E of 20.5 is more moderate, but the 28.4 current ratio signals excess liquidity, which may tie up capital inefficiently. NVE offers no dividend but reinvests heavily in growth, balancing capital efficiency with future potential.
Operational Efficiency vs. Valuation Discipline
QUALCOMM shows efficient capital use and shareholder returns, albeit at a premium valuation. NVE boasts superior profit margins and growth focus but suffers from liquidity excesses and weaker turnover. Investors seeking balance might prefer QUALCOMM’s disciplined payouts; those favoring growth could lean toward NVE’s reinvestment strategy.
Which one offers the Superior Shareholder Reward?
I see QUALCOMM (QCOM) pays a modest 2.1% dividend yield with a 69% payout ratio, supported by strong free cash flow (FCF) of 11.7B. Its buyback program is steady but less aggressive. NVE Corporation (NVEC) delivers a high 6.3% yield but with a payout ratio exceeding 100%, signaling dividend risk. NVEC’s buybacks are minimal, reflecting its capital-light model and retained earnings. Historically, QCOM’s balanced distribution and efficient capital allocation support sustainable long-term returns. NVEC’s yield is tempting but less reliable. For 2026, I favor QCOM for superior total shareholder reward through prudent dividends and consistent buybacks.
Comparative Score Analysis: The Strategic Profile
The radar chart reveals the fundamental DNA and trade-offs of QUALCOMM Incorporated and NVE Corporation, highlighting their strategic financial strengths and weaknesses:
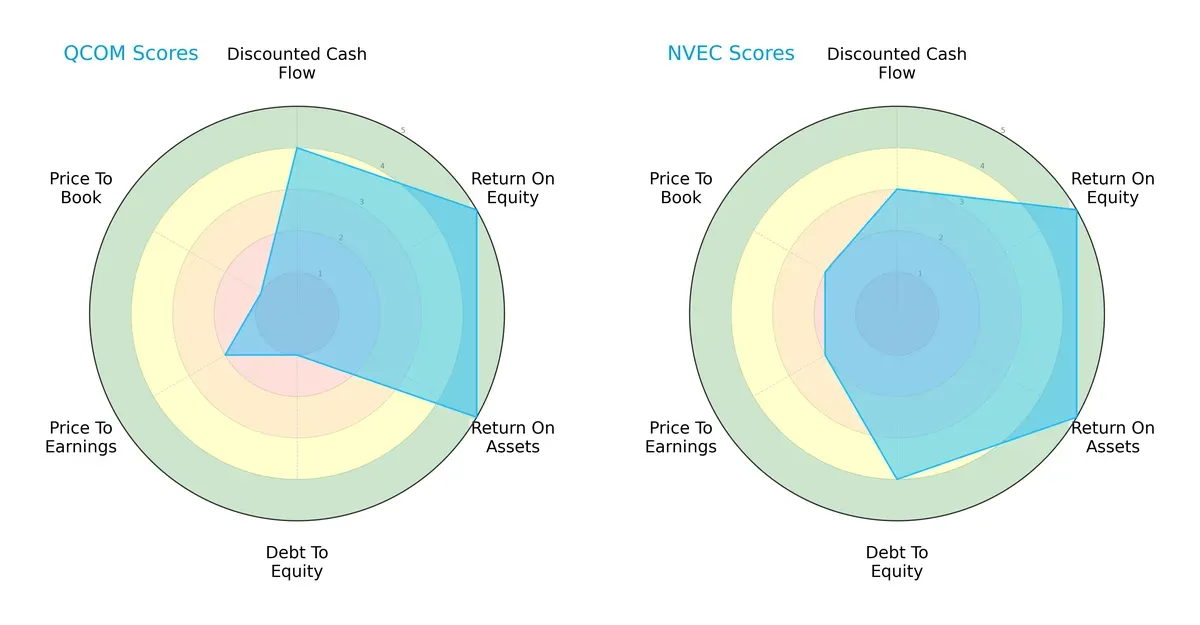
QUALCOMM shows robust operational efficiency with top ROE and ROA scores of 5 each, but it suffers from a weak balance sheet, marked by very unfavorable debt-to-equity and price-to-book scores of 1. NVE Corporation exhibits a more balanced profile, maintaining strong profitability metrics while also scoring favorably on debt management with a debt-to-equity score of 4. QUALCOMM relies heavily on its operational excellence edge, whereas NVE achieves steadiness through prudent financial leverage and valuation metrics.
Bankruptcy Risk: Solvency Showdown
The Altman Z-Score gap between QUALCOMM (5.98) and NVE Corporation (120.35) underscores both firms’ strong solvency, with NVE’s extraordinarily high score signaling an exceptionally low bankruptcy risk in this cycle:

Financial Health: Quality of Operations
QUALCOMM’s Piotroski F-Score of 7 indicates strong financial health, outperforming NVE Corporation’s average score of 5. This suggests QUALCOMM has a cleaner internal financial profile and fewer red flags in profitability, leverage, and operational efficiency:

How are the two companies positioned?
This section dissects the operational DNA of QUALCOMM and NVE by comparing their revenue distribution and internal dynamics. The goal is to confront their economic moats to reveal which model offers the most durable competitive edge today.
Revenue Segmentation: The Strategic Mix
The following visual comparison dissects how QUALCOMM Incorporated and NVE Corporation diversify their income streams and where their primary sector bets lie:

QUALCOMM anchors its revenue heavily in QCT, generating $38.4B in 2025, dwarfing its QTL segment at $5.6B. This concentration signals a strong ecosystem lock-in around chip technology. In contrast, NVE’s revenue pivots between Product ($25.9M) and Contract Research & Development ($1.1M) in 2022, showing a more balanced though smaller scale mix. QUALCOMM’s dominance invites concentration risk but also underscores infrastructure leadership. NVE’s spread reduces segment dependence but limits scale advantages.
Strengths and Weaknesses Comparison
This table compares the Strengths and Weaknesses of QUALCOMM and NVE Corporation:
QUALCOMM Strengths
- Strong global presence with significant revenue in China and other foreign markets
- Favorable profitability metrics including 12.5% net margin and 26.1% ROE
- Solid liquidity with current ratio 2.82 and quick ratio 2.1
- High fixed asset turnover at 9.44 indicating efficient asset use
- Diversified revenue streams across segments like QCT and QTL
NVE Corporation Strengths
- High profitability with 58.2% net margin and 21.1% ROIC
- Very low debt levels with 0.01 debt-to-equity and 1.43% debt-to-assets
- Exceptional interest coverage ratio indicating strong ability to cover debt costs
- Favorable fixed asset turnover (8.91) and strong product segment revenue
- Moderate global presence with diversified sales across U.S., Europe, and Asia Pacific
QUALCOMM Weaknesses
- Unfavorable valuation multiples with PE of 32.7 and PB of 8.54
- Moderate leverage with debt-to-equity of 0.7 and some neutral asset turnover ratios
- Heavy revenue concentration in China exposes regional risk
- Dividend yield modest at 2.1%, lower than NVE’s neutral 6.28% yield
NVE Corporation Weaknesses
- Unfavorable current ratio at 28.4 indicating possible inefficiency in asset management
- Lower asset turnover at 0.4 suggests less efficient use of assets
- Price-to-book ratio unfavorable at 4.95
- Smaller scale with less diversified revenue compared to QUALCOMM
Both companies show favorable overall financial health but differ in scale and efficiency. QUALCOMM leverages global diversification and liquidity strength but faces valuation and concentration risks. NVE excels in profitability and low leverage but must address asset utilization and liquidity concerns to optimize growth.
The Moat Duel: Analyzing Competitive Defensibility
A structural moat stands as the only true defense against the relentless erosion of long-term profits by competition:
QUALCOMM Incorporated: Intellectual Property Licensing Moat
QUALCOMM’s moat hinges on its vast patent portfolio and licensing model. This generates high ROIC and stable margins despite market shifts. Expansion in 5G tech deepens its moat in 2026 but requires vigilance on regulatory risks.
NVE Corporation: Niche Technology Innovation Moat
NVE leverages spintronics, a specialized technology with high gross and net margins, differentiating it from QUALCOMM’s patent licensing. Its growing ROIC signals strong value creation and potential in industrial IoT and medical devices.
Moat Mastery: Licensing Power vs. Technological Innovation
NVE’s growing ROIC and niche innovation create a deeper, more sustainable moat than QUALCOMM’s declining profitability despite a wider patent base. NVE appears better positioned to defend and expand market share in 2026.
Which stock offers better returns?
The past year shows notable price declines for both stocks, with divergent recent trading dynamics reflecting shifts in buyer dominance and volume trends.

Trend Comparison
QUALCOMM Incorporated’s stock fell 9.54% over the last 12 months, marking a bearish trend with decelerating losses. Volatility remains elevated (16.22 std deviation), with highs of 215.33 and lows near 127.46.
NVE Corporation declined 20.49% over the year, also bearish but with accelerating losses. Recent months show an 8.96% rebound and modest volatility (7.57 std deviation), indicating a potential trend shift.
QUALCOMM’s loss is less severe than NVE’s, which posted the larger decline but recent strength. QUALCOMM delivered the higher market performance over the full 12-month period.
Target Prices
QUALCOMM Incorporated shows a robust target consensus from verified analysts.
| Company | Target Low | Target High | Consensus |
|---|---|---|---|
| QUALCOMM Incorporated | 160 | 210 | 181.43 |
Analysts expect QUALCOMM’s shares to appreciate from the current 151.08 to around 181.43, signaling moderate upside potential. No verified target price data is available for NVE Corporation.

Don’t Let Luck Decide Your Entry Point
Optimize your entry points with our advanced ProRealTime indicators. You’ll get efficient buy signals with precise price targets for maximum performance. Start outperforming now!
How do institutions grade them?
The following summarizes the recent institutional grades for QUALCOMM Incorporated and NVE Corporation:
QUALCOMM Incorporated Grades
Here are the latest analyst grades from prominent financial firms for QUALCOMM Incorporated:
| Grading Company | Action | New Grade | Date |
|---|---|---|---|
| Cantor Fitzgerald | Maintain | Neutral | 2026-02-02 |
| Mizuho | Maintain | Neutral | 2026-01-26 |
| UBS | Maintain | Neutral | 2026-01-26 |
| Mizuho | Downgrade | Neutral | 2026-01-09 |
| Wells Fargo | Maintain | Underweight | 2025-11-06 |
| Piper Sandler | Maintain | Overweight | 2025-11-06 |
| UBS | Maintain | Neutral | 2025-11-06 |
| Mizuho | Maintain | Outperform | 2025-11-06 |
| Rosenblatt | Maintain | Buy | 2025-11-06 |
| B of A Securities | Maintain | Buy | 2025-11-06 |
NVE Corporation Grades
No reliable institutional grades are available for NVE Corporation at this time.
Which company has the best grades?
QUALCOMM Incorporated has received a broader and more diverse set of institutional grades compared to NVE Corporation. Its ratings range from Underweight to Buy, indicating mixed but generally positive sentiment. This variance may influence investor confidence and portfolio positioning.
Risks specific to each company
In the challenging 2026 market environment, understanding these critical pressure points and systemic threats is vital for both QUALCOMM Incorporated and NVE Corporation:
1. Market & Competition
QUALCOMM Incorporated
- Faces intense competition in semiconductors with global tech giants; innovation pace demands constant R&D investment.
NVE Corporation
- Operates in niche spintronics market; limited scale but less direct rivalry; innovation critical for market relevance.
2. Capital Structure & Debt
QUALCOMM Incorporated
- Moderate leverage (D/E 0.7) with strong interest coverage; balance sheet stable but debt management requires vigilance.
NVE Corporation
- Minimal debt load (D/E 0.01), near zero financial risk; capital structure highly conservative but may limit growth potential.
3. Stock Volatility
QUALCOMM Incorporated
- Beta 1.238 indicates above-market volatility; price range wide (120.8-205.95) reflecting sensitivity to sector cycles.
NVE Corporation
- Beta 1.219 slightly lower volatility; smaller market cap leads to liquidity risk and potential price swings.
4. Regulatory & Legal
QUALCOMM Incorporated
- Exposed to global patent litigation and licensing disputes; regulatory scrutiny in wireless tech intensifies.
NVE Corporation
- Faces regulatory risk mainly from product certifications; less exposed to complex IP litigations.
5. Supply Chain & Operations
QUALCOMM Incorporated
- Complex global supply chain vulnerable to semiconductor shortages and geopolitical disruptions.
NVE Corporation
- Smaller scale supply chain; potential operational bottlenecks but less complexity reduces systemic risk.
6. ESG & Climate Transition
QUALCOMM Incorporated
- Pressured to meet stringent ESG standards due to size and public scrutiny; ongoing initiatives in sustainable tech.
NVE Corporation
- ESG risks lower due to niche operations; however, limited resources may impede rapid climate transition compliance.
7. Geopolitical Exposure
QUALCOMM Incorporated
- Significant exposure to US-China tech tensions; export controls could impact core business segments.
NVE Corporation
- Limited international footprint reduces geopolitical risk but also constrains growth opportunities.
Which company shows a better risk-adjusted profile?
NVE Corporation’s minimal debt and niche market focus reduce financial and competitive risks, but its small scale and liquidity concerns remain. QUALCOMM’s dominant market position and robust financials contrast with higher debt and geopolitical vulnerabilities. I see QUALCOMM’s risk profile as more balanced due to scale and innovation, despite debt concerns.
The most impactful risk for QUALCOMM is geopolitical exposure amid US-China tensions, threatening supply chains and licensing revenues. For NVE, supply chain and operational scale are critical risks, limiting agility. QUALCOMM edges out with a stronger overall risk-adjusted profile, supported by a safe Altman Z-score of 5.98 and solid Piotroski score of 7, reflecting financial strength and resilience.
Final Verdict: Which stock to choose?
QUALCOMM’s superpower lies in its unmatched operational efficiency and strong capital allocation, consistently creating value despite a slightly declining profitability trend. Its robust balance sheet supports resilience, though investors should monitor its stretched valuation multiples. It suits portfolios targeting steady income with moderate growth exposure.
NVE Corporation commands a strategic moat through its rapidly growing ROIC and sustainable competitive advantage, backed by exceptional profitability margins. Compared to QUALCOMM, it offers better financial stability and a stronger margin of safety despite its smaller scale. It fits well with investors seeking GARP (Growth at a Reasonable Price) profiles.
If you prioritize established cash-generating efficiency and dividend reliability, QUALCOMM is the compelling choice due to its proven value creation and scale. However, if you seek higher growth potential with expanding profitability and a fortress-like balance sheet, NVE Corporation offers better stability and a more attractive growth trajectory. Both present compelling analytical scenarios depending on your risk tolerance and investment horizon.
Disclaimer: Investment carries a risk of loss of initial capital. The past performance is not a reliable indicator of future results. Be sure to understand risks before making an investment decision.
Go Further
I encourage you to read the complete analyses of QUALCOMM Incorporated and NVE Corporation to enhance your investment decisions: