In today’s dynamic technology sector, Nutanix, Inc. and Wix.com Ltd. stand out as innovators in software infrastructure, each addressing distinct but overlapping market needs. Nutanix excels in enterprise cloud platforms, while Wix empowers users with accessible web development tools. This comparison will explore their strategies and growth potential to help you determine which company offers the most compelling investment opportunity in 2026. Let’s dive into the details and find the best fit for your portfolio.
Table of contents
Companies Overview
I will begin the comparison between Nutanix and Wix by providing an overview of these two companies and their main differences.
Nutanix Overview
Nutanix, Inc. provides an enterprise cloud platform with a focus on infrastructure software and hybrid cloud orchestration. Headquartered in San Jose, California, the company serves diverse industries including automotive, healthcare, financial services, and telecommunications. Nutanix offers a broad portfolio including virtualization, storage, Kubernetes management, and desktop-as-a-service solutions, positioning itself as a key player in enterprise cloud technology with a $12.4B market cap.
Wix Overview
Wix.com Ltd. is a cloud-based platform headquartered in Tel Aviv, Israel, enabling users worldwide to create websites and web applications. It offers a suite of tools such as drag-and-drop editors, AI-powered logo makers, payment platforms, and customer engagement features. With approximately 222M registered users and 6M premium subscriptions, Wix operates primarily in the software infrastructure sector with a $4.5B market cap, targeting individuals and businesses seeking easy online presence solutions.
Key similarities and differences
Both Nutanix and Wix operate in the software infrastructure industry, serving global markets with cloud-based technology solutions. Nutanix focuses on enterprise-grade hybrid cloud platforms and virtualization for large organizations, while Wix targets web development and online business tools for individuals and SMEs. Their business models differ in customer base and product scope, with Nutanix emphasizing complex IT infrastructure, and Wix prioritizing user-friendly website creation and digital services.
Income Statement Comparison
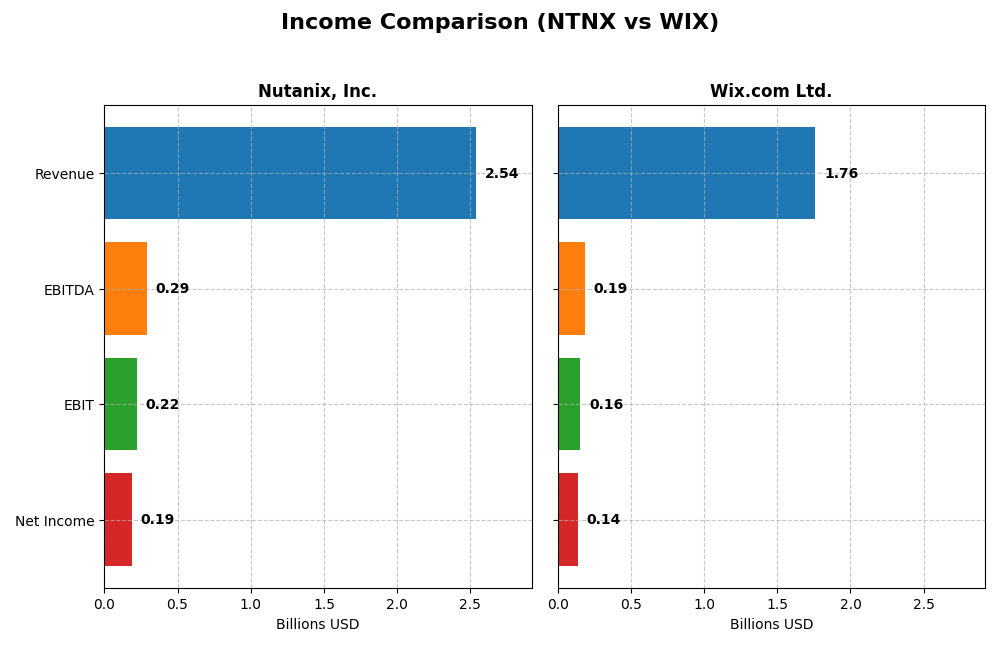
The table below compares key income statement metrics for Nutanix, Inc. and Wix.com Ltd. based on their most recent fiscal year reports.
| Metric | Nutanix, Inc. (NTNX) | Wix.com Ltd. (WIX) |
|---|---|---|
| Market Cap | 12.4B | 4.5B |
| Revenue | 2.54B | 1.76B |
| EBITDA | 293M | 186M |
| EBIT | 220M | 155M |
| Net Income | 188M | 138M |
| EPS | 0.70 | 2.49 |
| Fiscal Year | 2025 | 2024 |
Income Statement Interpretations
Nutanix, Inc.
Nutanix demonstrated strong revenue growth from $1.39B in 2021 to $2.54B in 2025, with net income improving from a loss of $1.03B in 2021 to a profit of $188M in 2025. Gross margins remained robust at 86.81%, while EBIT margins stabilized around 8.67%. The 2025 fiscal year showed significant margin improvement and a substantial turnaround in profitability.
Wix.com Ltd.
Wix’s revenue increased steadily from $984M in 2020 to $1.76B in 2024, with net income turning positive in 2023 and reaching $138M in 2024. Gross margins held favorably at 67.93%, while EBIT margins were stable at 8.81%. The latest year reflected solid growth in both revenue and net margin, supported by a sharp rise in EPS and operating income.
Which one has the stronger fundamentals?
Both Nutanix and Wix show favorable income statement trends, with strong revenue and net income growth. Nutanix reports higher gross margins and a remarkable recovery to profitability, while Wix demonstrates consistent margin stability and positive earnings growth. Each company’s fundamentals are solid, but Nutanix’s recent margin expansion and turnaround are notable strengths.
Financial Ratios Comparison
The table below presents a side-by-side comparison of key financial ratios for Nutanix, Inc. (NTNX) and Wix.com Ltd. (WIX) based on their most recent fiscal year data.
| Ratios | Nutanix, Inc. (2025) | Wix.com Ltd. (2024) |
|---|---|---|
| ROE | -27.1% | -175.6% |
| ROIC | 8.1% | 9.1% |
| P/E | 106.7 | 86.2 |
| P/B | -29.0 | -151.4 |
| Current Ratio | 1.72 | 0.84 |
| Quick Ratio | 1.72 | 0.84 |
| D/E (Debt-to-Equity) | -2.14 | -12.31 |
| Debt-to-Assets | 45.2% | 50.7% |
| Interest Coverage | 8.75 | 25.92 |
| Asset Turnover | 0.77 | 0.92 |
| Fixed Asset Turnover | 9.15 | 3.33 |
| Payout Ratio | 0 | 0 |
| Dividend Yield | 0 | 0 |
Interpretation of the Ratios
Nutanix, Inc.
Nutanix shows a mixed ratio profile with favorable liquidity and coverage ratios, including a strong current ratio of 1.72 and interest coverage at 11.15, indicating solid short-term financial health. However, its negative return on equity (-27.12%) and high PE ratio (106.74) raise concerns about profitability and valuation. Nutanix does not pay dividends, likely reflecting its growth focus and reinvestment strategy.
Wix.com Ltd.
Wix presents mixed ratios as well, with favorable debt-to-equity (-12.31) and interest coverage (40.14), but an unfavorable current ratio (0.84) suggesting liquidity constraints. Its return on equity is deeply negative (-175.57%), and the PE ratio remains high at 86.21, signaling valuation and profitability challenges. Wix does not distribute dividends, probably prioritizing reinvestment and growth initiatives.
Which one has the best ratios?
Nutanix holds a slightly favorable ratio stance with half of its ratios positive, particularly in liquidity and operational efficiency, while Wix’s ratios appear slightly unfavorable, mainly due to liquidity and leverage concerns. Both companies share challenges in profitability and valuation, but Nutanix’s stronger coverage and liquidity metrics offer a marginal advantage in ratio quality.
Strategic Positioning
This section compares the strategic positioning of Nutanix, Inc. and Wix.com Ltd. regarding Market position, Key segments, and disruption:
Nutanix, Inc.
- Strong market position in enterprise cloud infrastructure with moderate competitive pressure.
- Key segments include subscription software, professional services, and enterprise cloud solutions.
- Exposure to technological disruption via cloud-native environments and hybrid cloud orchestration.
Wix.com Ltd.
- Niche player in cloud-based website creation facing intense competition.
- Focuses on creative subscriptions and business solutions for website owners.
- Faces disruption from evolving web development and AI-powered tools.
Nutanix vs Wix Positioning
Nutanix has a diversified portfolio centered on enterprise cloud infrastructure, balancing software and services, while Wix concentrates on cloud-based website and business solutions. Nutanix’s broad industry reach contrasts with Wix’s specialized platform focus, each with distinct market dynamics.
Which has the best competitive advantage?
Nutanix demonstrates a very favorable moat with consistent value creation and growing profitability. Wix shows a slightly unfavorable moat, shedding value despite improving profitability, indicating Nutanix currently holds the stronger competitive advantage.
Stock Comparison
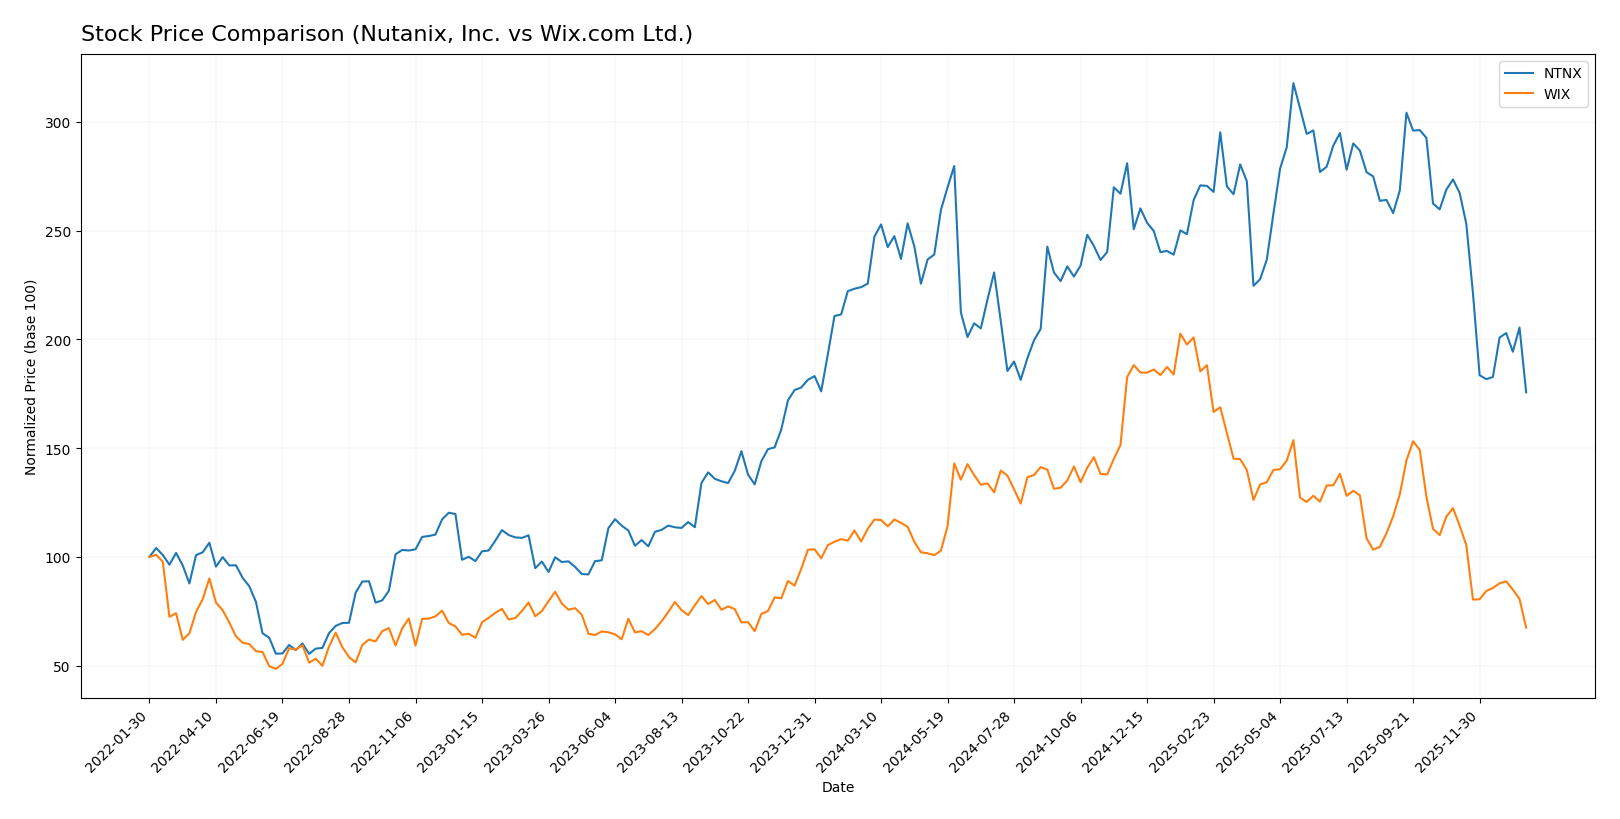
The stock prices of Nutanix, Inc. (NTNX) and Wix.com Ltd. (WIX) have both exhibited significant declines over the past 12 months, with notable deceleration in their downward trends and fluctuating trading volumes influencing market dynamics.
Trend Analysis
Nutanix, Inc. (NTNX) has shown a bearish trend over the past year, with a price decrease of 22.16%. The trend is decelerating, with volatility measured by a standard deviation of 8.67, and prices ranging between 45.74 and 82.77.
Wix.com Ltd. (WIX) also experienced a bearish trend, with a steeper 40.28% price decline over the same 12-month period. Volatility is notably higher at 34.39, with the highest price reaching 240.89 and the lowest at 80.16, alongside deceleration in the trend.
Comparing both, Nutanix’s stock outperformed Wix’s in terms of smaller percentage loss, delivering a less severe market decline over the analyzed period.
Target Prices
Analysts present a mixed yet optimistic target consensus for Nutanix, Inc. and Wix.com Ltd.
| Company | Target High | Target Low | Consensus |
|---|---|---|---|
| Nutanix, Inc. | 90 | 53 | 64.67 |
| Wix.com Ltd. | 210 | 70 | 160.27 |
For Nutanix, the consensus target price of 64.67 indicates a potential upside from the current 45.74 USD, suggesting moderate growth expectations. Wix.com’s target consensus at 160.27 USD is significantly above its current 80.16 USD price, reflecting strong analyst confidence in its future performance.
Analyst Opinions Comparison
This section compares analysts’ ratings and grades for Nutanix, Inc. (NTNX) and Wix.com Ltd. (WIX):
Rating Comparison
NTNX Rating
- Rating: C+ with a very favorable overall evaluation status.
- Discounted Cash Flow Score: 4, indicating a favorable valuation based on cash flow.
- ROE Score: 1, classified as very unfavorable reflecting low profitability from equity.
- ROA Score: 4, favorable, demonstrating effective asset utilization.
- Debt To Equity Score: 1, very unfavorable, suggesting high financial risk.
- Overall Score: 2, moderate, summarizing the company’s financial standing.
WIX Rating
- Rating: C with a very favorable overall evaluation status.
- Discounted Cash Flow Score: 3, indicating a moderate valuation based on cash flow.
- ROE Score: 1, also very unfavorable, showing similarly low profitability from equity.
- ROA Score: 4, favorable, indicating efficient use of assets.
- Debt To Equity Score: 1, very unfavorable, indicating a similar high financial risk.
- Overall Score: 2, moderate, reflecting comparable financial health.
Which one is the best rated?
Based strictly on the provided data, NTNX holds a slightly higher rating of C+ compared to WIX’s C. NTNX also scores better on discounted cash flow, while both share similar scores in other key financial metrics and overall moderate scores.
Scores Comparison
Here is a comparison of the Altman Z-Score and Piotroski Score for Nutanix, Inc. and Wix.com Ltd.:
NTNX Scores
- Altman Z-Score: 1.48, in distress zone indicating high risk
- Piotroski Score: 6, classified as average financial health
WIX Scores
- Altman Z-Score: 1.83, in grey zone indicating moderate risk
- Piotroski Score: 6, classified as average financial health
Which company has the best scores?
Wix.com Ltd. has a slightly better Altman Z-Score, placing it in the grey zone versus Nutanix’s distress zone, while both share the same average Piotroski Score of 6.
Grades Comparison
Here is a comparison of the latest available grades for Nutanix, Inc. and Wix.com Ltd.:
Nutanix, Inc. Grades
The table below summarizes recent analyst grades for Nutanix, Inc.:
| Grading Company | Action | New Grade | Date |
|---|---|---|---|
| Barclays | Downgrade | Equal Weight | 2026-01-15 |
| Morgan Stanley | Downgrade | Equal Weight | 2026-01-12 |
| RBC Capital | Maintain | Outperform | 2026-01-05 |
| Goldman Sachs | Maintain | Buy | 2025-11-28 |
| JP Morgan | Maintain | Overweight | 2025-11-26 |
| Needham | Maintain | Buy | 2025-11-26 |
| Wells Fargo | Maintain | Equal Weight | 2025-11-26 |
| Morgan Stanley | Maintain | Overweight | 2025-11-26 |
| Keybanc | Maintain | Overweight | 2025-11-26 |
| Piper Sandler | Maintain | Overweight | 2025-11-26 |
Nutanix shows a mixed rating trend with recent downgrades from Overweight to Equal Weight by major firms, yet several maintain Buy or Outperform ratings.
Wix.com Ltd. Grades
The table below summarizes recent analyst grades for Wix.com Ltd.:
| Grading Company | Action | New Grade | Date |
|---|---|---|---|
| Morgan Stanley | Maintain | Overweight | 2026-01-15 |
| Wells Fargo | Maintain | Overweight | 2025-12-19 |
| Cantor Fitzgerald | Maintain | Overweight | 2025-12-11 |
| Wells Fargo | Maintain | Overweight | 2025-11-20 |
| Barclays | Maintain | Overweight | 2025-11-20 |
| Citizens | Maintain | Market Outperform | 2025-11-20 |
| Citigroup | Maintain | Buy | 2025-11-20 |
| Scotiabank | Maintain | Sector Outperform | 2025-11-20 |
| Needham | Maintain | Buy | 2025-11-20 |
| Evercore ISI Group | Maintain | Outperform | 2025-11-20 |
Wix.com exhibits consistently positive ratings, primarily Overweight and Buy, with no recent downgrades.
Which company has the best grades?
Wix.com Ltd. has received more consistently positive and stable grades, predominantly Overweight and Buy, compared to Nutanix, Inc., which has seen recent downgrades to Equal Weight. This suggests Wix.com may be viewed more favorably by analysts, potentially reflecting greater confidence in its near-term outlook.
Strengths and Weaknesses
Below is a comparative overview of the strengths and weaknesses of Nutanix, Inc. and Wix.com Ltd. based on recent financial and operational data.
| Criterion | Nutanix, Inc. (NTNX) | Wix.com Ltd. (WIX) |
|---|---|---|
| Diversification | Moderate diversification with strong subscription and professional services segments; steady revenue growth from multiple streams | Moderate diversification with creative subscription and business solutions; more dependency on creative subscriptions |
| Profitability | Neutral net margin (7.42%), but unfavorable ROE (-27.12%) and high P/E ratio indicate profitability challenges | Neutral net margin (7.86%), but very unfavorable ROE (-175.57%) and high P/E also show profitability pressure |
| Innovation | Strong innovation reflected in growing ROIC (+117%), very favorable moat indicating durable competitive advantage | Growing ROIC (+159%) but overall slightly unfavorable moat; company improving profitability but still shedding value |
| Global presence | Strong global footprint with increasing asset turnover and solid interest coverage | Global presence with good interest coverage; weaker current liquidity ratios and higher debt to assets |
| Market Share | Solid position in cloud infrastructure and hybrid cloud markets; efficient capital use | Leading in website creation platforms with expanding business solutions, but faces intense competition |
In summary, Nutanix shows a more durable competitive advantage and value creation, despite some profitability headwinds, while Wix is improving its profitability but still faces significant challenges in value creation and liquidity management. Investors should weigh Nutanix’s stable moat against Wix’s growth potential and operational risks.
Risk Analysis
Below is a comparative table outlining key risks for Nutanix, Inc. (NTNX) and Wix.com Ltd. (WIX) based on the most recent financial and market data available.
| Metric | Nutanix, Inc. (NTNX) | Wix.com Ltd. (WIX) |
|---|---|---|
| Market Risk | Low beta (0.49) indicates lower volatility; susceptible to tech sector downturns | Higher beta (1.42) suggests greater sensitivity to market swings |
| Debt level | Moderate debt-to-assets ratio (45.16%); favorable debt-to-equity and interest coverage | Higher debt-to-assets (50.7%) and unfavorable current ratio increase risk |
| Regulatory Risk | Operating globally; exposed to diverse regulations but no immediate issues reported | International presence with regulatory complexity, especially in payment processing |
| Operational Risk | Dependence on enterprise cloud adoption; slight margin pressure; neutral asset turnover | Reliance on subscription growth; moderate profitability; current ratio below 1 signals liquidity concerns |
| Environmental Risk | Limited direct exposure; primarily software services | Minimal direct environmental impact, but increasing ESG scrutiny in tech sector |
| Geopolitical Risk | US-based with global operations; potential supply chain and data privacy challenges | Based in Israel; geopolitical tensions in Middle East could affect operations |
In summary, Wix presents higher market and liquidity risks due to its elevated beta and weaker current ratio. Nutanix, while more stable in market exposure, faces operational risks from competitive cloud infrastructure demands. Both companies carry moderate debt concerns and face geopolitical uncertainties impacting global IT services. Caution and diversification remain prudent strategies.
Which Stock to Choose?
Nutanix, Inc. (NTNX) shows a favorable income evolution with 18.11% revenue growth in 2025 and strong profitability metrics, including a 7.42% net margin. Its financial ratios are slightly favorable, with strengths in liquidity and asset turnover, though it carries moderate debt and a mixed rating of C+.
Wix.com Ltd. (WIX) also presents favorable income growth of 12.74% in 2024 and solid profitability, with a 7.86% net margin. However, its financial ratios are slightly unfavorable overall, marked by weaker liquidity and higher debt levels. The company holds a slightly better rating of C but faces challenges in return on equity.
For investors, Nutanix’s very favorable economic moat and improving profitability might appeal to those with a growth orientation, while Wix’s mixed financial health and rating could be more aligned with investors willing to tolerate risk in search of potential value appreciation. The choice appears contingent on individual risk tolerance and investment strategy.
Disclaimer: Investment carries a risk of loss of initial capital. The past performance is not a reliable indicator of future results. Be sure to understand risks before making an investment decision.
Go Further
I encourage you to read the complete analyses of Nutanix, Inc. and Wix.com Ltd. to enhance your investment decisions: