QUALCOMM Incorporated and Nova Ltd. are two prominent players in the semiconductor industry, each driving innovation in distinct yet interconnected segments. QUALCOMM focuses on wireless communication technologies and licensing, while Nova specializes in advanced process control systems for semiconductor manufacturing. Their market overlap and cutting-edge strategies make them ideal candidates for comparison. In this article, I will help you determine which company offers the most compelling investment opportunity.

Table of contents
Companies Overview
I will begin the comparison between QUALCOMM Incorporated and Nova Ltd. by providing an overview of these two companies and their main differences.
QUALCOMM Overview
QUALCOMM Incorporated focuses on developing and commercializing foundational wireless technologies globally. It operates three segments: Qualcomm CDMA Technologies, Qualcomm Technology Licensing, and Qualcomm Strategic Initiatives. The company supplies integrated circuits and software for wireless communications, licenses patents related to 3G/4G/5G standards, and invests in early-stage companies across various innovative industries. QUALCOMM is headquartered in San Diego, US, with 49K employees.
Nova Ltd. Overview
Nova Ltd. designs, develops, and sells process control systems for semiconductor manufacturing worldwide. Its product portfolio includes metrology platforms for dimensional, film, and chemical measurements during key manufacturing steps like lithography and etch. Serving sectors including logic, foundries, and memory manufacturers, Nova is headquartered in Rehovot, Israel, and employs approximately 1.2K people. The company changed its name from Nova Measuring Instruments in 2021.
Key similarities and differences
Both QUALCOMM and Nova operate in the semiconductor industry and are listed on the NASDAQ Global Select exchange. QUALCOMM has a diversified business model combining technology development, licensing, and strategic investments, while Nova specializes in manufacturing process control systems for semiconductor production. QUALCOMM is significantly larger in market capitalization and workforce, reflecting its broader scope across the wireless technology ecosystem compared to Nova’s focused semiconductor metrology.
Income Statement Comparison
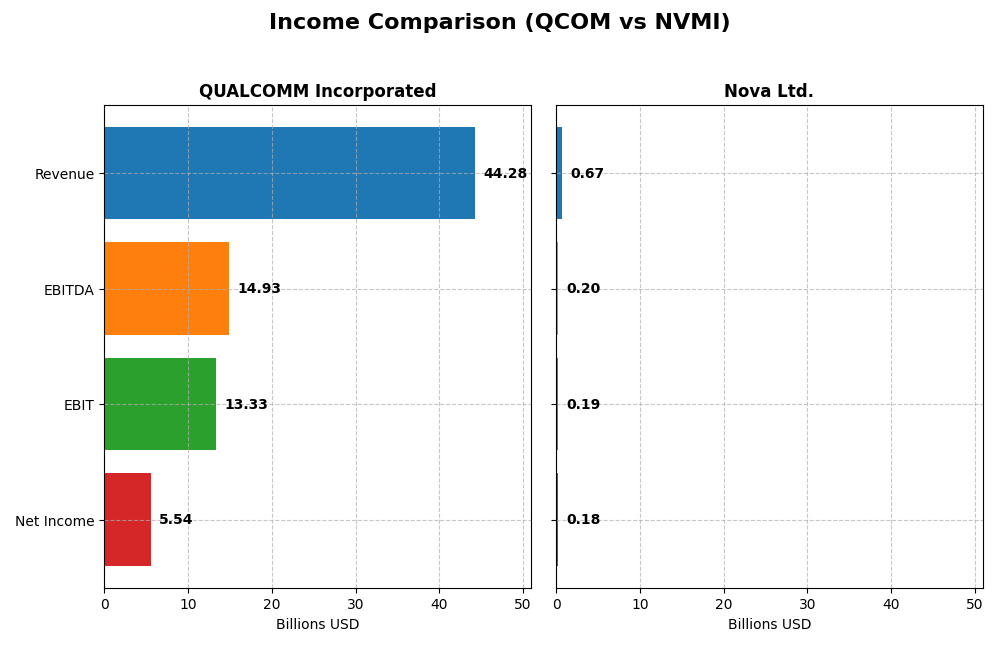
The table below presents a side-by-side comparison of key income statement metrics for QUALCOMM Incorporated and Nova Ltd. for their most recent fiscal years.
| Metric | QUALCOMM Incorporated (QCOM) | Nova Ltd. (NVMI) |
|---|---|---|
| Market Cap | 175.5B | 13.2B |
| Revenue | 44.3B | 672M |
| EBITDA | 14.9B | 205M |
| EBIT | 13.3B | 188M |
| Net Income | 5.54B | 185M |
| EPS | 5.06 | 6.31 |
| Fiscal Year | 2025 | 2024 |
Income Statement Interpretations
QUALCOMM Incorporated
QUALCOMM’s revenue grew steadily, rising from $33.6B in 2021 to $44.3B in 2025, a 31.9% increase over five years. However, net income declined by 38.7%, dropping to $5.5B in 2025, reflecting a significant margin contraction. The 2025 net margin fell sharply to 12.5%, despite favorable gross and EBIT margins, indicating cost pressures or tax impacts affecting profitability.
Nova Ltd.
Nova Ltd. demonstrated robust growth, with revenue surging from $269M in 2020 to $672M in 2024, a 149.6% increase. Net income rose even more dramatically, by 283.6%, reaching $184.9M in 2024. Margins improved notably, with a net margin of 27.3% in 2024 and consistent favorable trends in gross and EBIT margins, highlighting strong operational leverage and effective cost control.
Which one has the stronger fundamentals?
Nova Ltd. shows stronger fundamentals with higher growth rates in revenue, net income, and margins, all trending favorably over the recent period. QUALCOMM, while maintaining high gross and EBIT margins, faces declining net income and net margin pressures, which suggest challenges in sustaining profitability despite solid top-line growth. Nova’s performance points to more dynamic expansion and margin improvement.
Financial Ratios Comparison
The table below compares the most recent key financial ratios of QUALCOMM Incorporated (QCOM) and Nova Ltd. (NVMI) for fiscal year 2025 and 2024 respectively, providing a snapshot of their profitability, liquidity, leverage, and market valuation.
| Ratios | QUALCOMM Incorporated (QCOM) 2025 | Nova Ltd. (NVMI) 2024 |
|---|---|---|
| ROE | 26.13% | 19.81% |
| ROIC | 13.19% | 13.39% |
| P/E | 32.70 | 31.20 |
| P/B | 8.54 | 6.18 |
| Current Ratio | 2.82 | 2.32 |
| Quick Ratio | 2.10 | 1.92 |
| D/E (Debt to Equity) | 0.70 | 0.25 |
| Debt-to-Assets | 29.54% | 16.98% |
| Interest Coverage | 18.61 | 116.20 |
| Asset Turnover | 0.88 | 0.48 |
| Fixed Asset Turnover | 9.44 | 5.06 |
| Payout ratio | 68.67% | 0% |
| Dividend yield | 2.10% | 0% |
Interpretation of the Ratios
QUALCOMM Incorporated
QUALCOMM shows a generally strong ratio profile with favorable net margin (12.51%), ROE (26.13%), and ROIC (13.19%), supported by a solid current ratio of 2.82 and good interest coverage at 20.07. However, valuation metrics like P/E (32.7) and P/B (8.54) are unfavorable, indicating a potentially expensive stock. The company pays dividends with a 2.1% yield, suggesting stable shareholder returns, but payout sustainability should be monitored.
Nova Ltd.
Nova Ltd. exhibits favorable profitability ratios, including a high net margin of 27.33% and ROIC of 13.39%, though its WACC (12.22%) and valuation ratios (P/E 31.2, P/B 6.18) are unfavorable. Liquidity and leverage indicators are sound, with a current ratio of 2.32 and low debt-to-equity of 0.25. The company does not pay dividends, likely reflecting a reinvestment or growth strategy, with no share buybacks indicated.
Which one has the best ratios?
Both QUALCOMM and Nova Ltd. display a majority of favorable ratios at 64.29%, but QUALCOMM’s valuation concerns are slightly less pronounced with better coverage ratios and dividend yield. Nova’s higher unfavorable valuation ratios and absence of dividends reflect a different risk profile. Overall, QUALCOMM’s ratios combine strong profitability with shareholder returns, while Nova prioritizes growth and reinvestment.
Strategic Positioning
This section compares the strategic positioning of QUALCOMM and Nova Ltd., including market position, key segments, and exposure to technological disruption:
QUALCOMM
- Leading global player in semiconductors with strong competitive pressure in wireless technologies.
- Diversified segments: integrated circuits, technology licensing, and strategic initiatives in 5G, AI, automotive, and IoT.
- Invests in emerging technologies and new industries via QSI, indicating moderate exposure to tech disruption.
Nova Ltd.
- Smaller semiconductor process control systems provider facing competitive pressure in niche markets.
- Concentrated on metrology platforms for semiconductor manufacturing processes across various sectors.
- Focused on semiconductor manufacturing process control, with exposure limited to metrology technology advances.
QUALCOMM vs Nova Ltd. Positioning
QUALCOMM pursues a diversified strategy across multiple wireless and technology segments, offering broader market exposure but facing intense competition. Nova Ltd. is more concentrated in semiconductor process control, specializing in niche metrology, which limits scale but may reduce direct competition.
Which has the best competitive advantage?
QUALCOMM shows a slightly favorable moat with value creation despite declining profitability, indicating a modest competitive advantage. Nova Ltd. also holds a slightly favorable moat but is shedding value, suggesting a weaker current competitive position despite improving profitability.
Stock Comparison
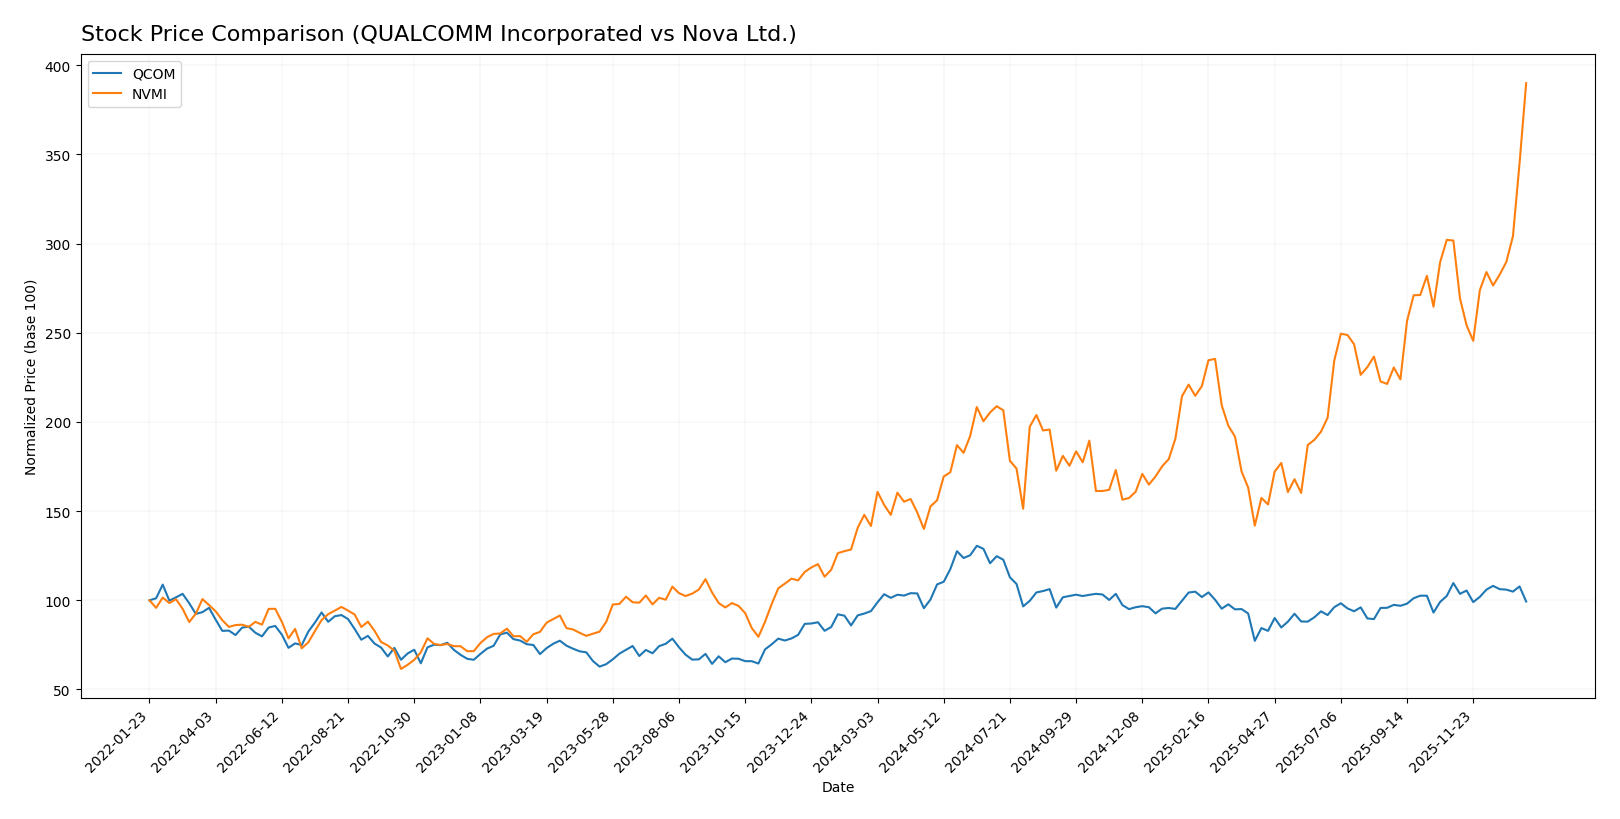
The stock prices of QUALCOMM Incorporated and Nova Ltd. have exhibited significant dynamics over the past 12 months, with QUALCOMM showing moderate bullish momentum and recent slight decline, while Nova Ltd. has experienced a strong bullish surge with notable acceleration.
Trend Analysis
QUALCOMM Incorporated’s stock price rose by 5.76% over the past year, reflecting a bullish trend with acceleration and a high volatility of 16.08. It reached a peak price of 215.33 and a low of 127.46, though recent weeks show a mild bearish correction of -9.43%. Nova Ltd.’s stock price surged by 175.25% over the past 12 months, marking a strongly bullish trend with acceleration and higher volatility at 56.25. It hit a high of 445.41 and a low of 159.92, with recent performance further accelerating by 29.24%. Comparing the two, Nova Ltd. has delivered the highest market performance with a substantially larger price increase and stronger recent upward momentum than QUALCOMM.
Target Prices
The current analyst consensus for target prices indicates potential upside for both QUALCOMM Incorporated and Nova Ltd.
| Company | Target High | Target Low | Consensus |
|---|---|---|---|
| QUALCOMM Incorporated | 210 | 165 | 185.71 |
| Nova Ltd. | 390 | 335 | 362.5 |
Analysts expect QUALCOMM’s stock to rise from its current $163.88 to around $185.71 on average, while Nova Ltd. trades above its consensus target of $362.5, suggesting recent strong performance or optimism.
Analyst Opinions Comparison
This section compares analysts’ ratings and grades for QUALCOMM Incorporated and Nova Ltd.:
Rating Comparison
QUALCOMM Incorporated Rating
- Rating: B+, indicating a very favorable assessment.
- Discounted Cash Flow Score: 4, showing a favorable outlook.
- ROE Score: 5, very favorable efficiency in generating profit.
- ROA Score: 5, very favorable asset utilization.
- Debt To Equity Score: 1, very unfavorable due to high risk.
- Overall Score: 3, reflecting a moderate overall rating.
Nova Ltd. Rating
- Rating: B-, also reflecting a very favorable assessment.
- Discounted Cash Flow Score: 3, indicating a moderate outlook.
- ROE Score: 4, favorable but lower than QUALCOMM.
- ROA Score: 5, equally very favorable asset utilization.
- Debt To Equity Score: 1, also very unfavorable financial risk.
- Overall Score: 3, also a moderate rating overall.
Which one is the best rated?
QUALCOMM holds a slightly higher rating (B+ vs. B-) and stronger scores in discounted cash flow and return on equity. However, both share equally moderate overall scores and very unfavorable debt-to-equity risk.
Scores Comparison
The comparison of scores for QUALCOMM and Nova Ltd. is as follows:
QUALCOMM Scores
- Altman Z-Score: 6.37, indicating a safe zone with low bankruptcy risk.
- Piotroski Score: 7, categorized as strong financial health.
Nova Ltd. Scores
- Altman Z-Score: 7.76, also in the safe zone, showing very low bankruptcy risk.
- Piotroski Score: 7, also indicating strong financial health.
Which company has the best scores?
Both QUALCOMM and Nova Ltd. have strong Piotroski Scores of 7. Nova Ltd. has a higher Altman Z-Score of 7.76 compared to QUALCOMM’s 6.37, suggesting slightly lower bankruptcy risk for Nova Ltd. based on the provided data.
Grades Comparison
The following is a detailed comparison of the recent grades assigned to QUALCOMM Incorporated and Nova Ltd.:
QUALCOMM Incorporated Grades
This table summarizes recent grades from reputable grading companies for QUALCOMM Incorporated:
| Grading Company | Action | New Grade | Date |
|---|---|---|---|
| Mizuho | Downgrade | Neutral | 2026-01-09 |
| Rosenblatt | Maintain | Buy | 2025-11-06 |
| B of A Securities | Maintain | Buy | 2025-11-06 |
| Mizuho | Maintain | Outperform | 2025-11-06 |
| Wells Fargo | Maintain | Underweight | 2025-11-06 |
| Piper Sandler | Maintain | Overweight | 2025-11-06 |
| UBS | Maintain | Neutral | 2025-11-06 |
| JP Morgan | Maintain | Overweight | 2025-11-04 |
| Citigroup | Maintain | Neutral | 2025-10-28 |
| Rosenblatt | Maintain | Buy | 2025-10-28 |
QUALCOMM’s grades show a mix of Buy, Neutral, and some Underweight ratings, with a recent downgrade to Neutral by Mizuho, indicating a cautious but generally positive outlook.
Nova Ltd. Grades
This table summarizes recent grades from reputable grading companies for Nova Ltd.:
| Grading Company | Action | New Grade | Date |
|---|---|---|---|
| B of A Securities | Maintain | Buy | 2026-01-13 |
| Jefferies | Maintain | Buy | 2025-12-15 |
| Evercore ISI Group | Maintain | Outperform | 2025-11-07 |
| Benchmark | Maintain | Buy | 2025-11-07 |
| Cantor Fitzgerald | Maintain | Overweight | 2025-06-24 |
| B of A Securities | Maintain | Buy | 2025-06-24 |
| Benchmark | Maintain | Buy | 2025-05-09 |
| Citigroup | Maintain | Buy | 2025-05-09 |
| B of A Securities | Maintain | Buy | 2025-04-16 |
| Cantor Fitzgerald | Maintain | Overweight | 2025-03-14 |
Nova Ltd. consistently receives Buy and Overweight ratings, with no downgrades, reflecting strong confidence from analysts.
Which company has the best grades?
Nova Ltd. has received uniformly positive ratings, predominantly Buy and Overweight, while QUALCOMM’s grades are more varied with some Neutral and Underweight opinions. This suggests stronger analyst confidence in Nova Ltd., which could influence investor sentiment and portfolio decisions accordingly.
Strengths and Weaknesses
The table below summarizes the key strengths and weaknesses of QUALCOMM Incorporated (QCOM) and Nova Ltd. (NVMI) based on their recent financial performance, profitability, innovation, global presence, and market share.
| Criterion | QUALCOMM Incorporated (QCOM) | Nova Ltd. (NVMI) |
|---|---|---|
| Diversification | High product segmentation with strong semiconductor and licensing revenues (QCT $38.4B, QTL $5.6B in 2025) | Limited product diversification, mainly focused on a single product line ($538M revenue in 2024) |
| Profitability | Favorable net margin (12.5%), ROIC (13.2%), and ROE (26.1%), but declining ROIC trend | Higher net margin (27.3%), solid ROIC (13.4%) and ROE (19.8%) with a positive ROIC growth trend |
| Innovation | Strong innovation foundation, but profitability slightly declining | Growing profitability indicates improving innovation or operational efficiency |
| Global presence | Well-established global presence with diverse markets | Smaller scale, less global reach compared to QCOM |
| Market Share | Significant market share in mobile and wireless tech | Smaller market share, niche semiconductor segment |
Key takeaways: QUALCOMM leads in scale, diversification, and global reach with strong profitability but faces a declining ROIC trend. Nova Ltd. shows promising growth and improving profitability but remains less diversified and smaller in scale. Investors should weigh QCOM’s established moat against NVMI’s growth potential and rising ROIC.
Risk Analysis
Below is a comparative risk assessment table for QUALCOMM Incorporated (QCOM) and Nova Ltd. (NVMI) based on the most recent data from 2025 and 2024 respectively:
| Metric | QUALCOMM Incorporated (QCOM) | Nova Ltd. (NVMI) |
|---|---|---|
| Market Risk | Beta 1.21 (moderate volatility) | Beta 1.83 (high volatility) |
| Debt level | D/E 0.7 (neutral), Debt/Assets 29.54% (favorable) | D/E 0.25 (favorable), Debt/Assets 16.98% (favorable) |
| Regulatory Risk | US tech sector, moderate regulatory scrutiny | Israel-based, with exposure to global semiconductor regulations |
| Operational Risk | Large scale operations with 49K employees, diversified segments | Smaller scale with 1.2K employees, focused on semiconductor metrology |
| Environmental Risk | Moderate, typical for semiconductor manufacturing | Moderate, similar industry exposure |
| Geopolitical Risk | US-based, relatively stable environment | Israeli company with exposure to Middle East geopolitical tensions |
Synthesis: Both companies exhibit strong financial health with safe Altman Z-scores and favorable Piotroski scores. NVMI’s higher beta signals greater market risk, while QCOM carries more debt but remains well-covered. Geopolitical risks are more significant for NVMI due to its location. Investors should weigh NVMI’s higher volatility and geopolitical sensitivity against QCOM’s larger scale and regulatory environment.
Which Stock to Choose?
QUALCOMM Incorporated (QCOM) shows a favorable income evolution with solid revenue growth, strong profitability, and a mostly favorable financial ratio profile. Its debt level is moderate with a good interest coverage, and it holds a very favorable overall rating of B+.
Nova Ltd. (NVMI) demonstrates robust income growth and high profitability, supported by mostly favorable financial ratios. The company maintains low debt, excellent interest coverage, and also holds a very favorable rating of B-, despite some unfavorable valuation ratios.
Investors with a risk-averse profile favoring stable profitability and strong financial health might find QUALCOMM’s consistent value creation and solid ratings appealing. Conversely, growth-oriented investors could see Nova’s accelerating income and improving profitability as attractive despite higher valuation multiples.
Disclaimer: Investment carries a risk of loss of initial capital. The past performance is not a reliable indicator of future results. Be sure to understand risks before making an investment decision.
Go Further
I encourage you to read the complete analyses of QUALCOMM Incorporated and Nova Ltd. to enhance your investment decisions: