In the fast-evolving semiconductor industry, QUALCOMM Incorporated and Monolithic Power Systems, Inc. stand out as key innovators shaping the future of technology. Both companies operate in overlapping markets, focusing on advanced chip solutions that power wireless communication and power electronics. This comparison explores their strategies and market positions to help you decide which company offers the most compelling investment opportunity today. Let’s dive in and uncover the most interesting choice for your portfolio.
Table of contents
Companies Overview
I will begin the comparison between QUALCOMM and Monolithic Power Systems by providing an overview of these two companies and their main differences.
QUALCOMM Overview
QUALCOMM Incorporated focuses on developing and commercializing foundational wireless technologies globally. It operates through three segments: Qualcomm CDMA Technologies (QCT), Qualcomm Technology Licensing (QTL), and Qualcomm Strategic Initiatives (QSI). The company supplies integrated circuits and licenses patents for 3G, 4G, and 5G communications, investing in emerging sectors such as AI, automotive, and IoT. QUALCOMM is headquartered in San Diego, CA, with a market cap of $175B and about 49K employees.
Monolithic Power Systems Overview
Monolithic Power Systems, Inc. designs and markets semiconductor-based power electronics solutions for computing, automotive, industrial, and consumer markets. Its product range includes DC-to-DC integrated circuits and lighting control ICs used in electronic devices and LCD backlighting. The company sells through distributors and directly to OEMs worldwide. Based in Kirkland, WA, Monolithic Power has a market cap of $50B and employs approximately 4K people.
Key similarities and differences
Both QUALCOMM and Monolithic Power Systems operate in the semiconductor industry, providing technology solutions essential for electronic devices. QUALCOMM emphasizes wireless communication technologies and intellectual property licensing, with diversified investments in emerging tech. In contrast, Monolithic Power Systems specializes in power management ICs and lighting controls, focusing on voltage regulation and energy efficiency across multiple end markets. Their business models differ in product focus and revenue streams, reflecting distinct market roles.
Income Statement Comparison
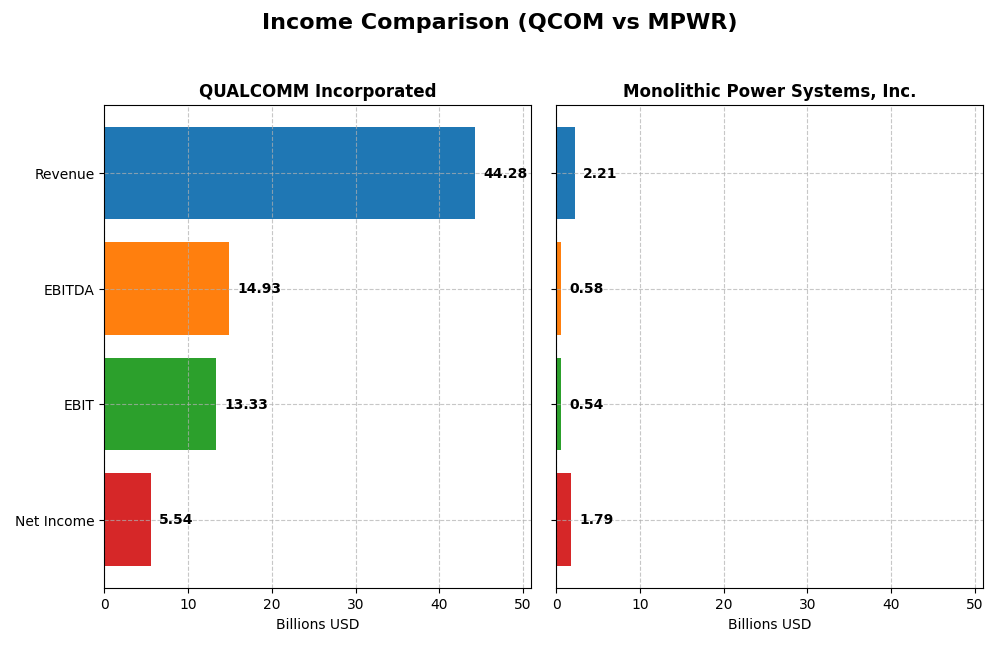
This table compares key income statement metrics for QUALCOMM Incorporated and Monolithic Power Systems, Inc. for their most recent fiscal years.
| Metric | QUALCOMM Incorporated | Monolithic Power Systems, Inc. |
|---|---|---|
| Market Cap | 175.4B | 49.6B |
| Revenue | 44.28B | 2.21B |
| EBITDA | 14.93B | 576M |
| EBIT | 13.33B | 539M |
| Net Income | 5.54B | 1.79B |
| EPS | 5.06 | 36.76 |
| Fiscal Year | 2025 | 2024 |
Income Statement Interpretations
QUALCOMM Incorporated
QUALCOMM’s revenue exhibited an overall upward trend from 2021 to 2025, growing from $33.6B to $44.3B, though net income declined from $9.0B to $5.5B in the same period. Margins generally remained favorable, with a gross margin around 55% and EBIT margin near 30%. In 2025, revenue growth was positive at 13.7%, but net margin and EPS contracted significantly, signaling margin pressure despite top-line gains.
Monolithic Power Systems, Inc.
Monolithic Power Systems showed strong revenue growth from $844M in 2020 to $2.2B in 2024, accompanied by a substantial increase in net income from $164M to $1.79B. Margins improved markedly, with a gross margin around 55% and an exceptional net margin approaching 81% in 2024. The latest year saw 21.2% revenue growth and robust expansions in net margin and EPS, reflecting strong operational leverage.
Which one has the stronger fundamentals?
Monolithic Power Systems demonstrates stronger fundamentals with consistent double-digit revenue growth, significant net income expansion, and superior margin improvements over the period. QUALCOMM, while generating higher absolute revenue and maintaining solid gross and EBIT margins, faced declining net income and margin compression recently. Overall, Monolithic Power’s financial trajectory appears more favorable in terms of growth and profitability metrics.
Financial Ratios Comparison
The table below compares key financial ratios for QUALCOMM Incorporated (QCOM) and Monolithic Power Systems, Inc. (MPWR) based on their most recent fiscal year data.
| Ratios | QUALCOMM Incorporated (QCOM) FY 2025 | Monolithic Power Systems, Inc. (MPWR) FY 2024 |
|---|---|---|
| ROE | 26.1% | 56.8% |
| ROIC | 13.2% | 16.2% |
| P/E | 32.7 | 16.1 |
| P/B | 8.54 | 9.14 |
| Current Ratio | 2.82 | 5.31 |
| Quick Ratio | 2.10 | 3.89 |
| D/E (Debt-to-Equity) | 0.70 | 0.005 |
| Debt-to-Assets | 29.5% | 0.44% |
| Interest Coverage | 18.6 | 0 |
| Asset Turnover | 0.88 | 0.61 |
| Fixed Asset Turnover | 9.44 | 4.17 |
| Payout Ratio | 68.7% | 13.5% |
| Dividend Yield | 2.10% | 0.84% |
Interpretation of the Ratios
QUALCOMM Incorporated
QUALCOMM shows mostly strong financial ratios with favorable net margin (12.51%), ROE (26.13%), and ROIC (13.19%), supported by solid liquidity ratios like a current ratio of 2.82. However, valuation metrics such as PE (32.7) and PB (8.54) appear elevated, suggesting potential overvaluation risks. The company pays dividends, with a 2.1% yield backed by steady payout coverage, but investors should monitor payout sustainability given market conditions.
Monolithic Power Systems, Inc.
Monolithic Power Systems exhibits very strong profitability ratios, including a high net margin of 80.95% and ROE of 56.8%, alongside excellent debt metrics with a debt-to-assets ratio of 0.44%. Despite a favorable overall profile, its current ratio of 5.31 is marked unfavorable, hinting at potential asset underutilization. Dividends yield 0.84%, lower than peers, indicating cautious distribution or reinvestment strategy.
Which one has the best ratios?
Both companies present favorable global ratio opinions with a majority of strong metrics. QUALCOMM offers balanced profitability and liquidity, albeit at higher valuation multiples, while Monolithic Power Systems excels in margins and leverage but has a weaker current ratio and lower dividend yield. The choice depends on investor preference for valuation versus operational efficiency.
Strategic Positioning
This section compares the strategic positioning of QUALCOMM and Monolithic Power Systems, focusing on market position, key segments, and exposure to technological disruption:
QUALCOMM
- Leading market position in semiconductors with significant competitive pressure.
- Key segments include QCT (integrated circuits for wireless), QTL (technology licensing), and QSI (early-stage investments).
- Exposure to disruption through investments in 5G, AI, automotive, IoT, and new communication technologies.
Monolithic Power Systems
- Smaller market cap in semiconductors, facing competitive dynamics in power electronics.
- Focuses on DC to DC power conversion and lighting control ICs for various electronic systems.
- Exposure mainly through power electronics innovation in computing, automotive, and consumer markets.
QUALCOMM vs Monolithic Power Systems Positioning
QUALCOMM pursues a diversified strategy across wireless technologies, licensing, and strategic initiatives, leveraging scale but facing complexity. Monolithic Power Systems concentrates on semiconductor power solutions, offering focused innovation but narrower market reach.
Which has the best competitive advantage?
Monolithic Power Systems shows a very favorable moat with growing ROIC, indicating durable competitive advantage. QUALCOMM creates value but experiences declining profitability, reflecting a slightly favorable moat with some risks to sustainability.
Stock Comparison
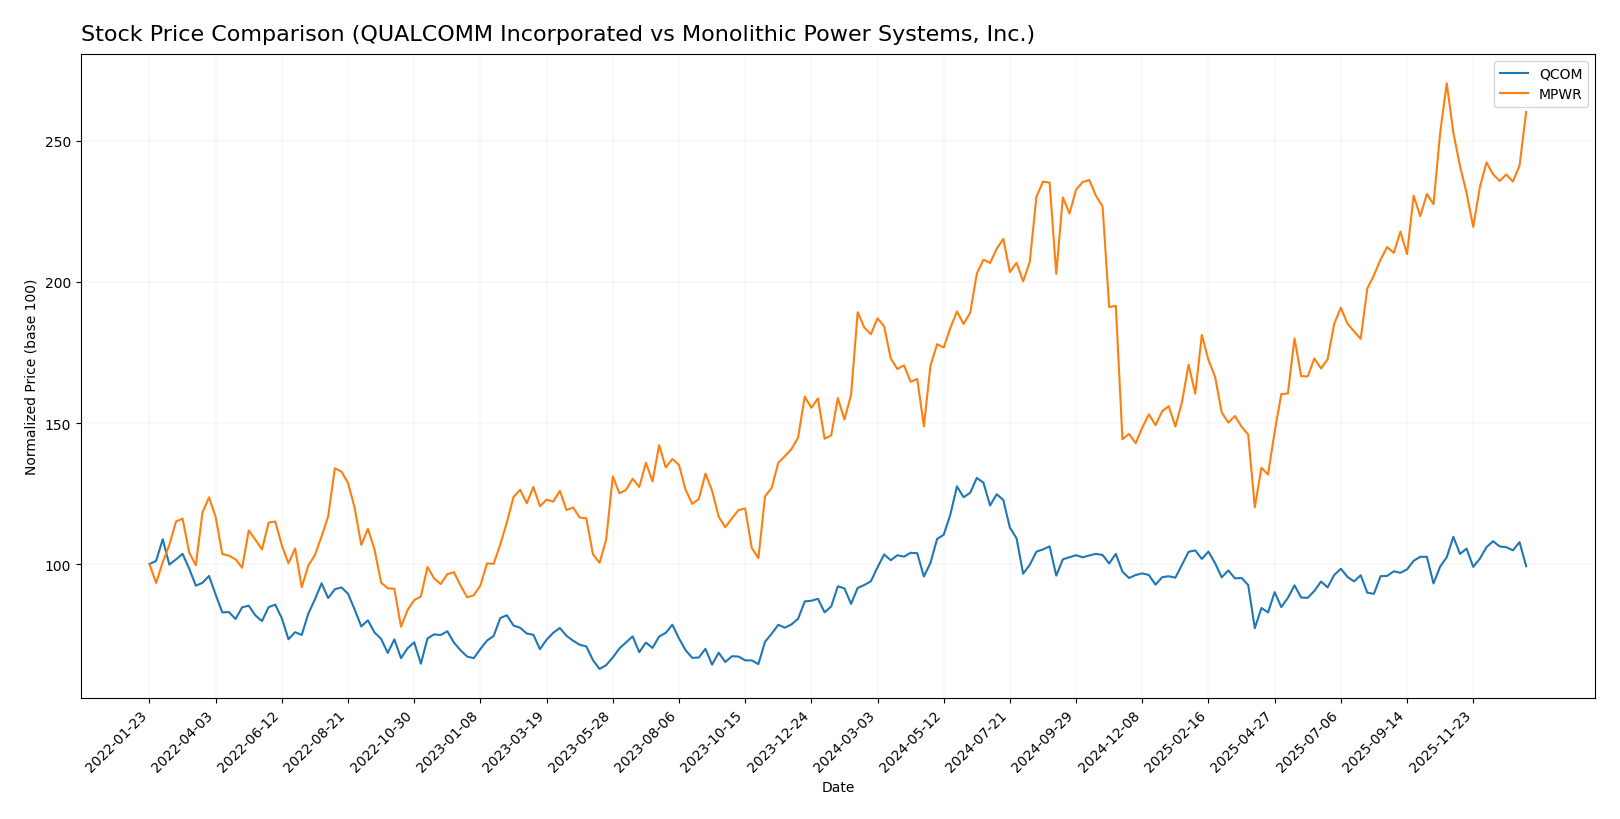
The stock price movements of QUALCOMM Incorporated (QCOM) and Monolithic Power Systems, Inc. (MPWR) over the past 12 months reveal contrasting dynamics, marked by significant gains for MPWR and moderate appreciation for QCOM, alongside varied recent trading volume behaviors.
Trend Analysis
QUALCOMM’s stock showed a bullish trend over the past year, rising 5.66% with accelerating momentum, peaking at 215.33 and bottoming at 127.46, despite a recent short-term decline of 9.52%.
Monolithic Power Systems exhibited a strong bullish trend with a 43.43% increase over the year, also accelerating, hitting a high of 1074.91 and a low of 477.39, with a recent mild upward trend of 2.92%.
Comparatively, MPWR delivered the highest market performance over the last 12 months, outperforming QCOM by a wide margin in price appreciation and trend strength.
Target Prices
Analysts present a confident consensus on target prices for QUALCOMM Incorporated and Monolithic Power Systems, Inc.
| Company | Target High | Target Low | Consensus |
|---|---|---|---|
| QUALCOMM Incorporated | 210 | 165 | 185.71 |
| Monolithic Power Systems, Inc. | 1375 | 1025 | 1187.5 |
The target consensus for QUALCOMM is about 13% above its current price of $163.81, indicating moderate upside potential. Monolithic Power Systems shows a stronger upside with a consensus target roughly 15% above its current price of $1034.84, reflecting bullish expectations from analysts.
Analyst Opinions Comparison
This section compares analysts’ ratings and grades for QUALCOMM Incorporated and Monolithic Power Systems, Inc.:
Rating Comparison
QUALCOMM Rating
- Rating: B+, classified as Very Favorable.
- Discounted Cash Flow Score: 4, indicating a Favorable valuation based on future cash flows.
- ROE Score: 5, reflecting very efficient profit generation from equity.
- ROA Score: 5, demonstrating very effective use of assets to generate earnings.
- Debt To Equity Score: 1, signaling a Very Unfavorable higher financial risk.
- Overall Score: 3, categorized as Moderate overall financial standing.
Monolithic Power Systems Rating
- Rating: A-, classified as Very Favorable.
- Discounted Cash Flow Score: 3, considered Moderate for valuation.
- ROE Score: 5, also showing very efficient profit generation.
- ROA Score: 5, similarly very effective asset utilization.
- Debt To Equity Score: 5, indicating a Very Favorable low financial risk.
- Overall Score: 4, rated Favorable for overall financial health.
Which one is the best rated?
Based strictly on the provided data, Monolithic Power Systems holds a higher overall rating (A- vs. B+) and a better overall score (4 vs. 3) compared to QUALCOMM. It also scores notably better on debt-to-equity, suggesting a stronger balance sheet.
Scores Comparison
Here is a comparison of the financial scores for QUALCOMM (QCOM) and Monolithic Power Systems (MPWR):
QCOM Scores
- Altman Z-Score: 6.37, indicating a safe zone with low bankruptcy risk.
- Piotroski Score: 7, showing strong financial health.
MPWR Scores
- Altman Z-Score: 46.83, indicating a safe zone with very low bankruptcy risk.
- Piotroski Score: 4, reflecting average financial health.
Which company has the best scores?
MPWR has a significantly higher Altman Z-Score, indicating stronger financial stability, while QCOM has a notably higher Piotroski Score, suggesting stronger overall financial strength. Each excels in a different score.
Grades Comparison
Here is the comparison of recent grades and ratings for QUALCOMM Incorporated and Monolithic Power Systems, Inc.:
QUALCOMM Incorporated Grades
This table summarizes recent grades and rating actions from leading financial institutions for QUALCOMM Incorporated:
| Grading Company | Action | New Grade | Date |
|---|---|---|---|
| Mizuho | Downgrade | Neutral | 2026-01-09 |
| Rosenblatt | Maintain | Buy | 2025-11-06 |
| B of A Securities | Maintain | Buy | 2025-11-06 |
| Mizuho | Maintain | Outperform | 2025-11-06 |
| Wells Fargo | Maintain | Underweight | 2025-11-06 |
| Piper Sandler | Maintain | Overweight | 2025-11-06 |
| UBS | Maintain | Neutral | 2025-11-06 |
| JP Morgan | Maintain | Overweight | 2025-11-04 |
| Citigroup | Maintain | Neutral | 2025-10-28 |
| Rosenblatt | Maintain | Buy | 2025-10-28 |
Recent grades for QUALCOMM show a mix of Buy and Neutral ratings, with one recent downgrade by Mizuho to Neutral, indicating a cautious stance among analysts.
Monolithic Power Systems, Inc. Grades
This table presents recent grades and rating actions from reputable financial firms for Monolithic Power Systems, Inc.:
| Grading Company | Action | New Grade | Date |
|---|---|---|---|
| Truist Securities | Maintain | Buy | 2025-12-19 |
| Citigroup | Maintain | Buy | 2025-11-03 |
| TD Cowen | Maintain | Buy | 2025-10-31 |
| Keybanc | Maintain | Overweight | 2025-10-31 |
| Rosenblatt | Maintain | Neutral | 2025-10-31 |
| Keybanc | Maintain | Overweight | 2025-10-23 |
| Wells Fargo | Maintain | Equal Weight | 2025-10-20 |
| Stifel | Maintain | Buy | 2025-10-17 |
| Wolfe Research | Upgrade | Outperform | 2025-10-14 |
| Citigroup | Maintain | Buy | 2025-10-03 |
Monolithic Power Systems maintains predominantly Buy and Overweight grades, with one notable recent upgrade to Outperform by Wolfe Research, reflecting generally positive analyst sentiment.
Which company has the best grades?
Both QUALCOMM and Monolithic Power Systems have a consensus “Buy” rating, but Monolithic Power Systems shows a higher concentration of Buy and Overweight grades with an upgrade to Outperform, suggesting stronger analyst confidence. This could influence investor perception toward more optimistic growth expectations for Monolithic Power, while QUALCOMM’s mixed ratings imply a more cautious outlook.
Strengths and Weaknesses
Below is a comparison of key strengths and weaknesses for QUALCOMM Incorporated (QCOM) and Monolithic Power Systems, Inc. (MPWR) based on their latest financial and strategic data.
| Criterion | QUALCOMM Incorporated (QCOM) | Monolithic Power Systems, Inc. (MPWR) |
|---|---|---|
| Diversification | Strong product mix with major revenue from QCT ($38.4B) and QTL ($5.6B) segments | Focused on DC to DC products ($1.72B) and lighting controls ($102M); less diversified |
| Profitability | Net margin 12.5%, ROIC 13.2%, positive value creation but declining ROIC trend | Very high net margin 80.95%, ROIC 16.2%, growing ROIC trend indicating durable profitability |
| Innovation | Established leader in wireless tech and chipsets, consistent R&D investment | Rapid innovation in power management ICs, strong competitive advantage with growing profitability |
| Global presence | Broad global footprint with strong licensing and chipset sales worldwide | Growing presence, mostly in specialized power management markets, less global breadth |
| Market Share | Large market share in mobile chipsets and licensing | Niche but expanding market share in power electronics, leadership in DC to DC converters |
Key takeaways: QUALCOMM offers strong diversification and global reach but faces a declining ROIC trend, signaling caution. Monolithic Power Systems shows exceptional profitability growth and a very favorable moat, though with a narrower product focus. Investors should weigh diversification against growth durability and profitability trends.
Risk Analysis
Below is a comparative analysis of key risks for QUALCOMM Incorporated (QCOM) and Monolithic Power Systems, Inc. (MPWR) based on the most recent data:
| Metric | QUALCOMM Incorporated (QCOM) | Monolithic Power Systems, Inc. (MPWR) |
|---|---|---|
| Market Risk | Beta 1.21, moderate volatility | Beta 1.46, higher volatility |
| Debt level | Debt-to-Equity 0.7 (neutral), Debt-to-Assets 29.54% (favorable) | Debt-to-Equity 0.01 (favorable), Debt-to-Assets 0.44% (favorable) |
| Regulatory Risk | High, due to global telecom patent licensing and government contracts | Moderate, exposure to international markets and semiconductor regulations |
| Operational Risk | High, complex supply chain and dependency on 5G tech adoption | Moderate, smaller scale but reliant on innovation in power ICs |
| Environmental Risk | Moderate, semiconductor manufacturing impact | Moderate, focus on energy efficiency but semiconductor production concerns |
| Geopolitical Risk | High, global operations including sensitive tech exports | Moderate, international sales but less exposure to sensitive defense sectors |
The most likely and impactful risks for QUALCOMM stem from regulatory scrutiny and geopolitical tensions affecting its licensing and government contracts. For Monolithic Power Systems, operational innovation and supply chain resilience are critical, with higher market volatility reflecting sensitivity to semiconductor cycles. Both companies maintain favorable debt profiles, reducing financial risk.
Which Stock to Choose?
QUALCOMM Incorporated (QCOM) shows a generally favorable income evolution with 13.66% revenue growth in 2025 and solid profitability ratios such as a 26.13% ROE and 13.19% ROIC. Its debt profile is moderate with a net debt to EBITDA of 0.62 and a strong current ratio of 2.82. The company holds a very favorable overall rating of B+.
Monolithic Power Systems, Inc. (MPWR) demonstrates robust income growth with a 21.2% revenue increase in 2024 and exceptional profitability metrics including a 56.8% ROE and 16.22% ROIC. Debt levels are minimal with a debt-to-equity ratio near zero and a high current ratio of 5.31. MPWR’s overall rating is very favorable at A-.
Considering ratings and financial performance, MPWR’s very favorable rating and strong income growth might appeal to growth-oriented and risk-tolerant investors seeking companies with increasing profitability. Conversely, QCOM’s stable profitability and moderate leverage could be seen as more suitable for investors valuing consistent performance and balance sheet strength.
Disclaimer: Investment carries a risk of loss of initial capital. The past performance is not a reliable indicator of future results. Be sure to understand risks before making an investment decision.
Go Further
I encourage you to read the complete analyses of QUALCOMM Incorporated and Monolithic Power Systems, Inc. to enhance your investment decisions: