In today’s fast-evolving technology sector, monday.com Ltd. (MNDY) and ServiceTitan, Inc. (TTAN) stand out as influential players in the software application industry. Both companies offer innovative cloud-based solutions that streamline business operations, targeting overlapping markets such as project management and field service management. This comparison explores their strategic approaches and growth potential, helping you identify which company might be the most compelling addition to your investment portfolio.
Table of contents
Companies Overview
I will begin the comparison between monday.com Ltd. and ServiceTitan, Inc. by providing an overview of these two companies and their main differences.
monday.com Ltd. Overview
monday.com Ltd. develops cloud-based software applications centered on its Work OS, a visual operating system designed for work management. The company offers modular tools for marketing, CRM, project management, and software development, serving organizations, educational institutions, and government entities. Headquartered in Tel Aviv, Israel, monday.com is positioned as a versatile platform in the global software application industry.
ServiceTitan, Inc. Overview
ServiceTitan, Inc. specializes in software solutions for managing field service operations related to installation, maintenance, and servicing infrastructure in residential and commercial buildings. Founded in 2008 and based in Glendale, California, the company focuses on streamlining service workflows for its clients, operating within the software application sector. ServiceTitan is publicly traded on NASDAQ since late 2024.
Key similarities and differences
Both monday.com and ServiceTitan operate in the software application industry and are publicly traded on NASDAQ. monday.com emphasizes a broad work management platform with modular applications, while ServiceTitan targets niche field service management for infrastructure services. monday.com is headquartered in Israel with 2,508 employees, contrasting with ServiceTitan’s U.S. base and larger workforce of 3,049, reflecting different market focuses and operational scales.
Income Statement Comparison
The table below presents a side-by-side comparison of key income statement metrics for monday.com Ltd. and ServiceTitan, Inc. for their most recent fiscal years.

| Metric | monday.com Ltd. (MNDY) | ServiceTitan, Inc. (TTAN) |
|---|---|---|
| Market Cap | 7.3B | 9.5B |
| Revenue | 972M | 772M |
| EBITDA | 58M | -141M |
| EBIT | 40M | -221M |
| Net Income | 32M | -239M |
| EPS | 0.65 | -8.53 |
| Fiscal Year | 2024 | 2025 |
Income Statement Interpretations
monday.com Ltd.
monday.com Ltd. has shown strong revenue growth, reaching $972M in 2024 from $161M in 2020, with net income turning positive to $32M in 2024 after prior losses. Gross margin remains high at 89.33%, indicating efficient cost control, while EBIT margin is stable around 4%. The most recent year saw a significant rebound in profitability and margin improvement.
ServiceTitan, Inc.
ServiceTitan, Inc. experienced revenue growth to $772M in 2025 from $468M in 2023, but net income remained negative at -$239M in 2025, despite some improvement from -$269M in 2023. Gross margin is favorable at 64.9%, but EBIT and net margins are negative and deteriorated in 2025. Operating expenses increased faster than revenue, impacting profitability.
Which one has the stronger fundamentals?
monday.com Ltd. exhibits stronger fundamentals with sustained revenue growth, positive net income in the latest year, and high gross margins coupled with improving profitability metrics. ServiceTitan, while growing revenue, continues to report significant losses and unfavorable EBIT and net margins, signaling ongoing challenges in expense control and profitability despite favorable gross margins.
Financial Ratios Comparison
The table below presents a side-by-side comparison of key financial ratios for monday.com Ltd. (MNDY) and ServiceTitan, Inc. (TTAN) based on the most recent fiscal year data available.
| Ratios | monday.com Ltd. (MNDY) | ServiceTitan, Inc. (TTAN) |
|---|---|---|
| ROE | 3.14% | -16.44% |
| ROIC | -1.73% | -14.25% |
| P/E | 363 | -18.12 |
| P/B | 11.41 | 2.98 |
| Current Ratio | 2.66 | 3.74 |
| Quick Ratio | 2.66 | 3.74 |
| D/E | 0.10 | 0.11 |
| Debt-to-Assets | 6.29% | 9.35% |
| Interest Coverage | 0 | -14.82 |
| Asset Turnover | 0.58 | 0.44 |
| Fixed Asset Turnover | 7.13 | 9.57 |
| Payout Ratio | 0 | 0 |
| Dividend Yield | 0 | 0 |
Interpretation of the Ratios
monday.com Ltd.
monday.com shows a mixed profile with strong liquidity and low leverage, indicated by favorable current and quick ratios and a debt-to-equity ratio of 0.1. However, profitability metrics like ROE (3.14%) and ROIC (-1.73%) are unfavorable, alongside a high P/E of 363 and P/B of 11.41, signaling high valuation risks. The company does not pay dividends, likely prioritizing growth and reinvestment.
ServiceTitan, Inc.
ServiceTitan’s ratios are mostly unfavorable, with significant negative net margin (-30.98%) and ROE (-16.44%), though its weighted average cost of capital (4.85%) and debt measures are favorable. The current ratio is marked unfavorable despite a strong quick ratio. The company also pays no dividends, consistent with a high-growth or reinvestment strategy amid losses and operational challenges.
Which one has the best ratios?
Comparing both, monday.com presents a more balanced financial position with several favorable liquidity and leverage ratios, while ServiceTitan faces more profitability and operational difficulties. monday.com’s valuation appears stretched, but its overall ratio profile is neutral versus ServiceTitan’s slightly unfavorable stance, reflecting higher risks in ServiceTitan’s current financial health.
Strategic Positioning
This section compares the strategic positioning of monday.com Ltd. and ServiceTitan, Inc., focusing on Market position, Key segments, and Exposure to technological disruption:
monday.com Ltd.
- Competes globally in software applications with a market cap of 7.3B, facing tech sector pressure.
- Focuses on Work OS platform with modular work management tools across marketing, CRM, project management.
- Operates cloud-based software with modular building blocks, exposed to ongoing tech innovation risks.
ServiceTitan, Inc.
- US-based with a 9.5B market cap, operating in software for field service industry, under competitive tech pressure.
- Key segments are platform and subscription software supporting installation and maintenance of residential and commercial infrastructure.
- Software for field services requires adaptation to evolving tech but less exposed to broad software disruption.
monday.com Ltd. vs ServiceTitan, Inc. Positioning
monday.com pursues a diversified global SaaS approach with modular tools, while ServiceTitan concentrates on US field service software. monday.com’s broad applications offer varied revenue streams; ServiceTitan’s niche focus aligns with specialized infrastructure services, influencing competitive dynamics.
Which has the best competitive advantage?
Both companies are currently shedding value as ROIC is below WACC, but monday.com shows a growing ROIC trend, indicating improving profitability, whereas ServiceTitan’s stable ROIC suggests less dynamic value creation.
Stock Comparison
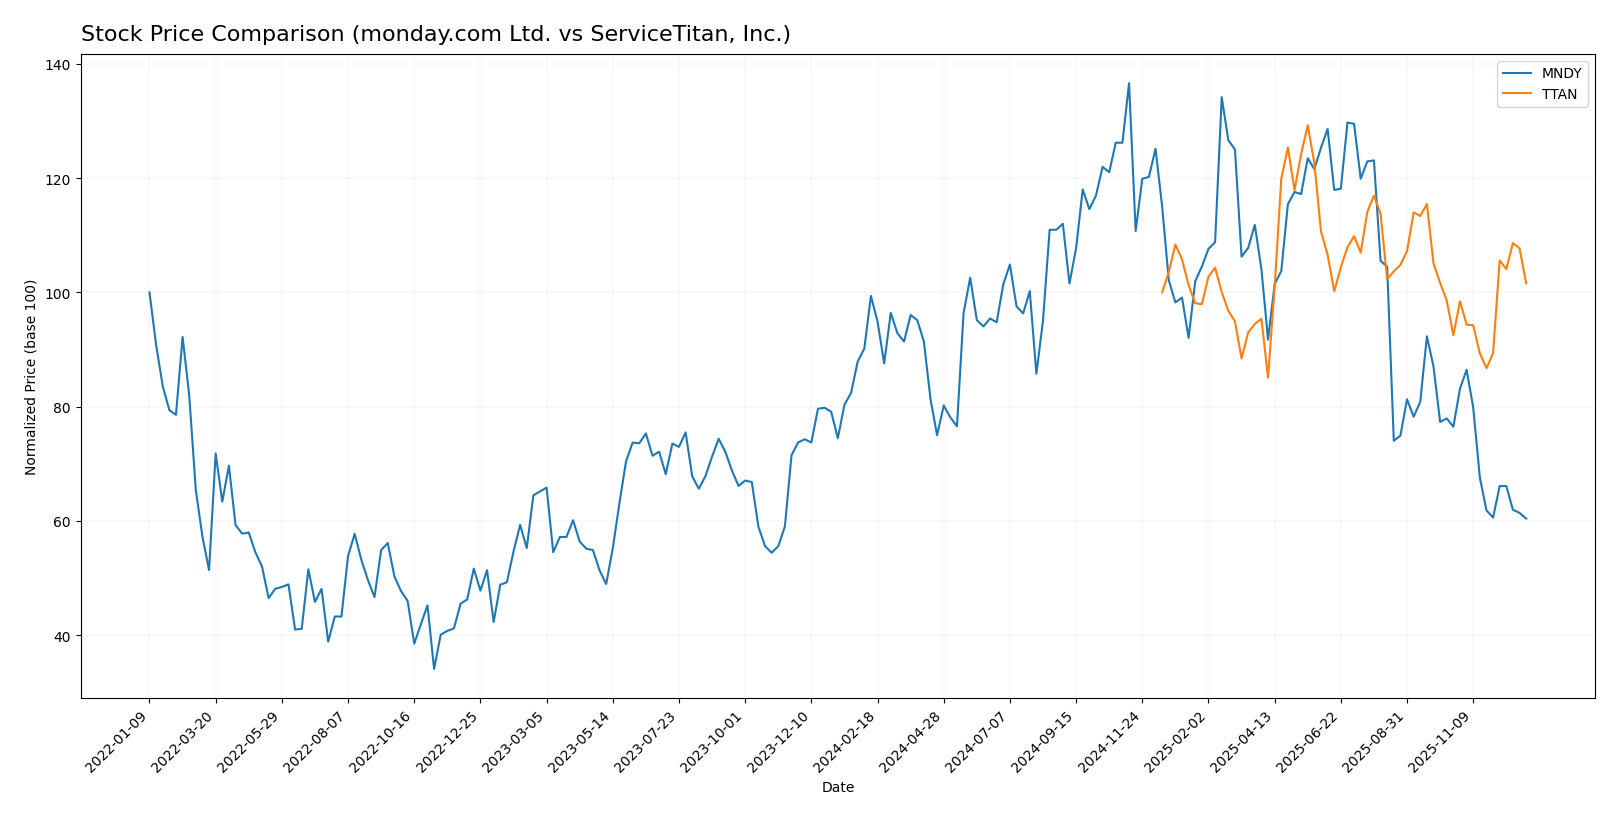
The stock price dynamics over the past year reveal a pronounced decline for monday.com Ltd. (MNDY) contrasting with a mild upward movement for ServiceTitan, Inc. (TTAN), highlighting distinct trading behaviors and market responses.
Trend Analysis
monday.com Ltd. (MNDY) experienced a bearish trend with a -39.21% price change over the past 12 months, showing deceleration in its decline and a high volatility reflected by a 45.17 standard deviation. The stock’s highest and lowest prices were 324.31 and 143.42 respectively.
ServiceTitan, Inc. (TTAN) showed a marginally bullish trend with a 1.59% price increase over the same period, accompanied by accelerating momentum and lower volatility at a 9.85 standard deviation. The stock traded between 85.07 and 129.26.
Comparing the two, TTAN delivered the highest market performance with a slight positive gain, whereas MNDY showed a significant loss in value over the past year.
Target Prices
The current analyst consensus points to significant upside potential for both monday.com Ltd. and ServiceTitan, Inc.
| Company | Target High | Target Low | Consensus |
|---|---|---|---|
| monday.com Ltd. | 330 | 202 | 277.18 |
| ServiceTitan, Inc. | 145 | 125 | 135 |
Analysts expect monday.com Ltd.’s stock to nearly double from its current price of $143.42, while ServiceTitan, Inc.’s consensus target of $135 suggests a strong recovery from its current $101.59 price.
Analyst Opinions Comparison
This section compares analysts’ ratings and grades for monday.com Ltd. and ServiceTitan, Inc.:
Rating Comparison
monday.com Ltd. Rating
- Rating: B-, considered very favorable by analysts.
- Discounted Cash Flow Score: 4, indicating a favorable valuation.
- ROE Score: 2, showing moderate efficiency in generating profit.
- ROA Score: 3, indicating moderate asset utilization.
- Debt To Equity Score: 3, reflecting moderate financial risk.
- Overall Score: 2, a moderate overall financial standing.
ServiceTitan, Inc. Rating
- Rating: C-, also considered very favorable by analysts.
- Discounted Cash Flow Score: 1, indicating a very unfavorable valuation.
- ROE Score: 1, showing very unfavorable efficiency.
- ROA Score: 1, indicating very unfavorable asset utilization.
- Debt To Equity Score: 3, also reflecting moderate financial risk.
- Overall Score: 1, a very unfavorable overall financial standing.
Which one is the best rated?
Based strictly on the data, monday.com Ltd. holds a better overall rating and financial scores than ServiceTitan, Inc. It scores higher across discounted cash flow, ROE, ROA, and overall metrics, indicating a more favorable analyst view.
Scores Comparison
The scores comparison between monday.com Ltd. and ServiceTitan, Inc. is as follows:
monday.com Ltd. Scores
- Altman Z-Score: 7.39, indicating a safe zone, low bankruptcy risk.
- Piotroski Score: 5, reflecting average financial strength.
ServiceTitan, Inc. Scores
- Altman Z-Score: 19.00, indicating a safe zone, very low bankruptcy risk.
- Piotroski Score: 6, reflecting average financial strength.
Which company has the best scores?
ServiceTitan, Inc. has a higher Altman Z-Score (19.00 vs. 7.39) and a slightly better Piotroski Score (6 vs. 5) than monday.com Ltd., suggesting stronger financial stability based on these metrics.
Grades Comparison
Here is a comparison of the most recent reliable grades assigned to monday.com Ltd. and ServiceTitan, Inc.:
monday.com Ltd. Grades
The table below summarizes the latest grades for monday.com Ltd. from reputable grading companies:
| Grading Company | Action | New Grade | Date |
|---|---|---|---|
| Citigroup | Maintain | Buy | 2025-12-23 |
| Tigress Financial | Maintain | Buy | 2025-12-11 |
| Morgan Stanley | Maintain | Overweight | 2025-11-11 |
| Piper Sandler | Maintain | Overweight | 2025-11-11 |
| B of A Securities | Maintain | Neutral | 2025-11-11 |
| JP Morgan | Maintain | Overweight | 2025-11-11 |
| Canaccord Genuity | Maintain | Buy | 2025-11-11 |
| Jefferies | Maintain | Buy | 2025-11-11 |
| Wells Fargo | Maintain | Overweight | 2025-11-11 |
| Baird | Maintain | Outperform | 2025-11-11 |
Grades for monday.com Ltd. predominantly indicate a positive outlook, with multiple “Buy,” “Overweight,” and “Outperform” ratings maintained by major firms.
ServiceTitan, Inc. Grades
The table below summarizes the latest grades for ServiceTitan, Inc. from reputable grading companies:
| Grading Company | Action | New Grade | Date |
|---|---|---|---|
| TD Cowen | Maintain | Buy | 2025-12-05 |
| Piper Sandler | Maintain | Overweight | 2025-12-05 |
| BMO Capital | Maintain | Outperform | 2025-12-05 |
| Morgan Stanley | Maintain | Equal Weight | 2025-12-05 |
| BMO Capital | Maintain | Outperform | 2025-11-20 |
| Piper Sandler | Maintain | Overweight | 2025-09-19 |
| Stifel | Maintain | Buy | 2025-09-19 |
| Wells Fargo | Maintain | Overweight | 2025-09-19 |
| Canaccord Genuity | Maintain | Buy | 2025-09-19 |
| Citigroup | Maintain | Neutral | 2025-09-09 |
ServiceTitan, Inc.’s grades mostly show a favorable consensus, with several “Buy,” “Overweight,” and “Outperform” ratings, alongside a few neutral or equal weight assessments.
Which company has the best grades?
Both monday.com Ltd. and ServiceTitan, Inc. have received mostly positive grades from credible analysts, with frequent “Buy,” “Overweight,” and “Outperform” ratings. monday.com Ltd. shows slightly more consistency in higher-tier grades, which may suggest stronger analyst confidence. Investors might interpret this as a signal of potentially better relative momentum or stability in analyst sentiment for monday.com Ltd.
Strengths and Weaknesses
Below is a comparison of key strengths and weaknesses for monday.com Ltd. (MNDY) and ServiceTitan, Inc. (TTAN) based on their recent financial and operational data.
| Criterion | monday.com Ltd. (MNDY) | ServiceTitan, Inc. (TTAN) |
|---|---|---|
| Diversification | Moderate platform flexibility, focused on work OS solutions | Strong focus on service management software; less diversified product mix |
| Profitability | Slightly unfavorable; ROIC -1.73%, net margin 3.33% | Unfavorable; ROIC -14.25%, net margin -30.98% |
| Innovation | Growing ROIC trend indicates improving efficiency | Stable ROIC trend but value destroying; innovation impact unclear |
| Global presence | Expanding user base with growing international adoption | Primarily North American market focus |
| Market Share | Competing in a crowded SaaS collaboration space | Leading in service management software niche |
Key takeaways: Both companies currently struggle with profitability and value creation, with monday.com showing improving operational efficiency while ServiceTitan faces sustained losses. Investors should weigh monday.com’s growth trajectory against ServiceTitan’s niche market position and risk profile carefully.
Risk Analysis
The table below summarizes key risks for monday.com Ltd. (MNDY) and ServiceTitan, Inc. (TTAN) based on their most recent financial and market data.
| Metric | monday.com Ltd. (MNDY) | ServiceTitan, Inc. (TTAN) |
|---|---|---|
| Market Risk | Beta 1.26, high valuation (PE 363) increases volatility risk | Beta -0.85, negative earnings but lower valuation risk |
| Debt level | Low debt-to-equity (0.1), favorable leverage | Low debt-to-equity (0.11), manageable debt |
| Regulatory Risk | Moderate, US and international operations | Moderate, primarily US-focused but regulated software sector |
| Operational Risk | Moderate due to software development and market competition | High, negative margins and cash flow concerns |
| Environmental Risk | Low, technology sector with minimal direct impact | Low, similar sector profile |
| Geopolitical Risk | Exposure to Israel-based headquarters and global markets | US-based with less geopolitical exposure |
monday.com faces market risk from its high valuation and growth expectations, while maintaining solid debt management and liquidity. ServiceTitan’s biggest concerns are operational risks due to sustained negative profitability and cash flow, despite low debt. Both companies are relatively insulated from environmental and geopolitical risks, but investors should watch valuation and profitability trends closely.
Which Stock to Choose?
monday.com Ltd. (MNDY) shows a favorable income evolution with strong revenue and profit growth, yet its profitability ratios like ROE and ROIC remain unfavorable. The company maintains low debt levels and a solid current ratio, supported by a very favorable B- rating.
ServiceTitan, Inc. (TTAN) exhibits favorable revenue growth but suffers from significant negative profitability and operating margins. Despite moderate debt metrics and a safe-zone Altman Z-Score, its overall financial ratios and rating (C-) appear slightly unfavorable.
For investors, MNDY might appear more attractive for those prioritizing growth and improving profitability, while TTAN could be considered by those with a tolerance for risk seeking potential value in a company with stable capital but current profitability challenges.
Disclaimer: Investment carries a risk of loss of initial capital. The past performance is not a reliable indicator of future results. Be sure to understand risks before making an investment decision.
Go Further
I encourage you to read the complete analyses of monday.com Ltd. and ServiceTitan, Inc. to enhance your investment decisions: