Home > Comparison > Technology > MSFT vs ZS
The strategic rivalry between Microsoft Corporation and Zscaler, Inc. shapes the trajectory of the technology sector’s software infrastructure landscape. Microsoft operates as a capital-intensive technology giant with diversified cloud, productivity, and personal computing segments. In contrast, Zscaler focuses on high-growth cloud security solutions with a lean operational model. This analysis pits established scale against niche innovation to determine which trajectory offers superior risk-adjusted returns for a diversified portfolio.
Table of contents
Companies Overview
Microsoft Corporation and Zscaler, Inc. dominate distinct niches within the software infrastructure market, shaping enterprise technology landscapes.
Microsoft Corporation: Global Tech Giant with Diverse Software Ecosystem
Microsoft commands a leading market position in software infrastructure, generating revenue from three segments: Productivity and Business Processes, Intelligent Cloud, and More Personal Computing. Its core engine includes Office 365, Azure cloud services, Windows OS licensing, and gaming consoles. In 2026, Microsoft strategically focuses on expanding cloud offerings while integrating AI capabilities across platforms to enhance enterprise and consumer engagement.
Zscaler, Inc.: Cloud Security Innovator
Zscaler specializes in cloud security solutions, monetizing through its Zscaler Internet Access and Private Access products that secure SaaS and internal applications. Its platform also includes digital experience monitoring and workload segmentation to mitigate cyber risks. The company’s 2026 strategy emphasizes strengthening cloud-native security posture management to address evolving enterprise cybersecurity demands.
Strategic Collision: Similarities & Divergences
Both firms operate in software infrastructure but diverge sharply in approach: Microsoft builds a broad integrated ecosystem spanning productivity, cloud, and devices; Zscaler pursues a focused cloud security niche. Their battleground is enterprise cloud adoption, where security and productivity intersect. Microsoft offers scale and diversification; Zscaler delivers specialized innovation, reflecting distinct risk and growth profiles for investors.
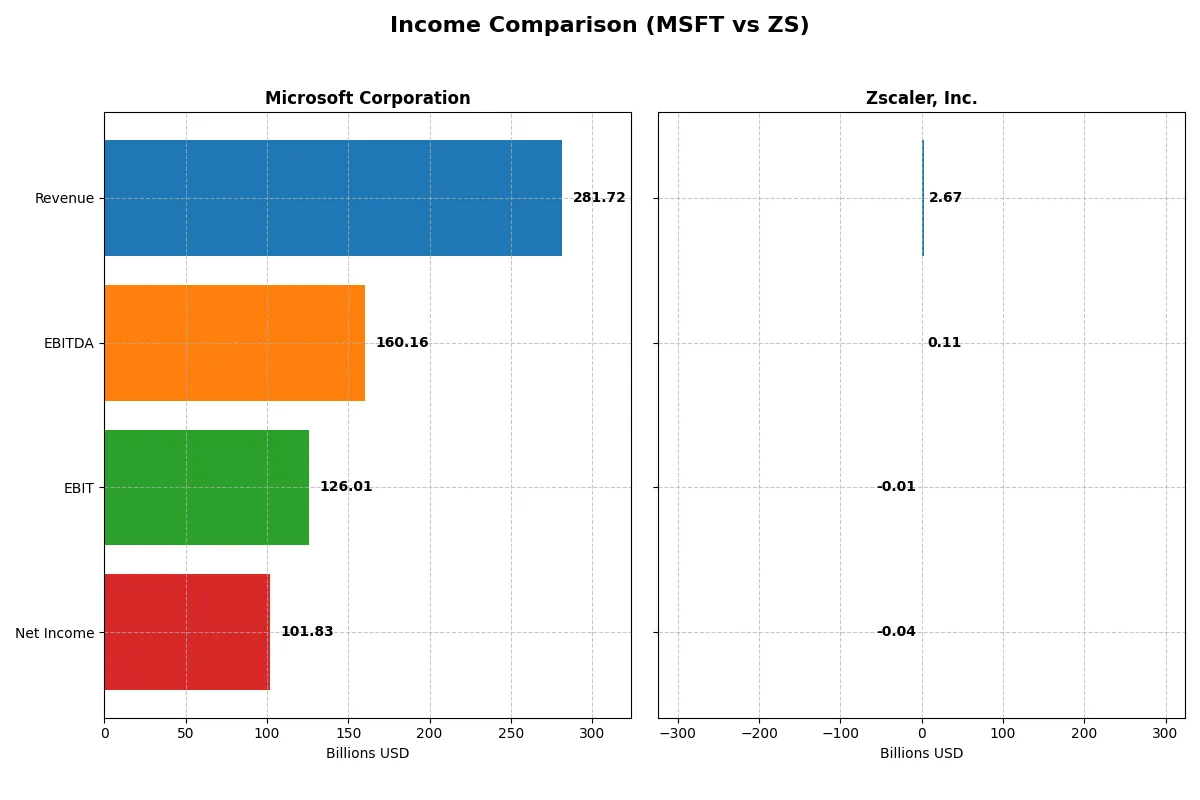
Income Statement Comparison
This data dissects the core profitability and scalability of both corporate engines to reveal who dominates the bottom line:
| Metric | Microsoft Corporation (MSFT) | Zscaler, Inc. (ZS) |
|---|---|---|
| Revenue | 282B | 2.67B |
| Cost of Revenue | 87.8B | 618M |
| Operating Expenses | 65.4B | 2.18B |
| Gross Profit | 194B | 2.05B |
| EBITDA | 160B | 112M |
| EBIT | 126B | -8.8M |
| Interest Expense | 2.39B | 9.5M |
| Net Income | 102B | -41.5M |
| EPS | 13.7 | -0.27 |
| Fiscal Year | 2025 | 2025 |
Income Statement Analysis: The Bottom-Line Duel
This income statement comparison reveals which company converts sales into profits more efficiently, spotlighting the strength of each corporate engine.
Microsoft Corporation Analysis
Microsoft’s revenue surged from 168B in 2021 to 282B in 2025, reflecting robust growth momentum. Net income expanded impressively to 102B in 2025, lifting net margins to a healthy 36.15%. Its gross margin remains favorable near 69%, while operating leverage supports an EBIT margin of 44.73%, underscoring strong cost control and capital efficiency in the latest fiscal year.
Zscaler, Inc. Analysis
Zscaler’s revenue grew rapidly from 673M in 2021 to 2.67B in 2025, tripling over five years. Despite this, net income stayed negative at -41M in 2025, with a net margin of -1.55%. Its gross margin is strong at 76.87%, but EBIT margin remains slightly negative (-0.33%), indicating ongoing investment and scale challenges. However, its impressive revenue and net income growth rates suggest accelerating business momentum.
Margin Power vs. Revenue Scale
Microsoft delivers consistent profitability with strong margins and efficient cost management, generating substantial earnings on large revenue. Zscaler boasts higher revenue growth but struggles to convert scale into profits. Microsoft’s mature profit profile offers stability, while Zscaler’s rapid growth signals potential but with elevated risk for investors.
Financial Ratios Comparison
These vital ratios act as a diagnostic tool to expose the underlying fiscal health, valuation premiums, and capital efficiency of the companies analyzed:
| Ratios | Microsoft Corporation (MSFT) | Zscaler, Inc. (ZS) |
|---|---|---|
| ROE | 29.6% | -2.3% |
| ROIC | 22.0% | -3.2% |
| P/E | 36.3 | -1063.0 |
| P/B | 10.8 | 24.5 |
| Current Ratio | 1.35 | 2.01 |
| Quick Ratio | 1.35 | 2.01 |
| D/E (Debt-to-Equity) | 0.18 | 1.00 |
| Debt-to-Assets | 9.8% | 28.0% |
| Interest Coverage | 53.9 | -13.5 |
| Asset Turnover | 0.46 | 0.42 |
| Fixed Asset Turnover | 1.23 | 4.22 |
| Payout ratio | 23.6% | 0 |
| Dividend yield | 0.65% | 0 |
| Fiscal Year | 2025 | 2025 |
Efficiency & Valuation Duel: The Vital Signs
Financial ratios act as a company’s DNA, uncovering operational strengths and hidden risks essential for investment decisions.
Microsoft Corporation
Microsoft delivers robust profitability with a 29.65% ROE and a commanding 36.15% net margin, signaling operational excellence. However, its valuation appears stretched, with a P/E of 36.31 and P/B of 10.76, both flagged as unfavorable. Shareholders receive modest dividends (0.65%), reflecting a preference for reinvesting in growth and innovation.
Zscaler, Inc.
Zscaler struggles with negative returns: ROE at -2.31% and a net margin of -1.55%, indicating operational challenges. It trades at a steep P/B of 24.51, while a highly negative P/E (-1063) stems from losses, complicating valuation. The company retains cash with a strong current ratio (2.01), focusing on R&D over dividends, which remain absent.
Premium Valuation vs. Operational Safety
Microsoft balances strong profitability with a premium valuation, while Zscaler faces operational deficits despite better liquidity. Microsoft’s metrics suggest lower risk and steadier returns. Investors seeking growth with proven efficiency may lean towards Microsoft, whereas risk-tolerant profiles might consider Zscaler’s innovation focus.
Which one offers the Superior Shareholder Reward?
I compare Microsoft and Zscaler’s shareholder returns by their distribution approaches. Microsoft yields about 0.65% with a sustainable payout ratio near 24%. Its free cash flow per share of 9.6B comfortably covers dividends. Microsoft also executes steady buybacks, enhancing total return. Zscaler pays no dividends, reinvesting cash heavily in growth and R&D. Its free cash flow per share is 4.7B, supporting reinvestment but no immediate income. Zscaler’s buybacks are negligible given its negative net margins and high leverage, raising sustainability concerns. I conclude Microsoft offers the superior total return profile for 2026 investors due to reliable income and robust capital allocation.
Comparative Score Analysis: The Strategic Profile
The radar chart reveals the fundamental DNA and trade-offs of Microsoft Corporation and Zscaler, Inc., highlighting their distinct financial strengths and weaknesses:
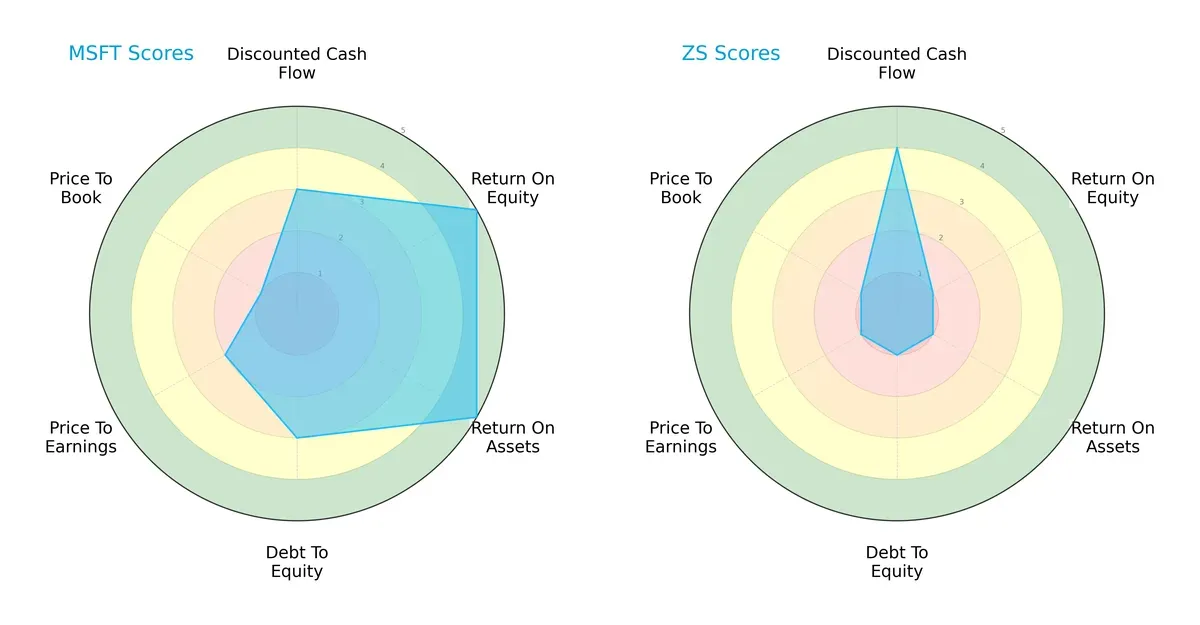
Microsoft shows a balanced profile with strong ROE and ROA scores of 5 each, reflecting efficient profit generation and asset use. Its moderate DCF and debt-to-equity scores indicate reasonable valuation and financial risk management. In contrast, Zscaler leans heavily on a favorable DCF score of 4 but struggles with very unfavorable scores in ROE, ROA, debt-to-equity, and valuation metrics. Microsoft’s diversified strengths offer stability, while Zscaler relies on potential future cash flows, exposing investors to higher risk.
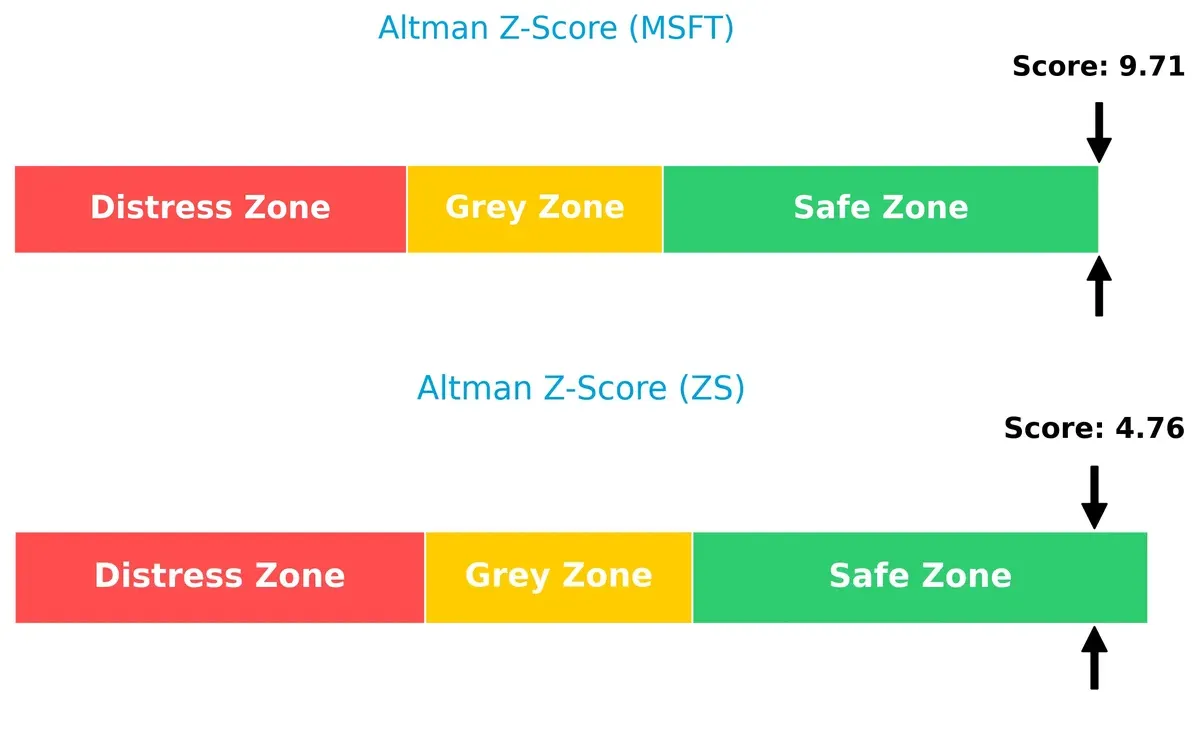
Bankruptcy Risk: Solvency Showdown
Microsoft’s Altman Z-Score of 9.7 vastly outperforms Zscaler’s 4.8, indicating superior solvency and a much lower bankruptcy risk in this cycle:
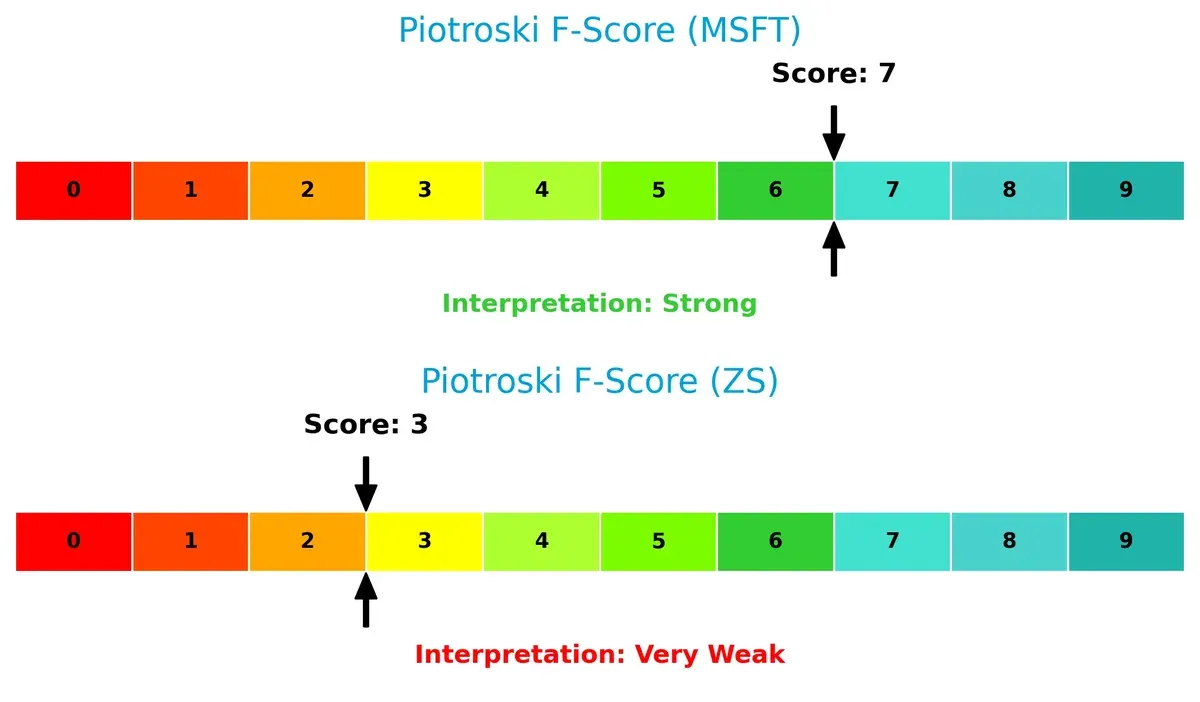
Financial Health: Quality of Operations
Microsoft’s Piotroski F-Score of 7 signals strong financial health and operational quality, while Zscaler’s weak score of 3 raises red flags about internal financial stability and efficiency:
How are the two companies positioned?
This section dissects Microsoft and Zscaler’s operational DNA by comparing their revenue distribution and internal strengths and weaknesses. The goal is to confront their economic moats and identify which model offers the most durable competitive advantage today.
Revenue Segmentation: The Strategic Mix
This visual comparison dissects how Microsoft Corporation and Zscaler, Inc. diversify their income streams and where their primary sector bets lie:
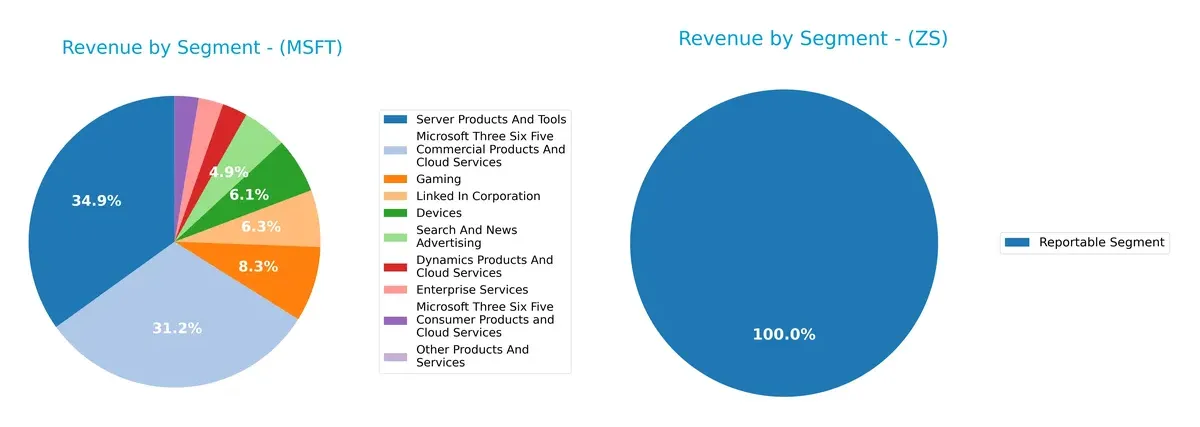
Microsoft Corporation presents a richly diversified revenue mix, anchored by Server Products And Tools at $98.4B and Microsoft 365 Commercial Products And Cloud Services at $87.8B. Gaming and LinkedIn also contribute significantly, showcasing ecosystem lock-in and infrastructure dominance. In contrast, Zscaler, Inc. reports a single segment totaling $2.67B, indicating a concentrated business model with higher exposure to segment-specific risks. Microsoft’s breadth offers resilience; Zscaler’s focus demands scrutiny.
Strengths and Weaknesses Comparison
This table compares the Strengths and Weaknesses of Microsoft Corporation and Zscaler, Inc.:
Microsoft Corporation Strengths
- Highly diversified product segments including cloud, gaming, and enterprise services
- Strong global presence with over 280B USD revenue split nearly evenly between US and non-US
- Favorable net margin (36.15%) and ROE (29.65%) indicate robust profitability
- Low debt-to-assets ratio (9.79%) and high interest coverage (52.84) reflect financial strength
Zscaler, Inc. Strengths
- Strong liquidity with current and quick ratios at 2.01
- Favorable fixed asset turnover (4.22) suggests efficient asset use
- Favorable P/E ratio due to negative earnings, reflecting market expectations
- Moderate debt-to-assets ratio (27.98%) manageable for growth phase
Microsoft Corporation Weaknesses
- Unfavorable valuation multiples: high P/E (36.31) and P/B (10.76) may limit upside
- Asset turnover (0.46) below ideal, indicating less efficient asset use
- Low dividend yield (0.65%) may deter income-focused investors
Zscaler, Inc. Weaknesses
- Negative profitability metrics: net margin (-1.55%), ROE (-2.31%), and ROIC (-3.18%)
- Negative interest coverage (-0.92) signals risk from debt servicing
- High P/B ratio (24.51) suggests expensive valuation
- No dividend yield limits income potential
Microsoft’s strengths lie in its diversified revenue streams and strong profitability supported by prudent capital structure. Zscaler shows strong liquidity and asset efficiency but faces challenges in profitability and debt servicing. These factors shape each company’s strategic priorities in balancing growth and financial health.
The Moat Duel: Analyzing Competitive Defensibility
A structural moat alone shields long-term profits from relentless competitive erosion. Here is how Microsoft and Zscaler defend their turf:
Microsoft Corporation: Ecosystem Moat Anchored by Switching Costs
Microsoft leverages vast switching costs through integrated software and cloud platforms. Its 44.7% EBIT margin confirms efficient capital use. Expansion in AI and cloud markets may deepen this moat in 2026.
Zscaler, Inc.: Emerging Network Effect Moat in Cloud Security
Zscaler’s moat stems from network effects within its cloud security platform, differing from Microsoft’s ecosystem lock. Despite negative ROIC vs. WACC, its rapid ROIC growth signals strengthening defenses and market expansion opportunities.
Ecosystem Entrenchment vs. Network Effect Emergence
Microsoft holds a wider, more established moat with strong profitability and scale. Zscaler’s moat is narrower but growing quickly, positioning it well for future market disruption. Microsoft remains better suited to defend its entrenched market share.
Which stock offers better returns?
The past year shows Microsoft and Zscaler stocks with modest overall gains but recent sharp declines, highlighting contrasting trading dynamics and investor sentiment.
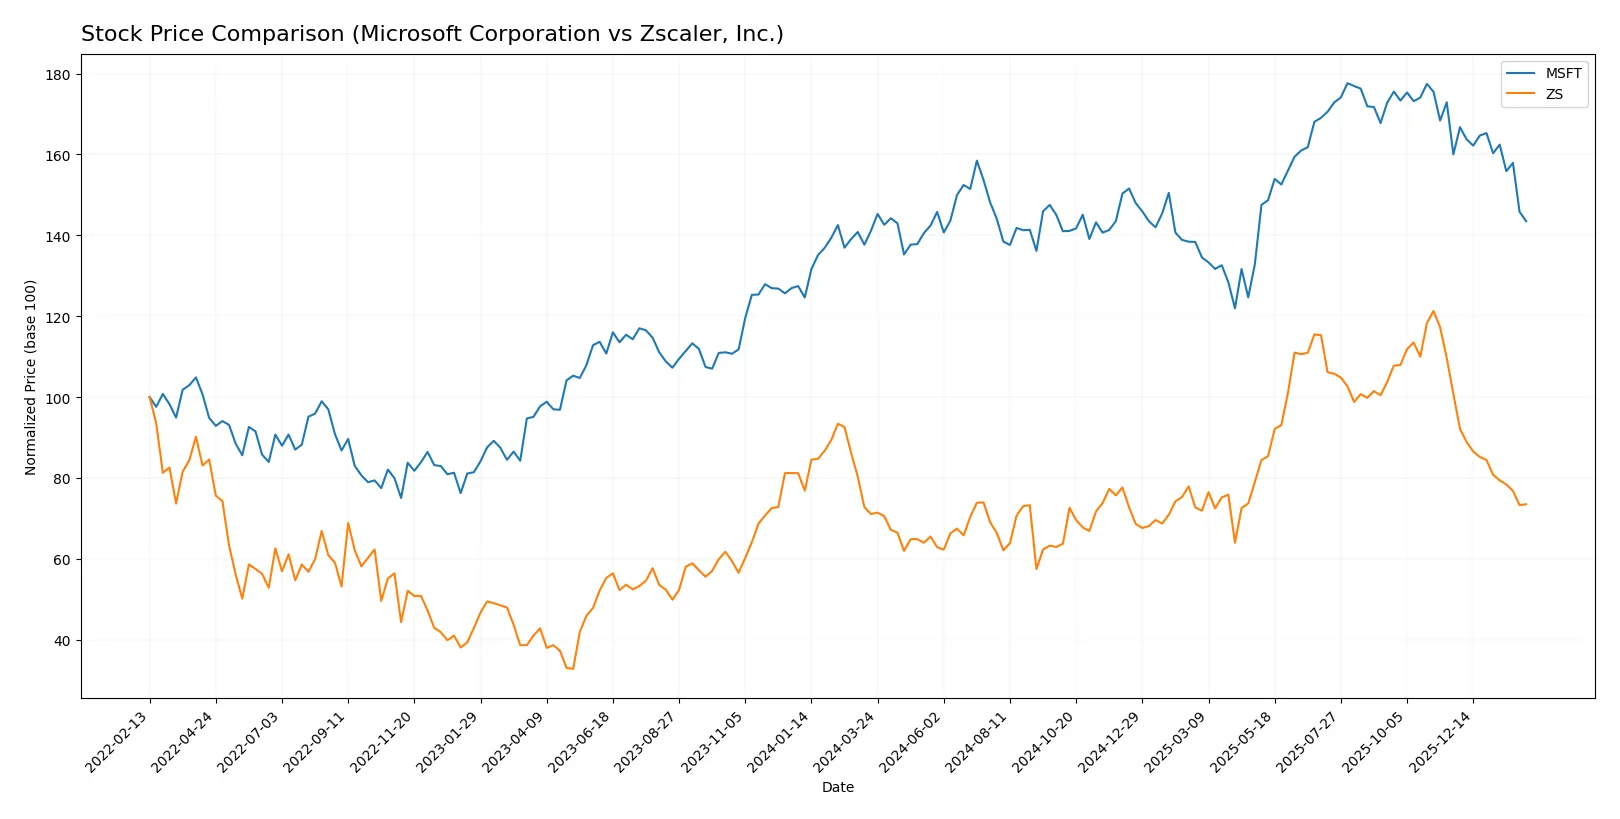
Trend Comparison
Microsoft’s stock rose 1.67% over the past 12 months, signaling a bullish trend with decelerating momentum and a high volatility of 41.8, peaking at 524.11 and bottoming at 359.84.
Zscaler gained 3.39% in the same period, also bullish with deceleration. It exhibited higher volatility (47.16), reaching 331.14 before dropping to 156.78.
Zscaler outperformed Microsoft overall, despite both stocks facing recent steep sell-offs and seller dominance.
Target Prices
Analysts project strong upside potential for Microsoft Corporation and Zscaler, Inc. based on current consensus targets.
| Company | Target Low | Target High | Consensus |
|---|---|---|---|
| Microsoft Corporation | 450 | 675 | 600.04 |
| Zscaler, Inc. | 260 | 360 | 311.41 |
Microsoft’s consensus target of 600 represents a 42% premium to its current price of 423. Zscaler’s target consensus of 311 suggests a 55% upside from its current 201 level.

Don’t Let Luck Decide Your Entry Point
Optimize your entry points with our advanced ProRealTime indicators. You’ll get efficient buy signals with precise price targets for maximum performance. Start outperforming now!
How do institutions grade them?
Microsoft Corporation Grades
The latest institutional grades for Microsoft Corporation are summarized below:
| Grading Company | Action | New Grade | Date |
|---|---|---|---|
| Citigroup | Maintain | Buy | 2026-01-30 |
| Wedbush | Maintain | Outperform | 2026-01-29 |
| Cantor Fitzgerald | Maintain | Overweight | 2026-01-29 |
| RBC Capital | Maintain | Outperform | 2026-01-29 |
| Stifel | Maintain | Buy | 2026-01-29 |
| DA Davidson | Maintain | Buy | 2026-01-29 |
| Keybanc | Maintain | Overweight | 2026-01-29 |
| Piper Sandler | Maintain | Overweight | 2026-01-29 |
| Evercore ISI Group | Maintain | Outperform | 2026-01-29 |
| Wells Fargo | Maintain | Overweight | 2026-01-29 |
Zscaler, Inc. Grades
The recent institutional grades for Zscaler, Inc. are listed as follows:
| Grading Company | Action | New Grade | Date |
|---|---|---|---|
| Citigroup | Maintain | Buy | 2026-01-13 |
| Keybanc | Maintain | Overweight | 2026-01-12 |
| Piper Sandler | Maintain | Neutral | 2026-01-05 |
| RBC Capital | Maintain | Outperform | 2026-01-05 |
| Mizuho | Upgrade | Outperform | 2025-12-16 |
| Citigroup | Maintain | Buy | 2025-12-01 |
| Bernstein | Downgrade | Market Perform | 2025-12-01 |
| Scotiabank | Maintain | Sector Outperform | 2025-11-26 |
| JP Morgan | Maintain | Overweight | 2025-11-26 |
| Baird | Maintain | Outperform | 2025-11-26 |
Which company has the best grades?
Microsoft Corporation holds consistently high grades, mostly Buy, Outperform, and Overweight, reflecting broad institutional confidence. Zscaler, Inc. shows a mixed profile with several Outperform ratings but also a Neutral and a recent downgrade. Investors may view Microsoft’s stable, high-level grades as a sign of lower risk compared to Zscaler’s more variable outlook.
Risks specific to each company
The following categories identify the critical pressure points and systemic threats facing both firms in the 2026 market environment:
1. Market & Competition
Microsoft Corporation
- Dominates with a 3.14T market cap and diversified segments; faces intense cloud and software competition.
Zscaler, Inc.
- Smaller 32B market cap in cloud security; rapid innovation required to keep pace with larger rivals.
2. Capital Structure & Debt
Microsoft Corporation
- Low debt-to-equity at 0.18 and strong interest coverage (52.8x) reduce financial risk.
Zscaler, Inc.
- Higher leverage with debt-to-equity of 1.0 and negative interest coverage signals riskier capital structure.
3. Stock Volatility
Microsoft Corporation
- Beta of 1.08 indicates moderate sensitivity to market swings, reflecting stable investor confidence.
Zscaler, Inc.
- Beta of 1.02 shows slightly lower volatility but stock price range is wide (165-337), suggesting pricing uncertainty.
4. Regulatory & Legal
Microsoft Corporation
- Faces ongoing antitrust scrutiny globally; compliance costs remain significant but manageable.
Zscaler, Inc.
- Operates in security sector with evolving regulations; compliance missteps could impair reputation and contracts.
5. Supply Chain & Operations
Microsoft Corporation
- Large, global operations with robust supply chains but exposed to hardware component shortages.
Zscaler, Inc.
- Primarily cloud-based, less supply chain risk but dependent on reliable data center operations and cloud infrastructure.
6. ESG & Climate Transition
Microsoft Corporation
- Aggressive carbon neutrality targets and ESG initiatives enhance long-term sustainability credentials.
Zscaler, Inc.
- ESG reporting less mature; must accelerate climate transition efforts to meet industry standards.
7. Geopolitical Exposure
Microsoft Corporation
- Global footprint exposes it to geopolitical tensions, especially US-China tech rivalry.
Zscaler, Inc.
- US-centric but expanding internationally; geopolitical risks growing with global client base.
Which company shows a better risk-adjusted profile?
Microsoft’s strongest risk lies in regulatory scrutiny amid its size and market dominance. Zscaler faces its greatest challenge in financial leverage and operational scale. Overall, Microsoft shows a superior risk-adjusted profile thanks to its diversified business, robust balance sheet, and strong financial health. Zscaler’s weaker profitability and higher debt raise caution despite its growth potential. The 52.8x interest coverage for Microsoft versus negative coverage for Zscaler sharply illustrates their divergence in financial stability.
Final Verdict: Which stock to choose?
Microsoft’s superpower lies in its robust economic moat, delivering consistent value creation through strong capital efficiency and diversified revenue streams. Its main point of vigilance is the recent decline in ROIC, signaling pressure on profitability. It fits portfolios aiming for steady, large-cap growth with moderate risk tolerance.
Zscaler’s strategic moat centers on its cloud security dominance and rapid revenue growth, although it currently sheds value and posts losses. Its higher liquidity and growth potential offer a contrasting safety profile. It suits investors with a higher risk appetite chasing disruptive innovation and expansion opportunities.
If you prioritize durable profitability and capital discipline, Microsoft outshines as the compelling choice due to its proven value creation and scale. However, if you seek aggressive growth with tolerance for volatility, Zscaler offers superior upside potential from its expanding cloud security niche. Each presents distinct analytical scenarios tailored to specific investor profiles.
Disclaimer: Investment carries a risk of loss of initial capital. The past performance is not a reliable indicator of future results. Be sure to understand risks before making an investment decision.
Go Further
I encourage you to read the complete analyses of Microsoft Corporation and Zscaler, Inc. to enhance your investment decisions: