Home > Comparison > Technology > MSFT vs WIX
The strategic rivalry between Microsoft Corporation and Wix.com Ltd. shapes the software infrastructure landscape. Microsoft, a diversified technology behemoth, balances cloud, productivity, and device segments. Wix operates a high-growth, cloud-based platform enabling easy website creation and digital business management. This analysis probes their contrasting growth trajectories and capital structures to determine which stock offers a superior risk-adjusted return for diversified portfolios in an evolving tech sector.

Table of contents
Companies Overview
Microsoft Corporation and Wix.com Ltd. stand as pivotal players in the software infrastructure arena, shaping digital experiences globally.
Microsoft Corporation: Global Software Infrastructure Giant
Microsoft dominates as a global software infrastructure leader, generating revenue through diversified segments—cloud services, productivity software, and personal computing devices. Its strategic focus in 2026 emphasizes expanding Azure cloud capabilities and integrating AI across platforms to sustain its competitive edge and enterprise dominance.
Wix.com Ltd.: Cloud-Based Web Development Innovator
Wix.com Ltd. excels as a cloud-based platform provider that empowers users to build websites and applications via intuitive tools and services. Its 2026 strategy centers on enhancing automation and customer engagement features within its ecosystem to grow its premium subscriptions and global user base.
Strategic Collision: Similarities & Divergences
Both companies prioritize cloud infrastructure but diverge in scope—Microsoft fosters a closed ecosystem with enterprise solutions, whereas Wix champions user-friendly, customizable web tools. Their primary battleground is the democratization of digital presence, targeting different customer segments. This contrast defines their distinct risk and growth profiles within the technology sector.
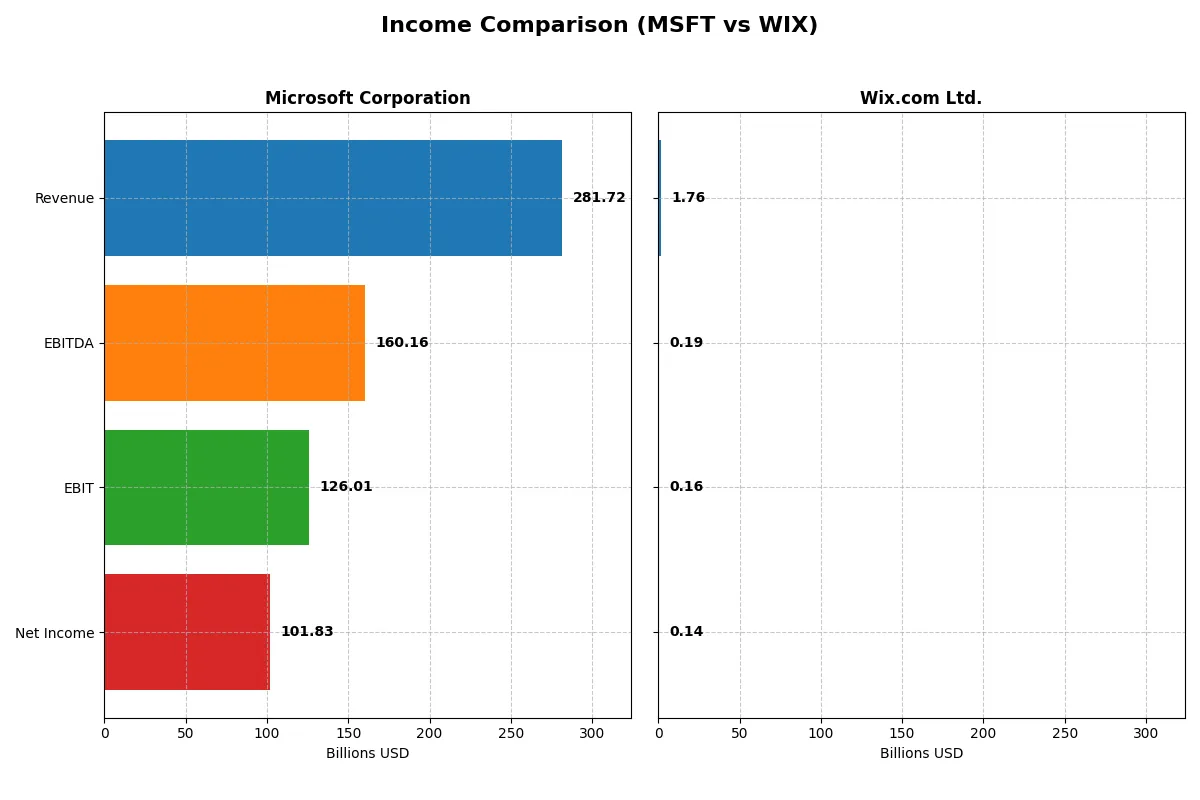
Income Statement Comparison
This data dissects the core profitability and scalability of both corporate engines to reveal who dominates the bottom line:
| Metric | Microsoft Corporation (MSFT) | Wix.com Ltd. (WIX) |
|---|---|---|
| Revenue | 282B | 1.76B |
| Cost of Revenue | 88B | 565M |
| Operating Expenses | 65B | 1.10B |
| Gross Profit | 194B | 1.20B |
| EBITDA | 160B | 186M |
| EBIT | 126B | 155M |
| Interest Expense | 2.39B | 3.86M |
| Net Income | 102B | 138M |
| EPS | 13.7 | 2.49 |
| Fiscal Year | 2025 | 2024 |
Income Statement Analysis: The Bottom-Line Duel
This income statement comparison reveals how efficiently Microsoft Corporation and Wix.com Ltd. convert revenue into profit and sustain growth momentum.
Microsoft Corporation Analysis
Microsoft’s revenue surged from $168B in 2021 to $282B in 2025, with net income climbing from $61B to $102B. Its gross margin remains robust near 69%, while net margins hold a strong 36%. In 2025, Microsoft’s operational efficiency and scale delivered a 15% revenue growth and maintained a stable net margin, underscoring steady profit expansion.
Wix.com Ltd. Analysis
Wix’s revenue grew from $984M in 2020 to $1.76B in 2024, with net income rebounding from a $167M loss to $138M profit. Its gross margin hovers around 68%, while net margin improved sharply to almost 8%. In 2024, Wix showed dynamic momentum with a 13% revenue increase and a 270% surge in net margin, reflecting rapid operational improvement.
Scale and Margin Strength: Established Giant vs. Emerging Contender
Microsoft dominates with scale and consistently high margins, delivering stable profitability and strong cash generation. Wix impresses with rapid margin expansion and recovery from losses, signaling a transitioning business model. For investors prioritizing size and margin durability, Microsoft leads; those seeking growth and margin turnaround may find Wix’s profile compelling.
Financial Ratios Comparison
These vital ratios act as a diagnostic tool to expose the underlying fiscal health, valuation premiums, and capital efficiency for the companies compared below:
| Ratios | Microsoft Corporation (MSFT) | Wix.com Ltd. (WIX) |
|---|---|---|
| ROE | 29.6% | -175.6% |
| ROIC | 22.0% | 9.1% |
| P/E | 36.3 | 86.2 |
| P/B | 10.8 | -151.4 |
| Current Ratio | 1.35 | 0.84 |
| Quick Ratio | 1.35 | 0.84 |
| D/E | 0.18 | -12.3 |
| Debt-to-Assets | 9.8% | 50.7% |
| Interest Coverage | 53.9 | 25.9 |
| Asset Turnover | 0.46 | 0.92 |
| Fixed Asset Turnover | 1.23 | 3.33 |
| Payout ratio | 23.6% | 0% |
| Dividend yield | 0.65% | 0% |
| Fiscal Year | 2025 | 2024 |
Efficiency & Valuation Duel: The Vital Signs
Financial ratios act as a company’s DNA, exposing operational strengths and hidden risks critical for investment decisions.
Microsoft Corporation
Microsoft exhibits robust profitability with a 29.65% ROE and a strong 36.15% net margin, signaling solid operational efficiency. Its valuation appears stretched, with a high P/E of 36.31 and P/B of 10.76. Shareholders receive modest dividends (0.65%), balanced by significant reinvestment in R&D fueling growth and competitive moats.
Wix.com Ltd.
Wix struggles with negative ROE (-175.57%) and a modest 7.86% net margin, reflecting operational challenges. The stock trades at an expensive P/E of 86.21, while its unfavorable liquidity (current ratio 0.84) poses risks. Wix offers no dividend, instead allocating heavily to R&D to pursue growth amid profitability headwinds.
Premium Valuation vs. Operational Safety
Microsoft balances strong profitability and disciplined capital allocation despite stretched valuation metrics. Wix’s high valuation paired with weak profitability and liquidity raises caution. Investors seeking operational strength and steady returns lean toward Microsoft, while risk-tolerant growth seekers may consider Wix’s profile.
Which one offers the Superior Shareholder Reward?
I see Microsoft offers a clear distribution advantage over Wix.com. Microsoft yields around 0.65%, with a sustainable payout ratio near 24%, backed by strong free cash flow of 9.6B and consistent buybacks enhancing total return. Wix pays no dividend, relying solely on reinvestment for growth, yet its debt-heavy structure and volatile margins raise risks. Microsoft’s balanced dividend and buyback policy, coupled with robust cash flow coverage, delivers a more dependable and attractive shareholder reward in 2026.
Comparative Score Analysis: The Strategic Profile
The radar chart reveals the fundamental DNA and trade-offs of Microsoft Corporation and Wix.com Ltd., highlighting their strategic strengths and weaknesses:
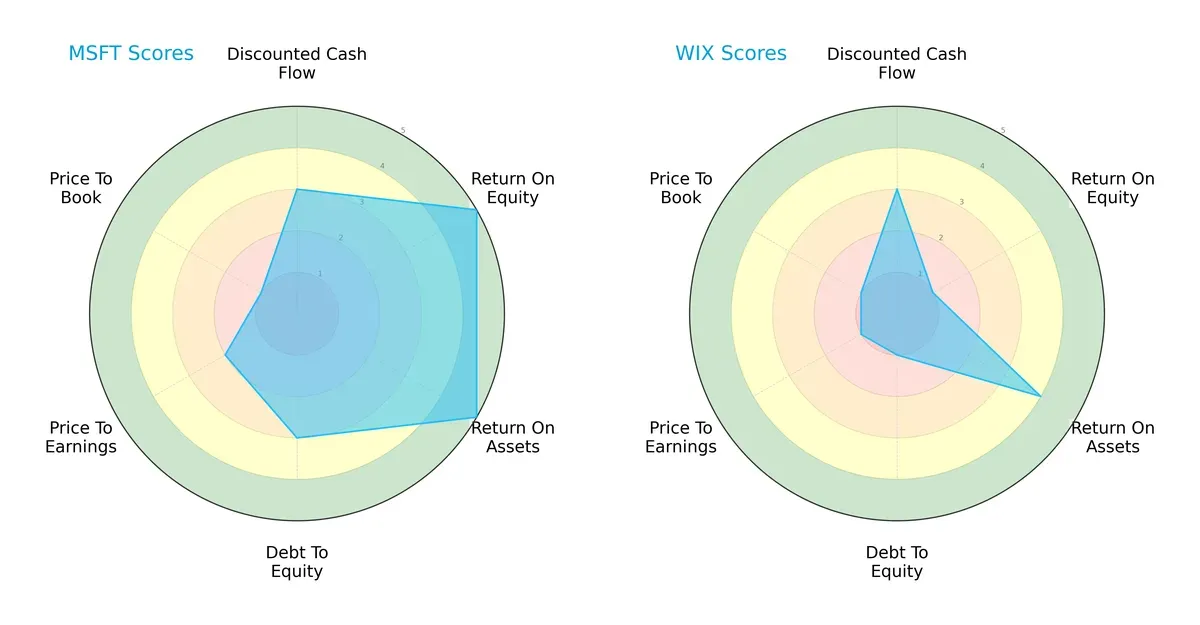
Microsoft exhibits a more balanced profile with top scores in ROE (5) and ROA (5), reflecting efficient capital and asset utilization. Wix shows weaknesses in ROE (1) and debt management (1), relying heavily on asset productivity (ROA 4). Microsoft’s valuation metrics (P/E 2, P/B 1) suggest some overvaluation risk, while Wix scores poorly across valuation and leverage, signaling caution.
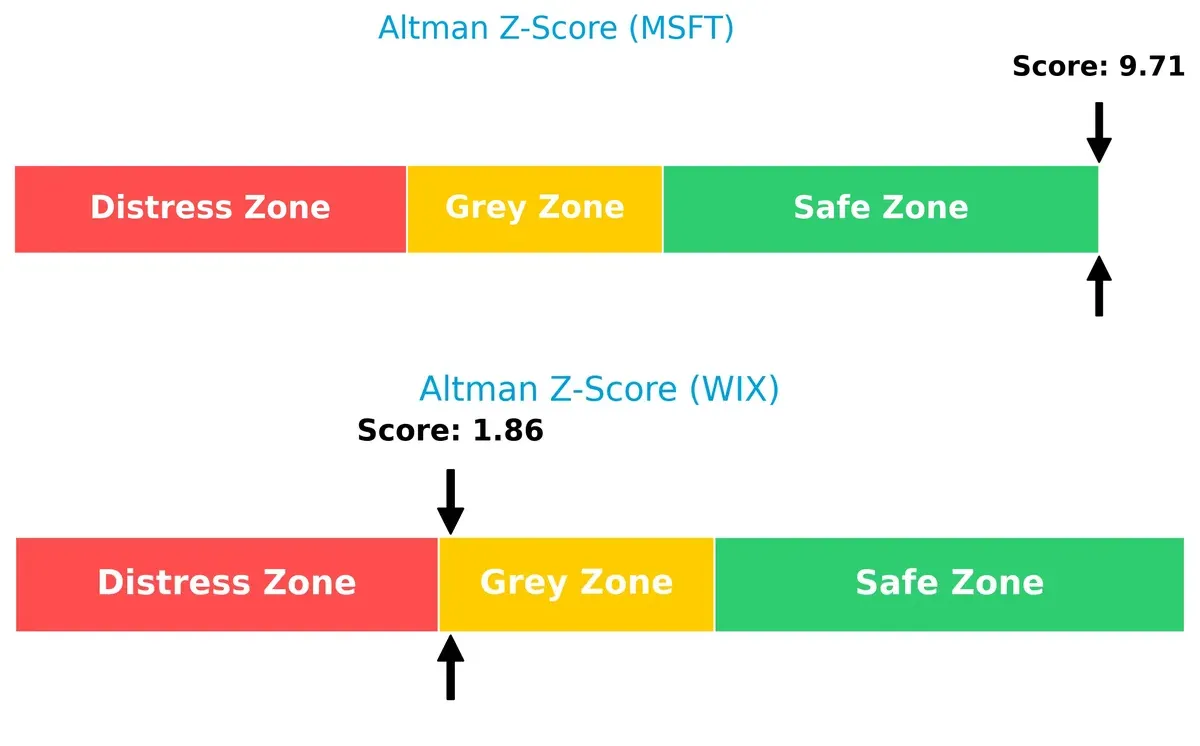
Bankruptcy Risk: Solvency Showdown
Microsoft’s Altman Z-Score of 9.7 places it comfortably in the safe zone, while Wix’s 1.9 is in the grey zone, implying higher bankruptcy risk in this cycle:
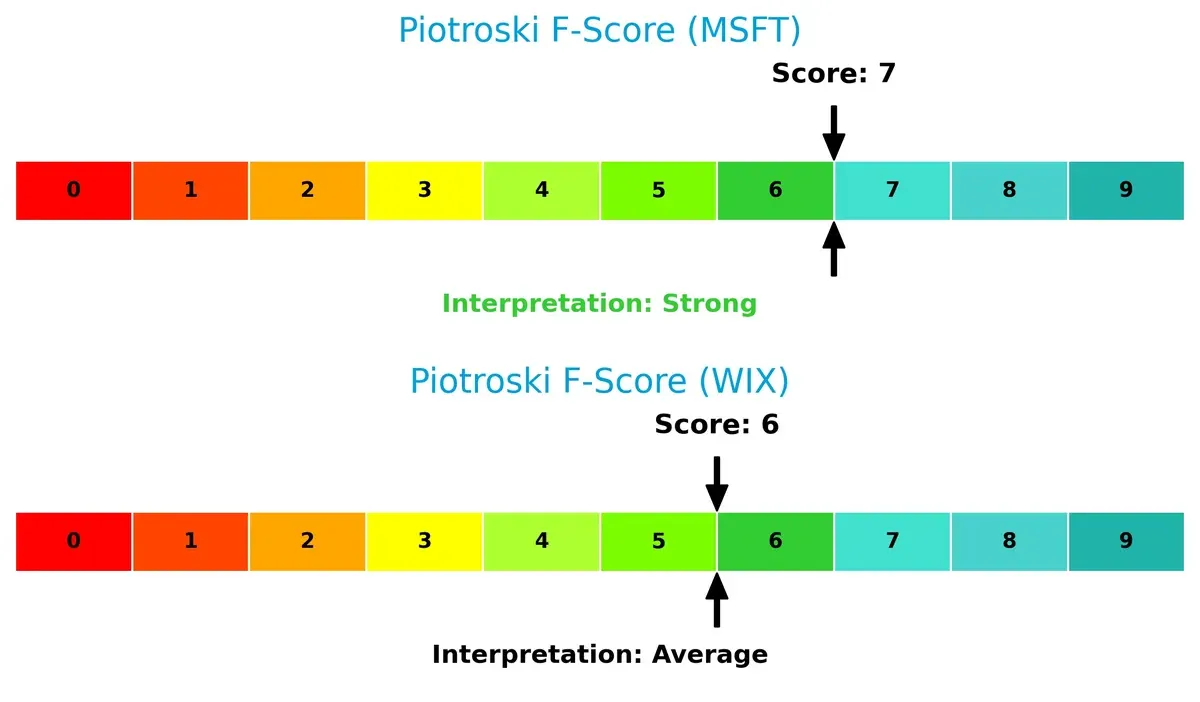
Financial Health: Quality of Operations
Microsoft’s Piotroski F-Score of 7 indicates strong financial health, outperforming Wix’s average score of 6, which may signal emerging internal weaknesses:
How are the two companies positioned?
This section dissects Microsoft and Wix’s operational DNA by comparing their revenue distribution and internal strengths and weaknesses. The goal is to confront their economic moats to reveal which model offers the most resilient, sustainable competitive advantage today.
Revenue Segmentation: The Strategic Mix
This comparison dissects how Microsoft Corporation and Wix.com Ltd. diversify their income streams and where their primary sector bets lie:
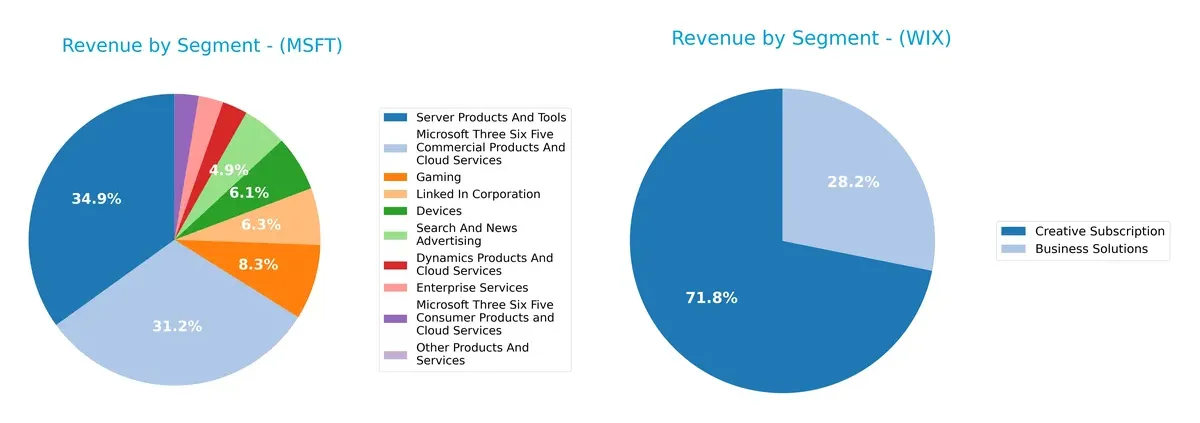
Microsoft dwarfs Wix in scale and segment breadth, with revenues spread across Server Products (98B), Microsoft 365 Commercial (88B), and Gaming (23B). Wix relies heavily on Creative Subscription (1.26B) and Business Solutions (496M), reflecting a narrower focus. Microsoft’s diversified portfolio reduces risk and supports ecosystem lock-in. Wix’s concentration exposes it to product-specific fluctuations but targets a clear niche in website creation and subscription services.
Strengths and Weaknesses Comparison
This table compares the Strengths and Weaknesses of Microsoft Corporation and Wix.com Ltd.:
Microsoft Strengths
- Diverse revenue streams across cloud, gaming, LinkedIn, advertising, and devices
- Strong profitability with 36% net margin and 30% ROE
- Favorable capital structure with low debt-to-assets at 9.8%
- Global presence with nearly equal US and Non-US revenue around 140B each
- High market share in enterprise and cloud services
Wix.com Strengths
- Growing revenues in Business Solutions and Creative Subscriptions exceeding 1.7B
- Favorable fixed asset turnover at 3.33 indicating efficient asset use
- Positive interest coverage of 40, supporting debt servicing ability
- Favorable price-to-book ratio despite negative equity
- Expanding geographic reach across North America, Europe, Asia Pacific, and Latin America
Microsoft Weaknesses
- High valuation multiples with PE at 36.3 and PB at 10.8, limiting margin of safety
- Asset turnover low at 0.46, indicating less efficient asset utilization
- Dividend yield low at 0.65%, less attractive for income investors
- Neutral current ratio at 1.35, suggesting moderate liquidity buffer
Wix.com Weaknesses
- Negative ROE at -176%, signaling poor profitability and equity erosion
- High debt-to-assets at 50.7%, indicating financial leverage risk
- Unfavorable current ratio at 0.84, raising liquidity concerns
- Zero dividend yield, providing no income return to shareholders
- High PE at 86.2, reflecting elevated expectations and risk
Overall, Microsoft demonstrates robust profitability, a strong diversified business model, and global market penetration, though valuation and asset efficiency warrant attention. Wix shows potential in asset utilization and geographic expansion but faces significant challenges in profitability, leverage, and liquidity that could impact its strategic flexibility.
The Moat Duel: Analyzing Competitive Defensibility
A structural moat is the only true shield protecting long-term profits from relentless competitive erosion:
Microsoft Corporation: Ecosystem Lock-in and Intangible Assets
Microsoft’s moat arises from its vast ecosystem and powerful intangible assets like Office 365 and Azure. Its high ROIC (13.2% above WACC) confirms efficient capital use. Despite a slight ROIC decline, expanding cloud and AI services in 2026 should reinforce this moat.
Wix.com Ltd.: Rapid Growth with Emerging Switching Costs
Wix’s moat centers on user-friendly cloud platform and growing switching costs among small businesses. Unlike Microsoft, Wix’s ROIC lags WACC, signaling current value destruction but accelerating ROIC growth suggests improving capital efficiency and market traction in 2026.
Ecosystem Strength vs. Emerging Switching Costs: Moat Depth Showdown
Microsoft holds a wider, more durable moat with consistent value creation despite slight profitability erosion. Wix’s moat is narrower but gaining strength rapidly. Microsoft remains better equipped to defend and expand its market share long-term.
Which stock offers better returns?
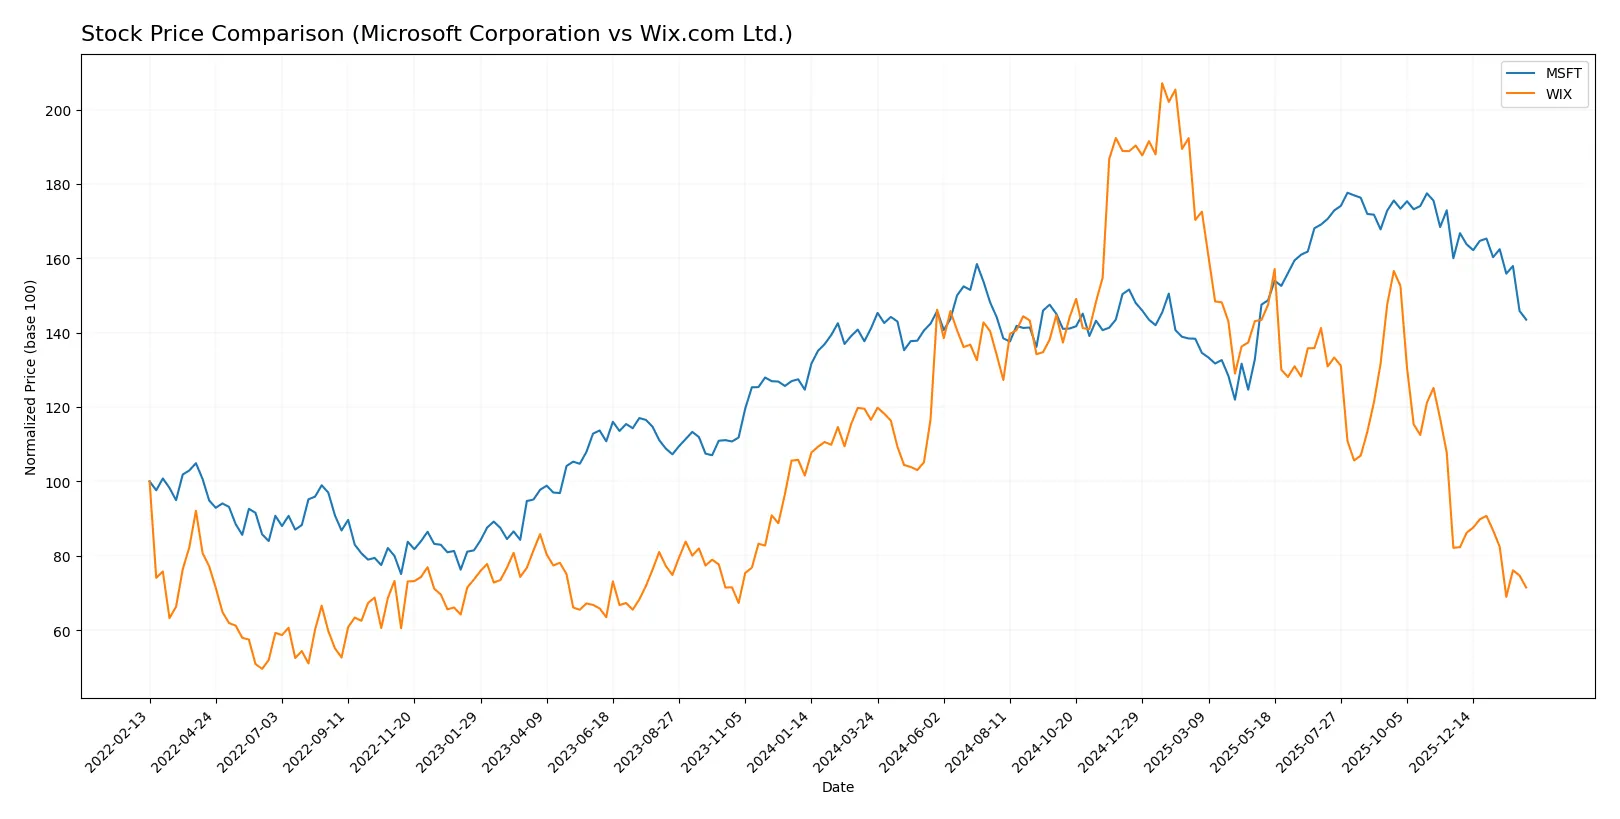
Stock prices for Microsoft Corporation and Wix.com Ltd. reveal contrasting dynamics over the past year, with Microsoft showing mild gains amid decelerating momentum, while Wix faces a steep decline.
Trend Comparison
Microsoft’s stock rose 1.67% over the past 12 months, marking a bullish yet decelerating trend. The price ranged between $360 and $524, with recent months showing a -10.33% pullback.
Wix’s stock fell 38.7% in the same period, confirming a bearish trend with slowing decline. Its price fluctuated between $80 and $241, with a recent drop of -12.99% reinforcing the downtrend.
Microsoft outperformed Wix by maintaining modest positive returns. Wix’s steeper losses delivered the weakest market performance over the last year.
Target Prices
Analysts present a wide but optimistic target consensus for both Microsoft Corporation and Wix.com Ltd.
| Company | Target Low | Target High | Consensus |
|---|---|---|---|
| Microsoft Corporation | 450 | 675 | 600.04 |
| Wix.com Ltd. | 70 | 210 | 157.33 |
Microsoft’s target consensus at 600.04 suggests a 41% upside from the current 423.37 price, reflecting strong confidence. Wix’s consensus of 157.33 implies nearly 90% potential gain, indicating high growth expectations despite volatility.

Don’t Let Luck Decide Your Entry Point
Optimize your entry points with our advanced ProRealTime indicators. You’ll get efficient buy signals with precise price targets for maximum performance. Start outperforming now!
How do institutions grade them?
Microsoft Corporation Grades
The following table summarizes recent institutional grades for Microsoft Corporation:
| Grading Company | Action | New Grade | Date |
|---|---|---|---|
| Citigroup | Maintain | Buy | 2026-01-30 |
| Wedbush | Maintain | Outperform | 2026-01-29 |
| Cantor Fitzgerald | Maintain | Overweight | 2026-01-29 |
| RBC Capital | Maintain | Outperform | 2026-01-29 |
| Stifel | Maintain | Buy | 2026-01-29 |
| DA Davidson | Maintain | Buy | 2026-01-29 |
| Keybanc | Maintain | Overweight | 2026-01-29 |
| Piper Sandler | Maintain | Overweight | 2026-01-29 |
| Evercore ISI Group | Maintain | Outperform | 2026-01-29 |
| Wells Fargo | Maintain | Overweight | 2026-01-29 |
Wix.com Ltd. Grades
The following table summarizes recent institutional grades for Wix.com Ltd.:
| Grading Company | Action | New Grade | Date |
|---|---|---|---|
| Citizens | Maintain | Market Outperform | 2026-01-22 |
| Barclays | Maintain | Overweight | 2026-01-21 |
| Morgan Stanley | Maintain | Overweight | 2026-01-15 |
| Wells Fargo | Maintain | Overweight | 2025-12-19 |
| Cantor Fitzgerald | Maintain | Overweight | 2025-12-11 |
| Cantor Fitzgerald | Maintain | Overweight | 2025-11-20 |
| RBC Capital | Maintain | Outperform | 2025-11-20 |
| Wells Fargo | Maintain | Overweight | 2025-11-20 |
| Benchmark | Maintain | Buy | 2025-11-20 |
| Barclays | Maintain | Overweight | 2025-11-20 |
Which company has the best grades?
Microsoft consistently receives “Buy” and “Outperform” grades from top-tier firms, reflecting broad institutional confidence. Wix.com mostly earns “Overweight” and “Market Outperform” ratings, indicating a positive but slightly less enthusiastic consensus. Investors may view Microsoft’s stronger and more recent endorsements as a sign of higher market conviction.
Risks specific to each company
The following risk categories reveal the critical pressure points and systemic threats Microsoft Corporation and Wix.com Ltd. face in the 2026 market environment:
1. Market & Competition
Microsoft Corporation
- Dominates with diversified cloud, productivity, and gaming segments but faces intense tech rivalry.
Wix.com Ltd.
- Competes in a niche cloud website-building market with rising competition and limited scale.
2. Capital Structure & Debt
Microsoft Corporation
- Maintains low debt-to-equity (0.18) and strong interest coverage (52.84), indicating financial stability.
Wix.com Ltd.
- Displays high debt-to-assets (50.7%) and negative debt-to-equity, signaling riskier leverage management.
3. Stock Volatility
Microsoft Corporation
- Beta of 1.08 indicates moderate volatility, aligned closely with the NASDAQ index.
Wix.com Ltd.
- Beta of 1.42 suggests higher volatility and sensitivity to market swings.
4. Regulatory & Legal
Microsoft Corporation
- Faces global antitrust scrutiny but has robust compliance infrastructure.
Wix.com Ltd.
- Operates under less regulatory pressure but must navigate international data privacy laws.
5. Supply Chain & Operations
Microsoft Corporation
- Complex global operations with proven supply chain resilience.
Wix.com Ltd.
- Smaller scale operations with potential vulnerability to third-party service disruptions.
6. ESG & Climate Transition
Microsoft Corporation
- Strong ESG commitments and climate initiatives, enhancing brand and investor appeal.
Wix.com Ltd.
- Emerging ESG focus but limited impact visibility and resources compared to larger peers.
7. Geopolitical Exposure
Microsoft Corporation
- Global footprint exposes it to US-China tech tensions and export controls.
Wix.com Ltd.
- Based in Israel, faces geopolitical risks in the Middle East that could disrupt operations.
Which company shows a better risk-adjusted profile?
Microsoft’s dominant market position, conservative leverage, and superior financial health create a more robust risk-adjusted profile. Wix’s high debt levels, volatility, and geopolitical exposure present elevated risks. Microsoft’s Altman Z-Score of 9.7 confirms its safe financial zone, while Wix’s 1.86 signals moderate bankruptcy risk. The sharply negative ROE for Wix (-175.6%) underscores its profitability challenge amid market pressures. I see Microsoft as the safer, more resilient investment under current conditions.
Final Verdict: Which stock to choose?
Microsoft’s superpower lies in its formidable efficiency and robust economic moat, creating consistent value through high returns on invested capital. Its main point of vigilance is the premium valuation, which could pressure future gains. This stock suits portfolios aiming for steady, long-term growth with a tolerance for elevated multiples.
Wix.com’s strategic moat centers on its rapid revenue growth and innovation in cloud-based platform services, offering a dynamic growth trajectory. However, its weaker balance sheet and ongoing value destruction require careful monitoring. It fits investors with a higher risk appetite seeking aggressive growth and turnaround potential.
If you prioritize durable value creation and financial stability, Microsoft outshines Wix with its strong moat and resilient cash flows. However, if you seek high-growth opportunities and can endure volatility, Wix offers superior upside potential despite current weaknesses. Each choice reflects a distinct investor profile balancing growth versus stability.
Disclaimer: Investment carries a risk of loss of initial capital. The past performance is not a reliable indicator of future results. Be sure to understand risks before making an investment decision.
Go Further
I encourage you to read the complete analyses of Microsoft Corporation and Wix.com Ltd. to enhance your investment decisions: