Home > Comparison > Technology > MSFT vs VERI
The strategic rivalry between Microsoft Corporation and Veritone, Inc. shapes the evolving landscape of technology infrastructure software. Microsoft, a capital-intensive tech behemoth, contrasts sharply with Veritone’s agile AI-focused platform model. This head-to-head pits established scale and diversification against innovative specialization. This analysis aims to identify which company offers a superior risk-adjusted return profile, guiding investors seeking balanced exposure within the dynamic technology sector.
Table of contents
Companies Overview
Microsoft Corporation and Veritone, Inc. represent two distinct forces within the software infrastructure sector, each shaping the AI and cloud landscape uniquely.
Microsoft Corporation: Global Software and Cloud Powerhouse
Microsoft dominates as a technology giant in software infrastructure. It generates revenue through diversified segments: Productivity and Business Processes, Intelligent Cloud, and More Personal Computing. The company’s 2026 strategy centers on expanding Azure cloud services and integrating AI across enterprise solutions to deepen its competitive moat in cloud computing and productivity software.
Veritone, Inc.: Niche AI Innovator
Veritone operates as a specialized AI computing solutions provider. It monetizes its aiWARE platform, leveraging machine learning for cognitive data analysis across media, legal, and government sectors. In 2026, Veritone focuses on scaling its AI platform capabilities and expanding media advertising services to capture data-driven insights and build market share in targeted verticals.
Strategic Collision: Similarities & Divergences
Both companies invest heavily in AI-driven software solutions, yet Microsoft emphasizes a broad cloud ecosystem while Veritone targets niche AI applications. Their primary battleground lies in enterprise AI adoption, with Microsoft competing on scale and integration, Veritone on specialized innovation. This contrast defines distinct investment profiles: Microsoft offers stability and scale, Veritone presents high volatility with growth potential.
Income Statement Comparison
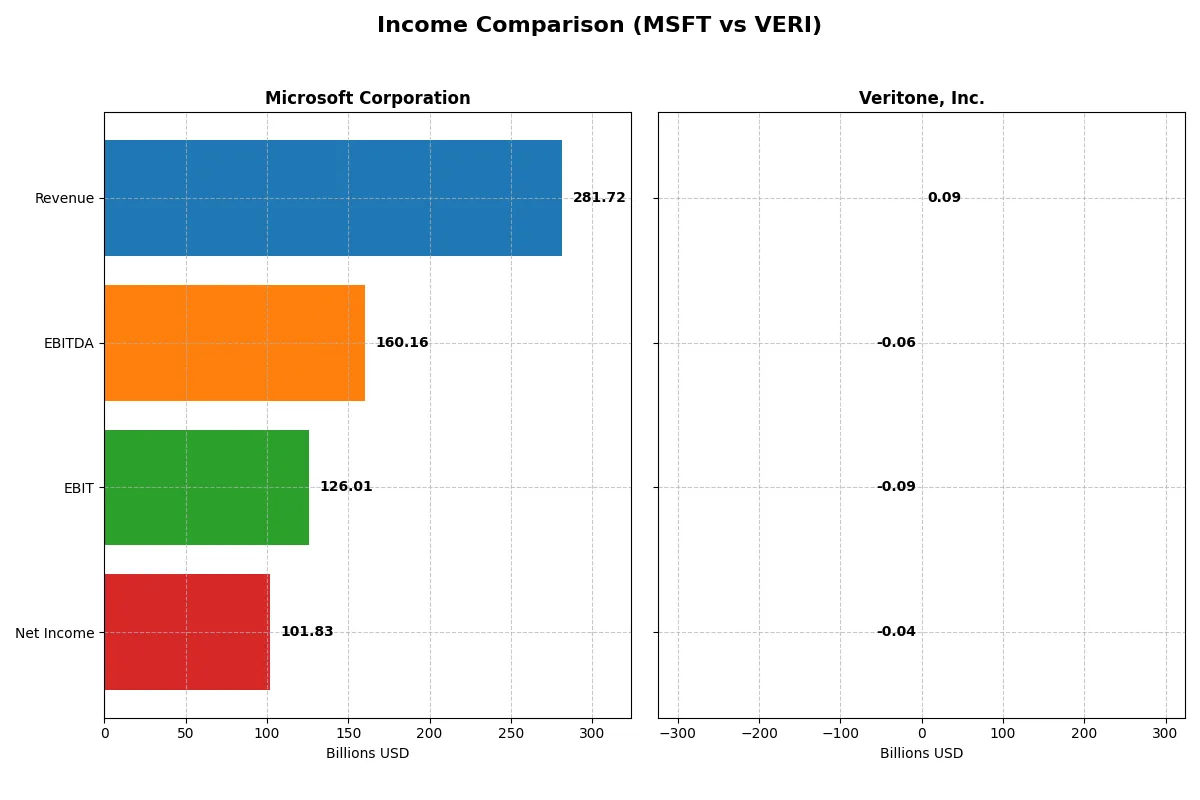
This data dissects the core profitability and scalability of both corporate engines to reveal who dominates the bottom line:
| Metric | Microsoft Corporation (MSFT) | Veritone, Inc. (VERI) |
|---|---|---|
| Revenue | 282B | 93M |
| Cost of Revenue | 88B | 27M |
| Operating Expenses | 65B | 154M |
| Gross Profit | 194B | 65M |
| EBITDA | 160B | -59M |
| EBIT | 126B | -88M |
| Interest Expense | 2.4B | 12M |
| Net Income | 102B | -37M |
| EPS | 13.7 | -0.98 |
| Fiscal Year | 2025 | 2024 |
Income Statement Analysis: The Bottom-Line Duel
This income statement comparison reveals how efficiently each company converts revenue into profit, exposing their operational strengths and weaknesses.
Microsoft Corporation Analysis
Microsoft demonstrates robust revenue growth from $168B in 2021 to $282B in 2025, with net income surging from $61B to $102B. Its gross margin remains strong above 68%, while the net margin at 36% signals excellent profitability. The 2025 fiscal year shows sustained momentum with a 15% revenue increase and stable margin health.
Veritone, Inc. Analysis
Veritone’s revenue grew from $58M in 2020 to $93M in 2024 but fell 7% year-over-year to $93M. Despite a favorable gross margin near 71%, its EBIT margin is deeply negative at -95%, reflecting high operating costs and losses. The 2024 net loss narrowed to $37M, marking some improvement but still highlighting ongoing challenges.
Margin Strength vs. Profitability Scale
Microsoft clearly leads with superior scale and consistent profitability, outperforming Veritone’s smaller and loss-making profile. Investors seeking stable earnings and margin resilience will find Microsoft’s financials much more attractive given its dominant market position and efficient cost management. Veritone remains a high-risk turnaround story with negative margins and uneven revenue trends.
Financial Ratios Comparison
These vital ratios act as a diagnostic tool to expose the underlying fiscal health, valuation premiums, and capital efficiency of each company:
| Ratios | Microsoft Corporation (MSFT) | Veritone, Inc. (VERI) |
|---|---|---|
| ROE | 29.6% | -277.9% |
| ROIC | 22.0% | -58.3% |
| P/E | 36.3 | -3.34 |
| P/B | 10.8 | 9.27 |
| Current Ratio | 1.35 | 0.97 |
| Quick Ratio | 1.35 | 0.97 |
| D/E (Debt-to-Equity) | 0.18 | 8.91 |
| Debt-to-Assets | 9.8% | 60.5% |
| Interest Coverage | 53.9 | -7.31 |
| Asset Turnover | 0.46 | 0.47 |
| Fixed Asset Turnover | 1.23 | 8.51 |
| Payout ratio | 23.6% | 0 |
| Dividend yield | 0.65% | 0 |
| Fiscal Year | 2025 | 2024 |
Efficiency & Valuation Duel: The Vital Signs
Financial ratios act as the company’s DNA, revealing hidden risks and operational excellence beneath surface metrics.
Microsoft Corporation
Microsoft delivers robust profitability with a 29.65% ROE and a strong 36.15% net margin, showcasing operational efficiency. Its P/E ratio of 36.31 signals a stretched valuation compared to sector norms. Shareholders receive modest dividends at 0.65%, while reinvestment heavily funds R&D, fueling growth and sustaining its wide economic moat.
Veritone, Inc.
Veritone struggles with deeply negative profitability metrics, including a -277.91% ROE and -40.36% net margin, reflecting operational challenges. The P/E ratio is negative but misleading due to losses, and its valuation appears inexpensive at 2.46 EV/S. No dividends are paid; capital primarily fuels research and development amid heavy leverage and liquidity risks.
Operational Strength vs. Financial Strain
Microsoft balances strong returns and high valuation, offering a stable risk-reward profile backed by consistent cash flow and capital allocation. Veritone’s metrics reveal severe financial distress and inefficiency, with high leverage and negative returns. Investors seeking stability align with Microsoft, while those tolerating risk may consider Veritone’s turnaround potential.
Which one offers the Superior Shareholder Reward?
I compare Microsoft and Veritone’s shareholder reward models through dividends, payout ratios, and buybacks. Microsoft pays a 0.65% dividend yield with a 24% payout ratio, well-covered by free cash flow. Its buyback program is robust, enhancing total returns. Veritone offers no dividends and negative margins, reinvesting heavily in growth but burdened by high leverage and negative cash flow. Microsoft’s sustainable, balanced distribution and capital allocation clearly offer superior long-term shareholder value in 2026.
Comparative Score Analysis: The Strategic Profile
The radar chart reveals the fundamental DNA and trade-offs of Microsoft Corporation and Veritone, Inc., highlighting their distinct financial strengths and vulnerabilities:
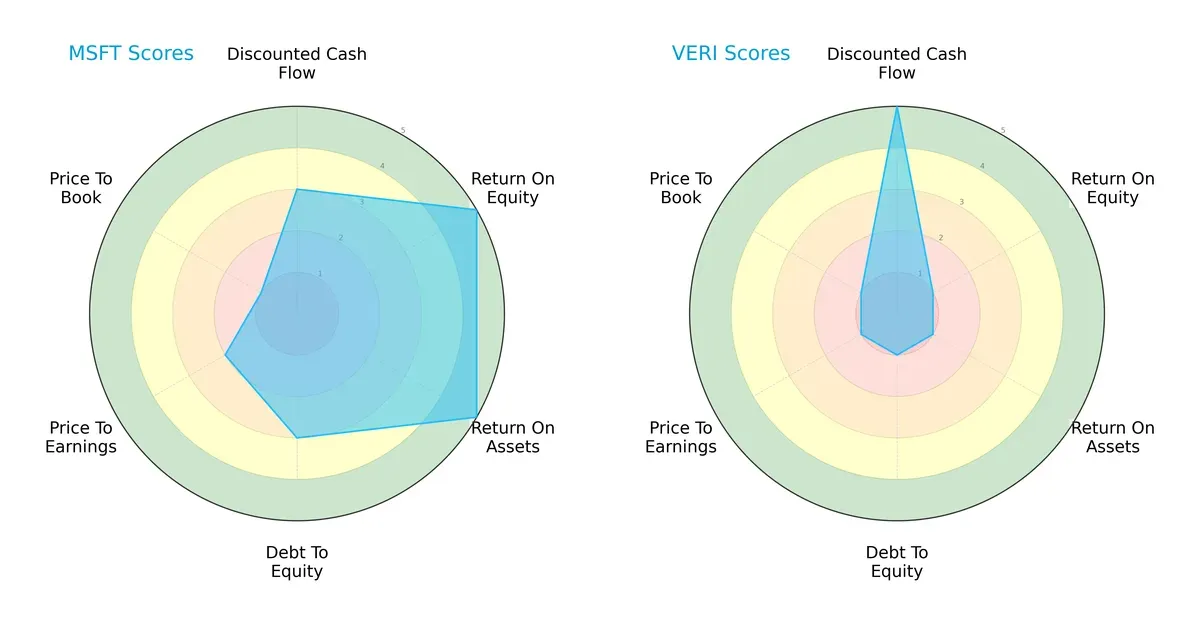
Microsoft delivers a balanced and robust profile with top-tier returns on equity and assets (scores of 5 each), moderate debt management (score 3), and decent DCF valuation (score 3). Veritone excels in discounted cash flow at a perfect score of 5, suggesting strong growth potential, but it struggles with profitability and leverage, reflected by very low ROE, ROA, and debt-to-equity scores of 1. Microsoft maintains a diversified advantage, while Veritone relies heavily on valuation optimism.
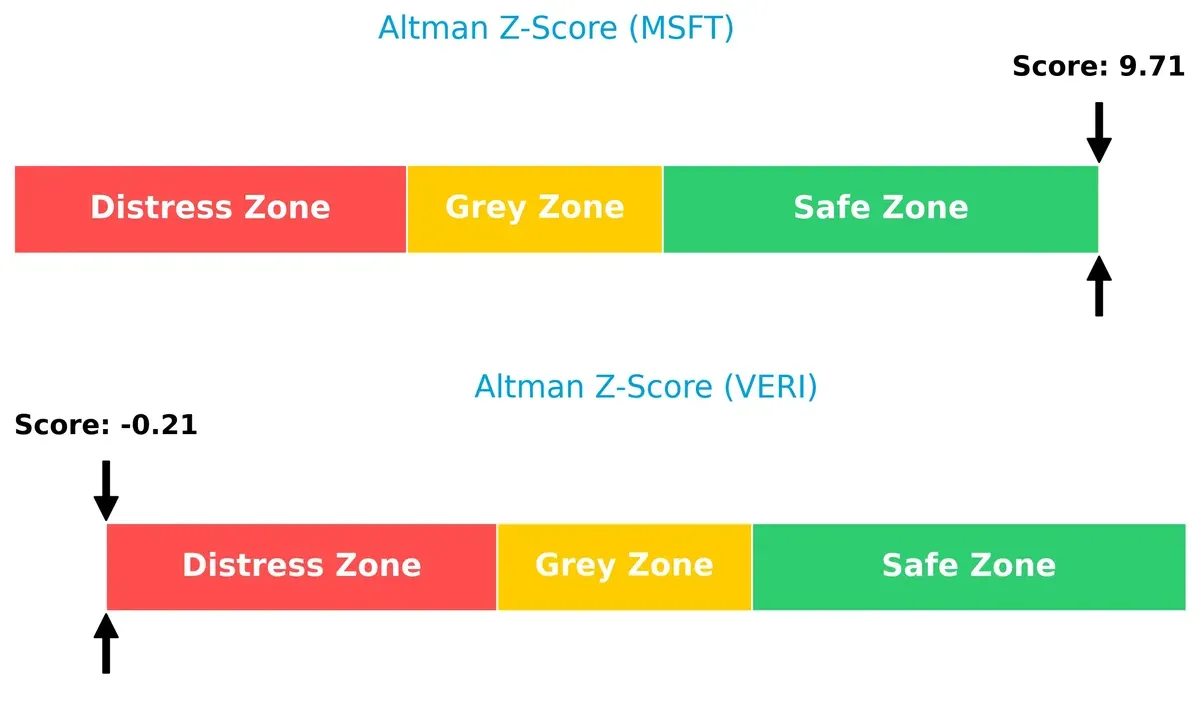
Bankruptcy Risk: Solvency Showdown
Microsoft’s Altman Z-Score at 9.7 places it firmly in the safe zone, signaling strong resilience. Veritone’s negative score near -0.2 signals distress and a high bankruptcy risk in this economic cycle:
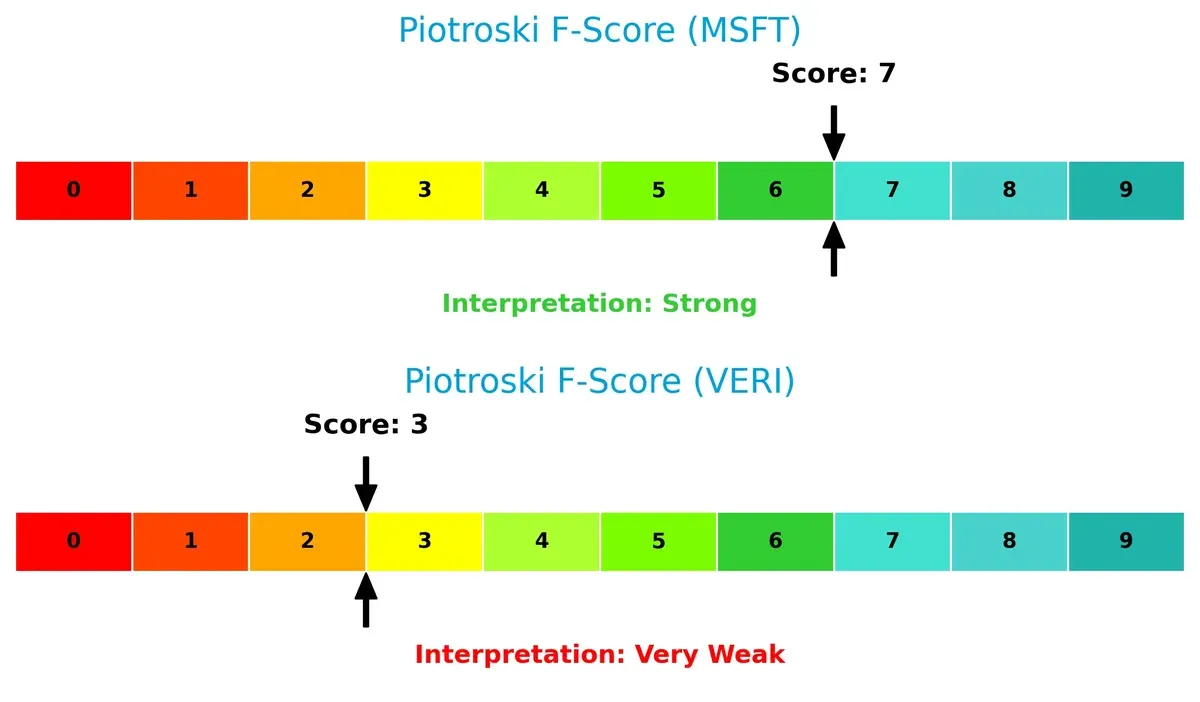
Financial Health: Quality of Operations
Microsoft’s Piotroski F-Score of 7 indicates strong financial health and operational quality. Veritone’s low score of 3 raises red flags about its internal financial stability and operational efficiency:
How are the two companies positioned?
This section dissects the operational DNA of Microsoft and Veritone by comparing their revenue distribution and internal dynamics. The goal is to confront their economic moats and identify which model offers the most resilient, sustainable advantage today.
Revenue Segmentation: The Strategic Mix
This visual comparison dissects how Microsoft Corporation and Veritone, Inc. diversify their income streams and where their primary sector bets lie:
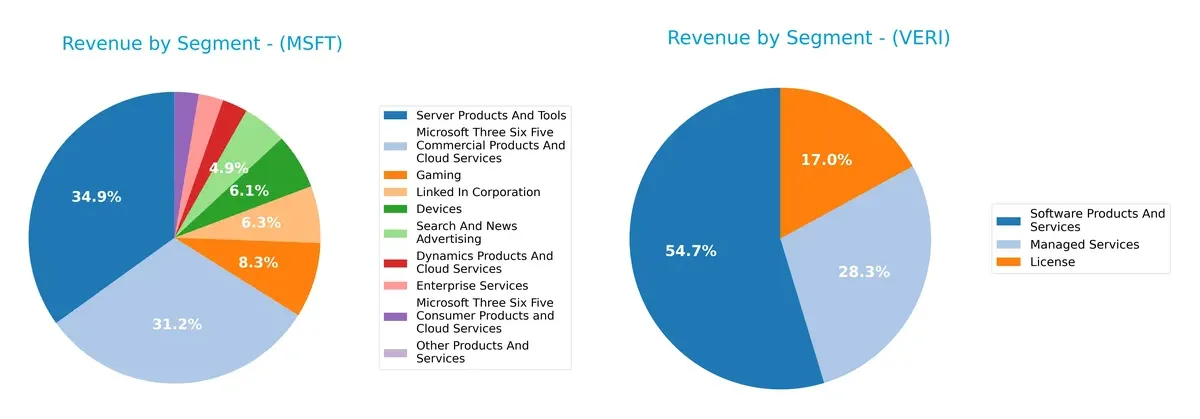
Microsoft’s revenue dwarfs Veritone’s, anchored by robust segments like Server Products and Tools at $98.4B and Microsoft 365 Commercial at $87.8B. Microsoft boasts a broad portfolio across gaming, devices, and advertising, demonstrating strong ecosystem lock-in. Veritone relies heavily on Software Products and Services at $61.1M, with less diversification and higher concentration risk in managed services and licensing. Microsoft’s scale ensures infrastructure dominance, while Veritone faces challenges expanding beyond niche AI markets.
Strengths and Weaknesses Comparison
This table compares the strengths and weaknesses of Microsoft Corporation and Veritone, Inc.:
Microsoft Corporation Strengths
- Diverse revenue streams across cloud, gaming, software, devices, and advertising
- Strong global presence with substantial US and non-US revenue
- High profitability with net margin 36.15% and ROIC 22.02%
- Low debt and strong interest coverage ratio
- Consistent innovation in cloud and enterprise products
Veritone, Inc. Strengths
- Favorable PE ratio indicating low market valuation
- High fixed asset turnover suggests efficient use of fixed assets
Microsoft Corporation Weaknesses
- High price-to-book (PB) and price-to-earnings (PE) ratios may indicate overvaluation
- Unfavorable asset turnover ratio limits efficiency
- Low dividend yield at 0.65%
Veritone, Inc. Weaknesses
- Negative profitability metrics: net margin -40.36%, ROE -277.91%, ROIC -58.27%
- High leverage with debt-to-assets 60.54% and weak interest coverage
- Low liquidity with current ratio below 1
- Limited global presence and smaller scale revenue streams
Microsoft’s strengths lie in its diversified business model, global footprint, and strong profitability, but it faces valuation concerns and moderate asset efficiency. Veritone struggles with profitability, leverage, and liquidity, despite operational efficiency in fixed assets, highlighting strategic challenges in scaling and financial stability.
The Moat Duel: Analyzing Competitive Defensibility
A structural moat is the only thing protecting long-term profits from the relentless erosion of competition. Let’s examine their core moats:
Microsoft Corporation: Ecosystem Lock-In and Scale Advantage
Microsoft’s moat stems from deep ecosystem lock-in and intangible assets like Office 365 and Azure. This generates high ROIC (~13% above WACC) and margin stability (~36% net margin). Its expanding cloud and AI offerings in 2026 should deepen this competitive edge.
Veritone, Inc.: Emerging AI Platform with Fragile Profitability
Veritone relies on AI platform innovation but lacks scale and consistent profitability, reflected in a deeply negative ROIC vs. WACC and volatile margins (-40% net margin). Growth opportunities exist, yet declining ROIC warns of moat fragility amid rising competition.
Ecosystem Lock-In vs. Nascent Innovation: Moat Depths Compared
Microsoft’s wide, entrenched ecosystem delivers sustained value creation despite slight ROIC decline. Veritone’s narrow, early-stage moat fails to cover capital costs and shows worsening profitability. Microsoft clearly commands the deeper moat and is better equipped to defend market share.
Which stock offers better returns?
The past year reveals contrasting trajectories: Microsoft Corporation posts a slight overall gain with decelerating momentum, while Veritone, Inc. experiences a steady decline marked by subdued volatility and shrinking prices.
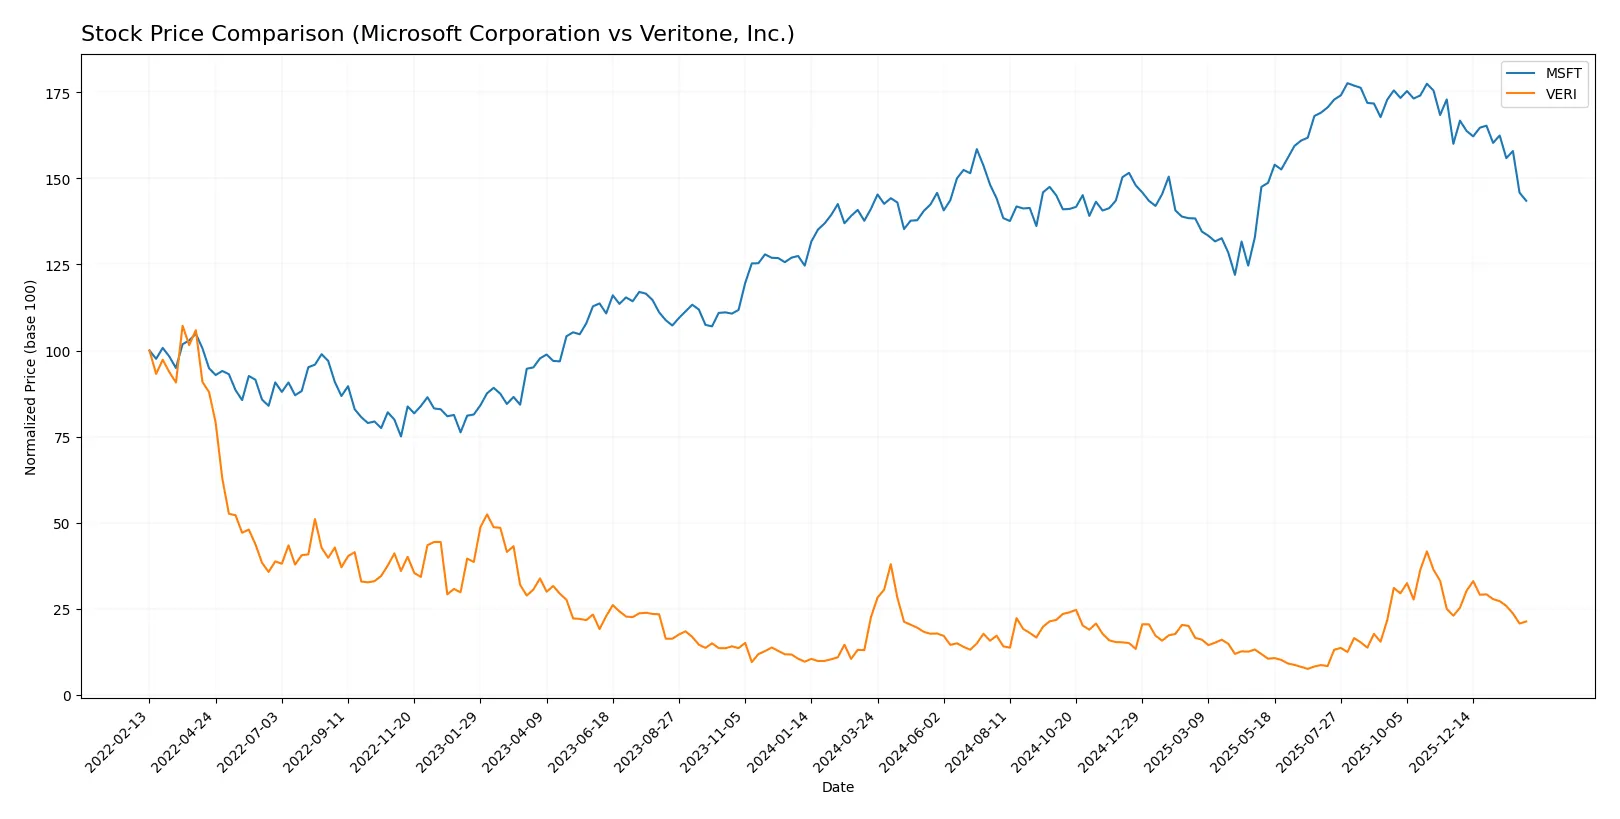
Trend Comparison
Microsoft’s stock rose 1.67% over the last 12 months, signaling a bullish but decelerating trend. It hit a high of 524.11 and a low of 359.84, with high volatility (std dev 41.8).
Veritone’s shares declined 5.41% over the same period, reflecting a bearish, decelerating trend. The price fluctuated between 1.3 and 7.18, showing very low volatility (std dev 1.25).
Between these two, Microsoft outperformed Veritone in market returns despite recent short-term weakness for both stocks.
Target Prices
Analysts present a bullish consensus for Microsoft Corporation and Veritone, Inc.
| Company | Target Low | Target High | Consensus |
|---|---|---|---|
| Microsoft Corporation | 450 | 675 | 600.04 |
| Veritone, Inc. | 9 | 10 | 9.5 |
Microsoft’s target consensus at 600 suggests significant upside from the current 423 price, reflecting its dominant cloud and software moat. Veritone’s target near 9.5 signals strong growth expectations far above its 3.67 market price.

Don’t Let Luck Decide Your Entry Point
Optimize your entry points with our advanced ProRealTime indicators. You’ll get efficient buy signals with precise price targets for maximum performance. Start outperforming now!
How do institutions grade them?
This section compares the recent institutional grades assigned to Microsoft Corporation and Veritone, Inc.:
Microsoft Corporation Grades
The table below summarizes recent grades from recognized financial institutions for Microsoft Corporation.
| Grading Company | Action | New Grade | Date |
|---|---|---|---|
| Citigroup | maintain | Buy | 2026-01-30 |
| Wedbush | maintain | Outperform | 2026-01-29 |
| Cantor Fitzgerald | maintain | Overweight | 2026-01-29 |
| RBC Capital | maintain | Outperform | 2026-01-29 |
| Stifel | maintain | Buy | 2026-01-29 |
| DA Davidson | maintain | Buy | 2026-01-29 |
| Keybanc | maintain | Overweight | 2026-01-29 |
| Piper Sandler | maintain | Overweight | 2026-01-29 |
| Evercore ISI Group | maintain | Outperform | 2026-01-29 |
| Wells Fargo | maintain | Overweight | 2026-01-29 |
Veritone, Inc. Grades
Below are recent grades from established firms for Veritone, Inc.
| Grading Company | Action | New Grade | Date |
|---|---|---|---|
| D. Boral Capital | maintain | Buy | 2026-01-30 |
| D. Boral Capital | maintain | Buy | 2025-12-09 |
| D. Boral Capital | maintain | Buy | 2025-12-04 |
| D. Boral Capital | maintain | Buy | 2025-12-02 |
| Needham | maintain | Buy | 2025-12-02 |
| D. Boral Capital | maintain | Buy | 2025-11-07 |
| D. Boral Capital | maintain | Buy | 2025-10-28 |
| HC Wainwright & Co. | maintain | Buy | 2025-10-20 |
| D. Boral Capital | maintain | Buy | 2025-10-15 |
| D. Boral Capital | maintain | Buy | 2025-09-24 |
Which company has the best grades?
Microsoft Corporation consistently receives higher-tier ratings like Outperform and Overweight from multiple reputable firms, compared to Veritone’s uniform Buy ratings. This range suggests a stronger consensus on Microsoft’s growth potential, which may influence investor confidence and portfolio allocation decisions.
Risks specific to each company
The following categories identify the critical pressure points and systemic threats facing both firms in the 2026 market environment:
1. Market & Competition
Microsoft Corporation
- Dominates with diversified, global software and cloud platforms; strong moats in enterprise solutions and cloud computing.
Veritone, Inc.
- Faces intense competition in AI software with limited scale and brand recognition, struggling to gain market share.
2. Capital Structure & Debt
Microsoft Corporation
- Maintains a low debt-to-equity ratio (0.18) and strong interest coverage (52.84), signaling robust financial stability.
Veritone, Inc.
- High debt-to-equity (8.91) and negative interest coverage (-7.3) raise significant solvency concerns and financial risk.
3. Stock Volatility
Microsoft Corporation
- Beta of 1.08 suggests moderate volatility aligned with the tech sector; large market cap dampens extreme swings.
Veritone, Inc.
- Beta of 2.14 indicates high stock volatility, reflecting speculative trading and elevated risk for investors.
4. Regulatory & Legal
Microsoft Corporation
- Faces regulatory scrutiny due to size and market power but benefits from established compliance infrastructure.
Veritone, Inc.
- Operates in AI with evolving regulations; limited resources may hinder proactive compliance and risk mitigation.
5. Supply Chain & Operations
Microsoft Corporation
- Robust global supply chain and diversified operations reduce operational risks significantly.
Veritone, Inc.
- Smaller scale and reliance on third-party technologies increase vulnerability to supply chain disruptions.
6. ESG & Climate Transition
Microsoft Corporation
- Invests heavily in sustainability initiatives and climate goals, enhancing long-term resilience and reputation.
Veritone, Inc.
- ESG efforts less transparent and less developed, posing reputational and regulatory risks as ESG standards tighten.
7. Geopolitical Exposure
Microsoft Corporation
- Global footprint exposes it to geopolitical tensions but also provides risk diversification.
Veritone, Inc.
- Primarily US and UK markets, limiting geopolitical risk but also growth opportunities in emerging regions.
Which company shows a better risk-adjusted profile?
Microsoft’s dominant market position, strong balance sheet, and robust operational infrastructure deliver a notably superior risk-adjusted profile. Veritone’s high leverage, negative profitability, and elevated stock volatility expose it to substantial financial and market risks. Microsoft’s Altman Z-Score of 9.7 confirms low bankruptcy risk, while Veritone’s negative score flags distress. The stark contrast in debt levels and profitability underscores my concern for Veritone’s financial health amid a competitive AI landscape.
Final Verdict: Which stock to choose?
Microsoft’s superpower lies in its unmatched ability to generate consistent free cash flow and create shareholder value. Its slightly declining ROIC signals a point of vigilance, but the company’s robust moat and strong profitability suit a core growth or dividend-growth portfolio focused on stability and innovation.
Veritone’s strategic moat is its niche AI technology, which could unlock long-term growth if execution improves. However, its current financial fragility and negative returns indicate higher risk relative to Microsoft. It fits a speculative growth portfolio for investors willing to tolerate volatility and uncertainty.
If you prioritize dependable cash flow and durable competitive advantages, Microsoft outshines Veritone with superior financial strength and operational efficiency. However, if you seek high-risk, high-reward exposure to emerging AI technologies, Veritone offers a speculative avenue despite its financial challenges. Each choice aligns with distinct investor risk appetites and strategic goals.
Disclaimer: Investment carries a risk of loss of initial capital. The past performance is not a reliable indicator of future results. Be sure to understand risks before making an investment decision.
Go Further
I encourage you to read the complete analyses of Microsoft Corporation and Veritone, Inc. to enhance your investment decisions: