Home > Comparison > Technology > MSFT vs VRSN
The strategic rivalry between Microsoft Corporation and VeriSign, Inc. shapes the Technology sector’s infrastructure landscape. Microsoft is a diversified software powerhouse spanning cloud, productivity, and personal computing. VeriSign operates a niche, capital-light model focused on internet domain registry and security services. This analysis pits broad innovation against specialized stability, aiming to identify which trajectory delivers superior risk-adjusted returns for a balanced portfolio.
Table of contents
Companies Overview
Microsoft Corporation and VeriSign, Inc. each hold critical roles in the technology infrastructure landscape.
Microsoft Corporation: Global Software and Cloud Powerhouse
Microsoft dominates as a software infrastructure leader, generating revenue through diversified segments: Productivity and Business Processes, Intelligent Cloud, and More Personal Computing. In 2026, its strategic focus remains on expanding Azure cloud services and integrating AI solutions across its product suite, reinforcing its competitive advantage in enterprise software and cloud ecosystems.
VeriSign, Inc.: Internet Security and Domain Authority
VeriSign operates as a key internet infrastructure provider, earning primarily from managing domain name registries and ensuring the stability of the .com and .net domains. Its 2026 strategy centers on maintaining robust security and resiliency of internet navigation, leveraging its authoritative role in root zone services to support global e-commerce infrastructure.
Strategic Collision: Similarities & Divergences
Microsoft pursues a broad ecosystem strategy integrating cloud, software, and devices, while VeriSign focuses on a specialized, mission-critical niche securing internet infrastructure. Their primary battleground lies in infrastructure reliability and trustworthiness, crucial for enterprise and internet operations. Microsoft’s expansive scale contrasts with VeriSign’s focused domain authority, creating distinct investment profiles in scope and operational leverage.
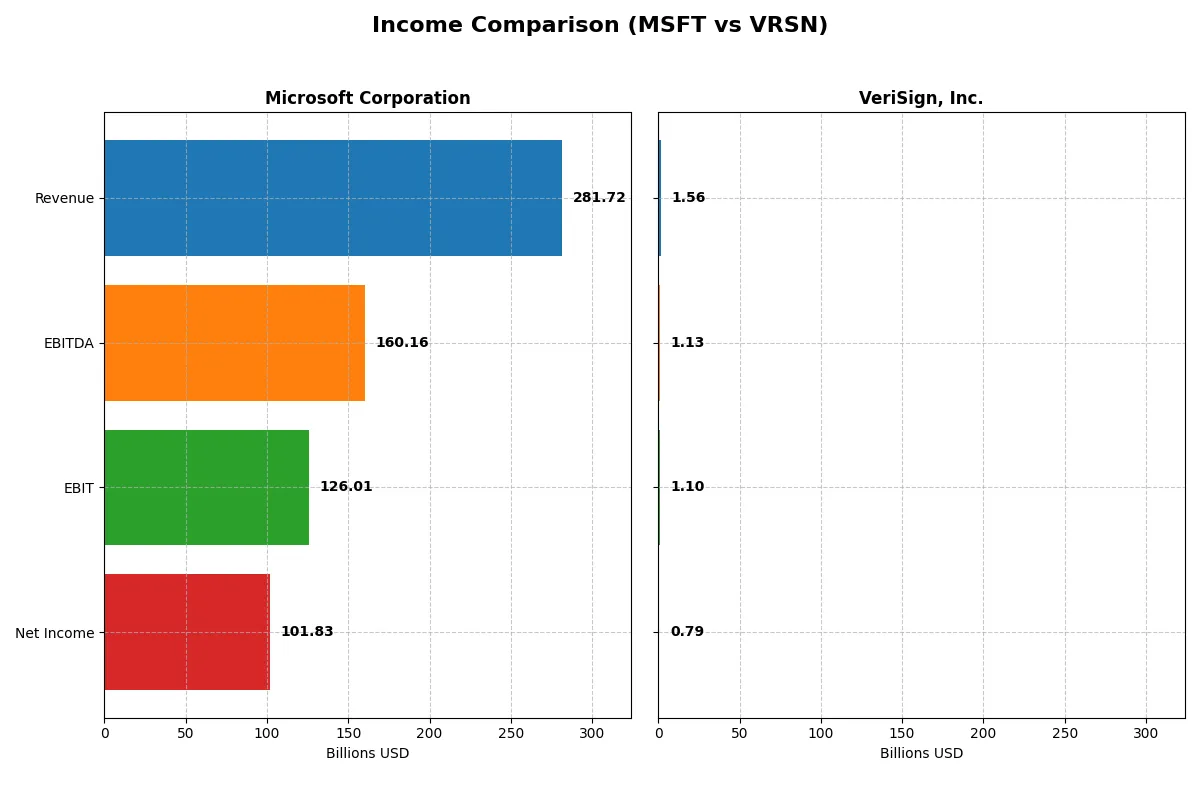
Income Statement Comparison
This data dissects the core profitability and scalability of both corporate engines to reveal who dominates the bottom line:
| Metric | Microsoft Corporation (MSFT) | VeriSign, Inc. (VRSN) |
|---|---|---|
| Revenue | 282B | 1.56B |
| Cost of Revenue | 88B | 191M |
| Operating Expenses | 65.4B | 308M |
| Gross Profit | 194B | 1.37B |
| EBITDA | 160B | 1.13B |
| EBIT | 126B | 1.10B |
| Interest Expense | 2.39B | 75.3M |
| Net Income | 102B | 786M |
| EPS | 13.7 | 8.01 |
| Fiscal Year | 2025 | 2024 |
Income Statement Analysis: The Bottom-Line Duel
This income statement comparison reveals which company operates with greater profitability and efficiency, reflecting their true earning power in competitive markets.
Microsoft Corporation Analysis
Microsoft’s revenue surged from $168B in 2021 to $282B in 2025, with net income rising from $61B to $102B. It maintains strong gross and net margins, around 69% and 36% respectively, indicating robust cost control and pricing power. In 2025, Microsoft’s efficiency shines as operating income hits $129B, supported by disciplined R&D and SG&A spending growth.
VeriSign, Inc. Analysis
VeriSign’s revenue rose moderately from $1.27B in 2020 to $1.56B in 2024, with net income declining from $815M to $786M over the same period. It boasts superior margins, with gross at 88% and net at 50%, reflecting its niche market dominance. However, 2024’s slight dip in net margin and income signals margin pressure, despite solid operating income near $1.06B.
Scale Dominance vs. Margin Excellence
Microsoft outstrips VeriSign in revenue scale and net income, growing aggressively with favorable margin trends. VeriSign excels in margin metrics but faces declining net income and margin compression. For investors, Microsoft’s profile offers expansive growth and operating leverage, while VeriSign’s margin strength suits those valuing steady profitability in a specialized sector.
Financial Ratios Comparison
These vital ratios act as a diagnostic tool to expose the underlying fiscal health, valuation premiums, and capital efficiency of each company:
| Ratios | Microsoft Corporation (MSFT) | VeriSign, Inc. (VRSN) |
|---|---|---|
| ROE | 29.6% | -40.1% |
| ROIC | 22.0% | 451.0% |
| P/E | 36.3 | 25.8 |
| P/B | 10.8 | -10.4 |
| Current Ratio | 1.35 | 0.43 |
| Quick Ratio | 1.35 | 0.43 |
| D/E (Debt-to-Equity) | 0.18 | -0.92 |
| Debt-to-Assets | 9.8% | 128.1% |
| Interest Coverage | 53.9 | 14.1 |
| Asset Turnover | 0.46 | 1.11 |
| Fixed Asset Turnover | 1.23 | 6.66 |
| Payout ratio | 23.6% | 0% |
| Dividend yield | 0.65% | 0% |
| Fiscal Year | 2025 | 2024 |
Efficiency & Valuation Duel: The Vital Signs
Ratios act as a company’s DNA, uncovering hidden risks and revealing operational excellence behind the financial statements.
Microsoft Corporation
Microsoft commands a strong profitability profile with a 29.65% ROE and 36.15% net margin, signaling efficient operations. However, its valuation is stretched, reflected by a high P/E of 36.31 and P/B of 10.76. Shareholders receive modest dividends at 0.65%, while the company reinvests heavily in R&D, fueling sustainable growth.
VeriSign, Inc.
VeriSign shows stellar operational efficiency with a 50.45% net margin and an extraordinary 451% ROIC, yet suffers from a negative ROE of -40.13%, indicating financial strain. Its valuation is less stretched than Microsoft’s, with a P/E of 25.84. VeriSign pays no dividend, prioritizing reinvestment to support its unique market niche.
Premium Valuation vs. Operational Contrasts
Microsoft balances strong profitability with a premium valuation and steady shareholder returns. VeriSign offers superior operational margins but carries financial and liquidity risks. Investors seeking stability may prefer Microsoft, while those favoring high operational efficiency and growth might consider VeriSign’s profile.
Which one offers the Superior Shareholder Reward?
I compare Microsoft and VeriSign’s shareholder rewards through dividends, payout ratios, and buybacks. Microsoft pays a 0.65% dividend yield with a sustainable 24% payout, supported by strong free cash flow of 9.6B per share. VeriSign offers no dividends, reinvesting all free cash flow (~8.9B per share) into growth and acquisitions. Microsoft also runs aggressive buybacks enhancing total return, while VeriSign’s buyback activity is less visible but benefits from high margins and cash flow conversion. I find Microsoft’s balanced distribution—steady dividends plus buybacks—delivers a more reliable and sustainable total return profile for 2026 investors.
Comparative Score Analysis: The Strategic Profile
The radar chart reveals the fundamental DNA and trade-offs of Microsoft Corporation and VeriSign, Inc., highlighting their distinct strategic strengths and vulnerabilities:
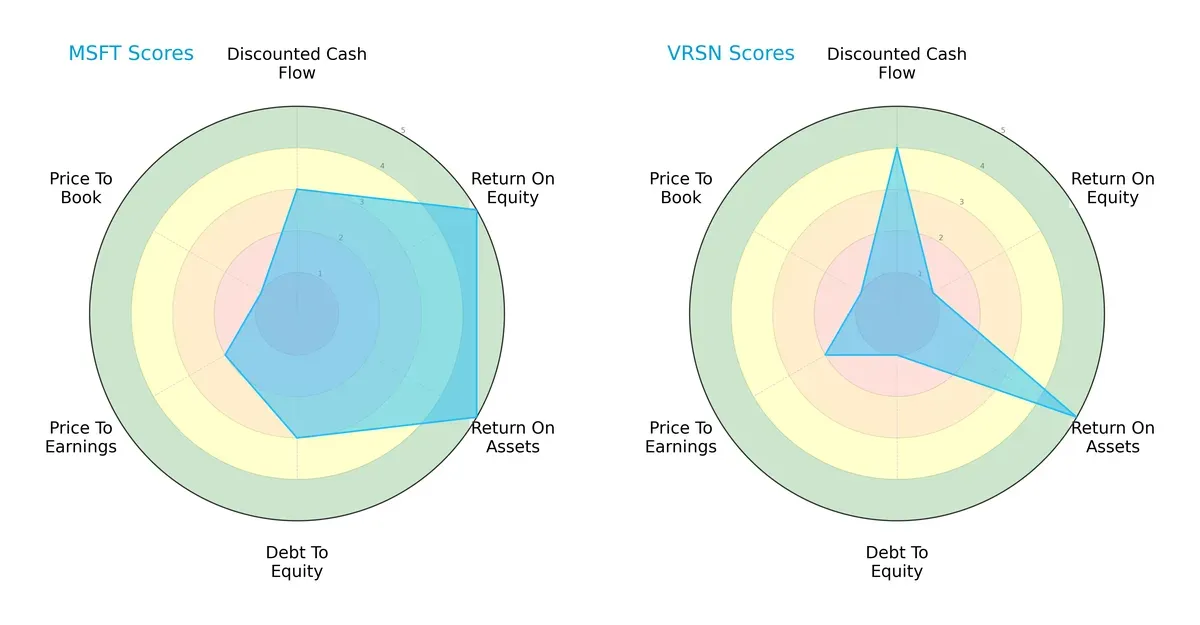
Microsoft displays a balanced profile with top-tier efficiency in ROE and ROA (scores of 5 each) and moderate financial risk (Debt/Equity score 3). VeriSign leans heavily on asset utilization (ROA 5) and discounted cash flow (DCF 4), but suffers from weak equity returns (ROE 1) and high leverage risk (Debt/Equity 1). Microsoft’s strength lies in comprehensive operational efficiency, while VeriSign relies on specific asset and cash flow advantages.
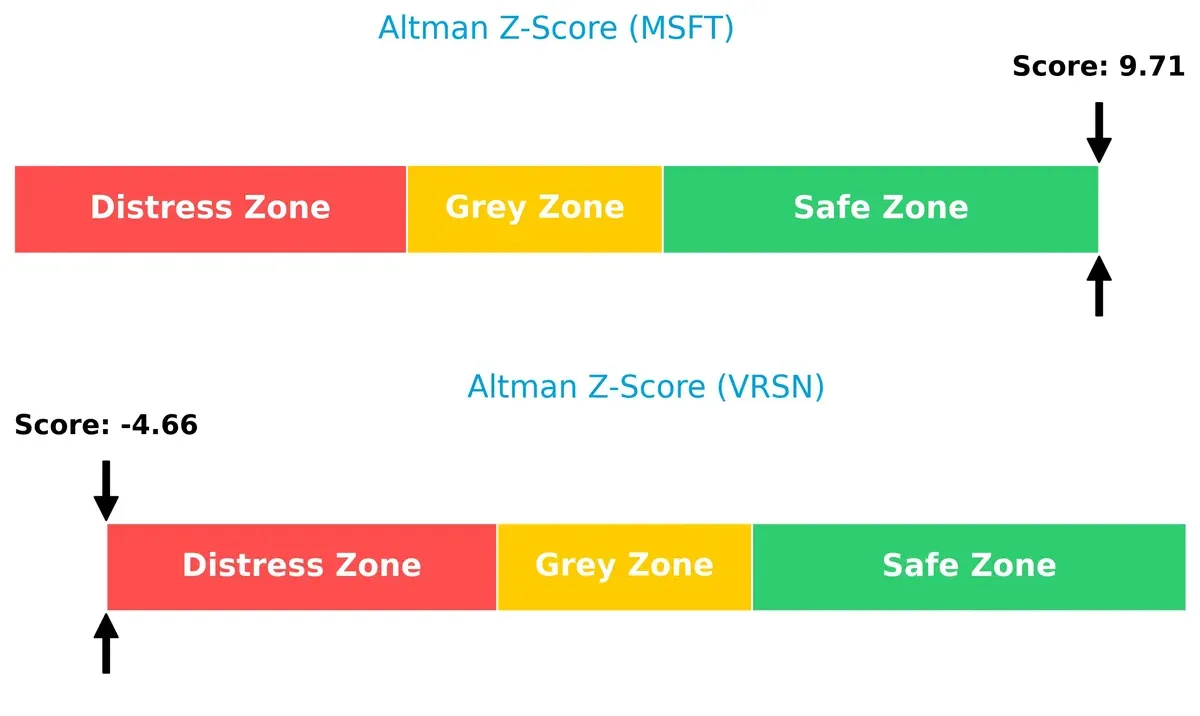
Bankruptcy Risk: Solvency Showdown
Microsoft’s Altman Z-Score of 9.7 places it solidly in the safe zone, signaling robust long-term solvency. VeriSign’s score of -4.7 indicates distress and a high bankruptcy risk in the current economic cycle:
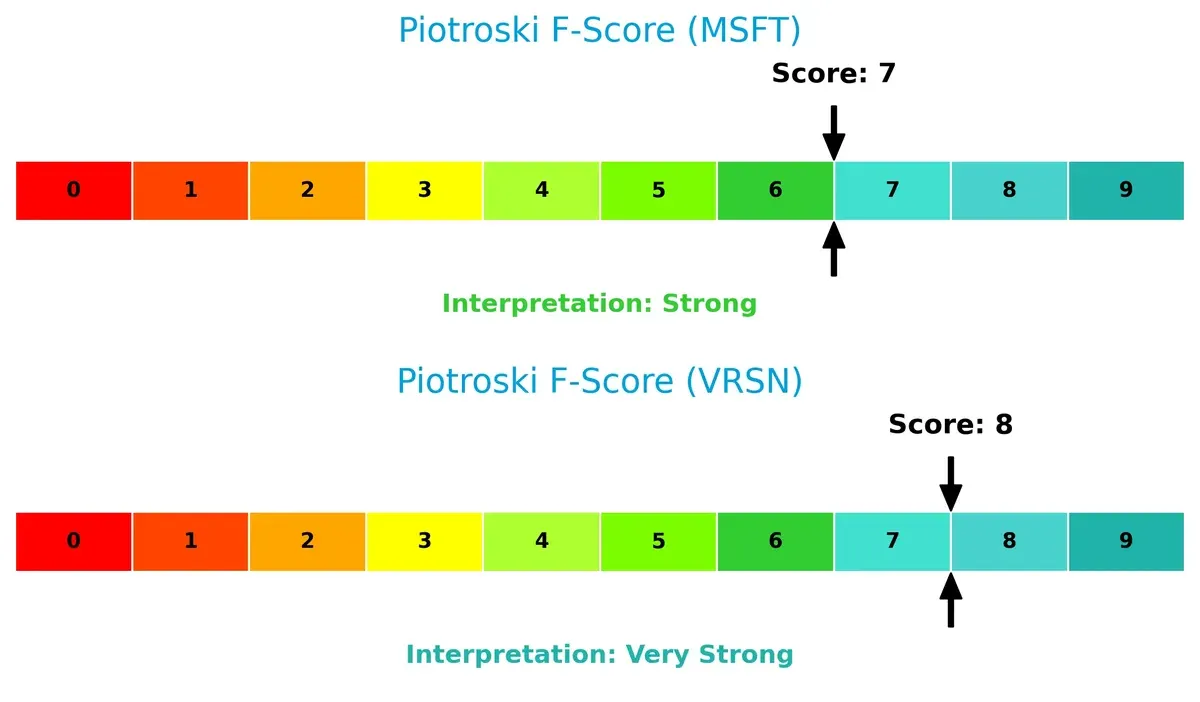
Financial Health: Quality of Operations
VeriSign edges Microsoft with a Piotroski F-Score of 8 versus 7, indicating very strong internal financial health. Microsoft’s score is strong but suggests slight caution compared to VeriSign’s nearly pristine operational metrics:
How are the two companies positioned?
This section dissects Microsoft and VeriSign’s operational DNA by comparing their revenue distribution and internal dynamics. Our goal is to confront their economic moats to reveal which model delivers the most resilient, sustainable competitive advantage today.
Revenue Segmentation: The Strategic Mix
This visual comparison dissects how Microsoft Corporation and VeriSign, Inc. diversify their income streams and where their primary sector bets lie:
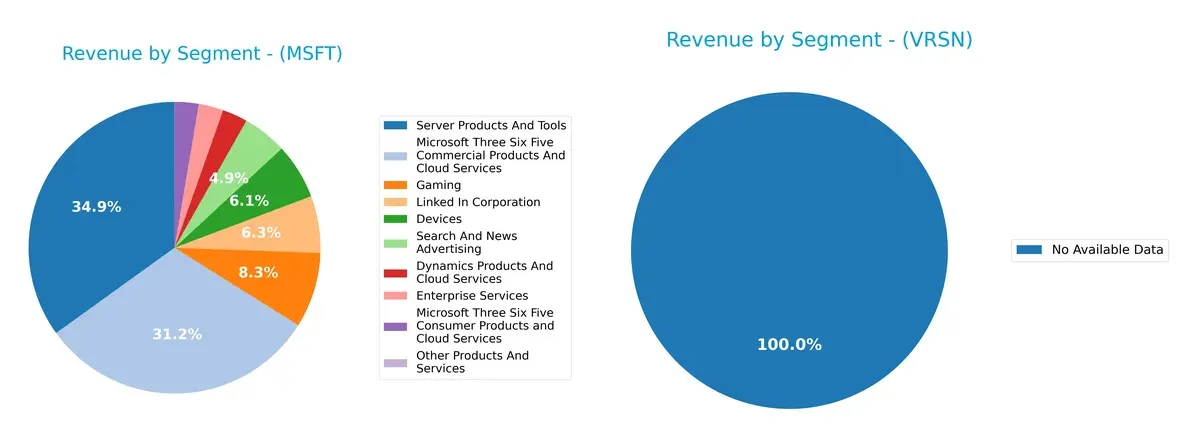
Microsoft’s revenue spans multiple segments, with Server Products and Tools anchoring at $98.4B and Microsoft 365 Commercial at $87.8B. Gaming and LinkedIn also contribute significantly, $23.5B and $17.8B respectively. VeriSign lacks available segment data, preventing direct comparison. Microsoft’s broad mix reduces concentration risk and signals ecosystem lock-in, while VeriSign’s unknown segmentation implies higher uncertainty for investors.
Strengths and Weaknesses Comparison
This table compares the Strengths and Weaknesses of Microsoft Corporation and VeriSign, Inc.:
Microsoft Strengths
- Diversified revenue streams across cloud, gaming, enterprise, and devices
- Strong global presence with $144B US and $137B non-US revenue in 2025
- Favorable profitability metrics: 36.15% net margin, 29.65% ROE, 22.02% ROIC
- Low debt levels and high interest coverage support financial stability
VeriSign Strengths
- Exceptional profitability with 50.45% net margin and 451% ROIC
- Favorable cost of capital at 7.13% WACC
- High asset turnover and fixed asset turnover indicate operational efficiency
- Favorable debt-to-equity despite unusual negative value, and solid interest coverage
Microsoft Weaknesses
- Unfavorable valuation multiples: PE 36.31 and PB 10.76 indicate expensive stock
- Asset turnover at 0.46 lags industry standards
- Dividend yield low at 0.65%
- Neutral current ratio at 1.35 may constrain short-term flexibility
VeriSign Weaknesses
- Negative ROE at -40.13% signals equity erosion
- High debt to assets at 128% raises solvency concerns
- Low liquidity with current and quick ratios at 0.43
- Zero dividend yield limits income for investors
Both companies show strong profitability but differ in financial structure and market valuation. Microsoft’s diversified model and global scale contrast with VeriSign’s high efficiency but liquidity and solvency risks. These factors shape their strategic priorities and risk profiles.
The Moat Duel: Analyzing Competitive Defensibility
A structural moat is the only reliable barrier protecting long-term profits from relentless competition erosion. Let’s analyze the competitive moats of two tech giants:
Microsoft Corporation: Ecosystem & Switching Costs Powerhouse
Microsoft’s moat stems primarily from its vast ecosystem and high switching costs, evident in stable margins and 44.7% EBIT margin in 2025. Its expanding cloud and AI segments could deepen this moat despite a slight ROIC decline.
VeriSign, Inc.: Monopoly on Internet Infrastructure
VeriSign commands a near-monopoly on critical domain registry services, reflected in an exceptional 70.5% EBIT margin and a soaring ROIC trend. This focused niche delivers durable value with limited direct competition, though growth remains moderate.
Verdict: Ecosystem Scale vs. Monopoly Durability
VeriSign’s moat is deeper, with ROIC vastly exceeding WACC and a strong upward trend, signaling durable competitive advantage. Microsoft’s wider ecosystem offers scale and diversification but faces margin pressures. VeriSign is better positioned to defend its narrow yet formidable market share.
Which stock offers better returns?
Stock prices of Microsoft Corporation and VeriSign, Inc. reveal distinct dynamics over the past year, with significant gains for VeriSign and moderate growth for Microsoft, both showing decelerating bullish trends.
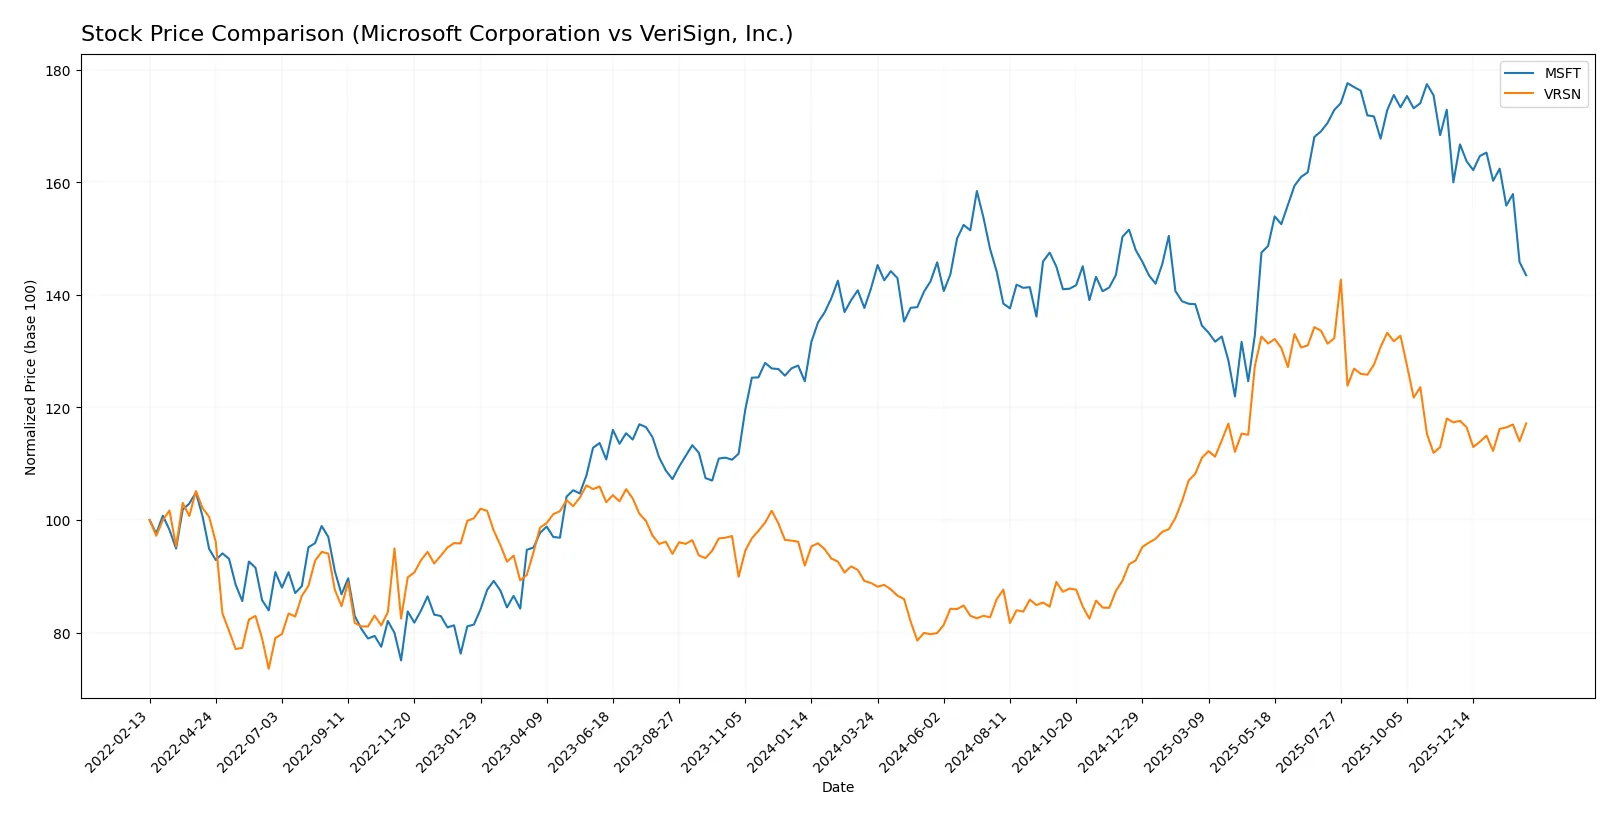
Trend Comparison
Microsoft’s stock rose 1.67% over the past 12 months, indicating a modest bullish trend with decelerating momentum and a volatility level near 42. The recent quarter shows a sharp -10.33% decline.
VeriSign’s shares increased 31.93% over the same period, reflecting a strong bullish trend with deceleration. Its recent three-month price change is nearly flat at -0.17%, with lower volatility than Microsoft.
VeriSign outperformed Microsoft in overall market return, delivering substantially higher gains despite both stocks exhibiting slowing upward trends over the past year.
Target Prices
Analysts set a bullish consensus for Microsoft Corporation and VeriSign, Inc., reflecting confidence in their growth trajectories.
| Company | Target Low | Target High | Consensus |
|---|---|---|---|
| Microsoft Corporation | 450 | 675 | 600.04 |
| VeriSign, Inc. | 325 | 325 | 325 |
Microsoft’s consensus target at 600.04 signals a 42% upside from the current 423.37 price, while VeriSign’s fixed target at 325 suggests a 29% potential gain.

Don’t Let Luck Decide Your Entry Point
Optimize your entry points with our advanced ProRealTime indicators. You’ll get efficient buy signals with precise price targets for maximum performance. Start outperforming now!
How do institutions grade them?
The following tables summarize recent institutional grades assigned to Microsoft Corporation and VeriSign, Inc.:
Microsoft Corporation Grades
This table shows the latest grades from major financial institutions for Microsoft Corporation.
| Grading Company | Action | New Grade | Date |
|---|---|---|---|
| Citigroup | Maintain | Buy | 2026-01-30 |
| Wedbush | Maintain | Outperform | 2026-01-29 |
| Cantor Fitzgerald | Maintain | Overweight | 2026-01-29 |
| RBC Capital | Maintain | Outperform | 2026-01-29 |
| Stifel | Maintain | Buy | 2026-01-29 |
| DA Davidson | Maintain | Buy | 2026-01-29 |
| Keybanc | Maintain | Overweight | 2026-01-29 |
| Piper Sandler | Maintain | Overweight | 2026-01-29 |
| Evercore ISI Group | Maintain | Outperform | 2026-01-29 |
| Wells Fargo | Maintain | Overweight | 2026-01-29 |
VeriSign, Inc. Grades
This table presents the recent institutional grades for VeriSign, Inc.
| Grading Company | Action | New Grade | Date |
|---|---|---|---|
| JP Morgan | Maintain | Neutral | 2026-01-06 |
| Baird | Maintain | Outperform | 2025-07-01 |
| Baird | Maintain | Outperform | 2025-04-25 |
| Baird | Maintain | Outperform | 2025-04-01 |
| Citigroup | Maintain | Buy | 2025-02-04 |
| Citigroup | Maintain | Buy | 2025-01-03 |
| Baird | Upgrade | Outperform | 2024-12-09 |
| Baird | Maintain | Neutral | 2024-06-27 |
| Baird | Maintain | Neutral | 2024-04-26 |
| Citigroup | Maintain | Buy | 2024-04-02 |
Which company has the best grades?
Microsoft holds consistently stronger grades overall, with multiple “Buy,” “Outperform,” and “Overweight” ratings from top firms. VeriSign’s ratings vary more, including “Neutral” and fewer recent upgrades. This disparity signals higher institutional confidence in Microsoft, potentially influencing investor sentiment and valuation.
Risks specific to each company
The following categories identify critical pressure points and systemic threats facing Microsoft Corporation and VeriSign, Inc. in the 2026 market environment:
1. Market & Competition
Microsoft Corporation
- Faces intense competition across cloud, software, and gaming sectors from both legacy and cloud-native players.
VeriSign, Inc.
- Operates a niche domain registry market but faces risks from potential new entrants and alternative internet infrastructure models.
2. Capital Structure & Debt
Microsoft Corporation
- Maintains a strong balance sheet with low debt-to-equity (0.18) and excellent interest coverage (52.84).
VeriSign, Inc.
- Exhibits concerning leverage metrics with debt-to-assets exceeding 128%, signaling financial risk despite favorable interest coverage.
3. Stock Volatility
Microsoft Corporation
- Beta of 1.084 indicates moderate volatility, roughly in line with the NASDAQ technology sector.
VeriSign, Inc.
- Lower beta of 0.753 suggests less volatility but may reflect market skepticism due to financial distress signals.
4. Regulatory & Legal
Microsoft Corporation
- Subject to scrutiny on antitrust and data privacy fronts given global scale and diversified operations.
VeriSign, Inc.
- Faces regulatory risks tied to internet governance and domain name system policies.
5. Supply Chain & Operations
Microsoft Corporation
- Complex global supply chain for hardware and software services; resilient but exposed to geopolitical and component shortages.
VeriSign, Inc.
- Relies on stable internet infrastructure; limited supply chain complexity but critical operational uptime is mandatory.
6. ESG & Climate Transition
Microsoft Corporation
- Aggressively pursuing carbon neutrality and sustainability goals, improving ESG profile.
VeriSign, Inc.
- ESG risks less pronounced but must address data center energy use and security.
7. Geopolitical Exposure
Microsoft Corporation
- Significant global footprint exposes it to geopolitical tensions, trade restrictions, and localization laws.
VeriSign, Inc.
- Exposure primarily through internet governance policies and U.S. regulatory environment, with less global operational risk.
Which company shows a better risk-adjusted profile?
Microsoft’s most impactful risk is competitive pressure amid a rapidly evolving tech landscape. VeriSign’s greatest concern is its precarious capital structure, highlighted by a debt-to-assets ratio over 128%, signaling distress. Microsoft’s robust balance sheet and safer Altman Z-score (9.7 vs. VeriSign’s -4.7) reflect a far stronger risk-adjusted profile. The stark contrast in financial health underlines VeriSign’s urgent need to address leverage risks to avoid potential bankruptcy.
Final Verdict: Which stock to choose?
Microsoft’s superpower lies in its unmatched scale and consistent value creation, driven by a robust economic moat and diversified revenue streams. Its slight decline in profitability signals a point of vigilance, especially amid market saturation. It suits investors pursuing steady growth with a tolerance for premium valuations.
VeriSign stands out with a highly durable competitive moat, boasting a soaring ROIC far above its cost of capital and a commanding position in domain name services. Though its liquidity metrics raise caution, it offers a safer profile in terms of cash flow stability relative to Microsoft. It fits well with portfolios targeting growth at a reasonable price.
If you prioritize established, diversified tech dominance and can weather elevated multiples, Microsoft is the compelling choice due to its scale and cash generation. However, if you seek a niche leader with a durable moat and better capital efficiency, VeriSign offers superior stability and long-term profitability potential. Each presents a distinct analytical scenario aligned with different investor risk appetites.
Disclaimer: Investment carries a risk of loss of initial capital. The past performance is not a reliable indicator of future results. Be sure to understand risks before making an investment decision.
Go Further
I encourage you to read the complete analyses of Microsoft Corporation and VeriSign, Inc. to enhance your investment decisions: