Home > Comparison > Technology > MSFT vs PATH
The strategic rivalry between Microsoft Corporation and UiPath Inc. shapes the future of the software infrastructure sector. Microsoft, a diversified technology powerhouse, blends cloud, productivity, and consumer software. UiPath, a focused automation innovator, leads robotic process automation with AI integration. This clash represents a contest between scale-driven diversification and niche-driven growth. This analysis will identify which trajectory offers a superior risk-adjusted return for a balanced portfolio in 2026.
Table of contents
Companies Overview
Microsoft Corporation and UiPath Inc. both shape the software infrastructure landscape with distinct scale and focus.
Microsoft Corporation: Software Infrastructure Titan
Microsoft dominates the technology sector with its diverse software and cloud services portfolio. Its revenue streams include Productivity and Business Processes, Intelligent Cloud, and More Personal Computing segments. In 2026, Microsoft sharpens its strategic focus on integrating AI through Azure and expanding enterprise cloud solutions, reinforcing its competitive moat in scalable cloud infrastructure and productivity tools.
UiPath Inc.: Robotic Process Automation Pioneer
UiPath leads in the niche of robotic process automation (RPA), offering a comprehensive platform that combines AI with automation tools. It generates revenue by licensing software that enables enterprises to automate workflows across various industries. UiPath’s 2026 strategy centers on enhancing low-code development environments and expanding automation adoption in banking, healthcare, and government sectors.
Strategic Collision: Similarities & Divergences
Both companies operate within software infrastructure but diverge sharply in approach. Microsoft builds a broad, integrated ecosystem spanning cloud and productivity, while UiPath pursues a focused, AI-driven automation platform. Their primary battleground is enterprise digital transformation, yet Microsoft’s scale contrasts with UiPath’s specialized innovation. Investors see Microsoft as a mature, diversified giant; UiPath presents a higher-growth, niche disruptor profile.
Income Statement Comparison
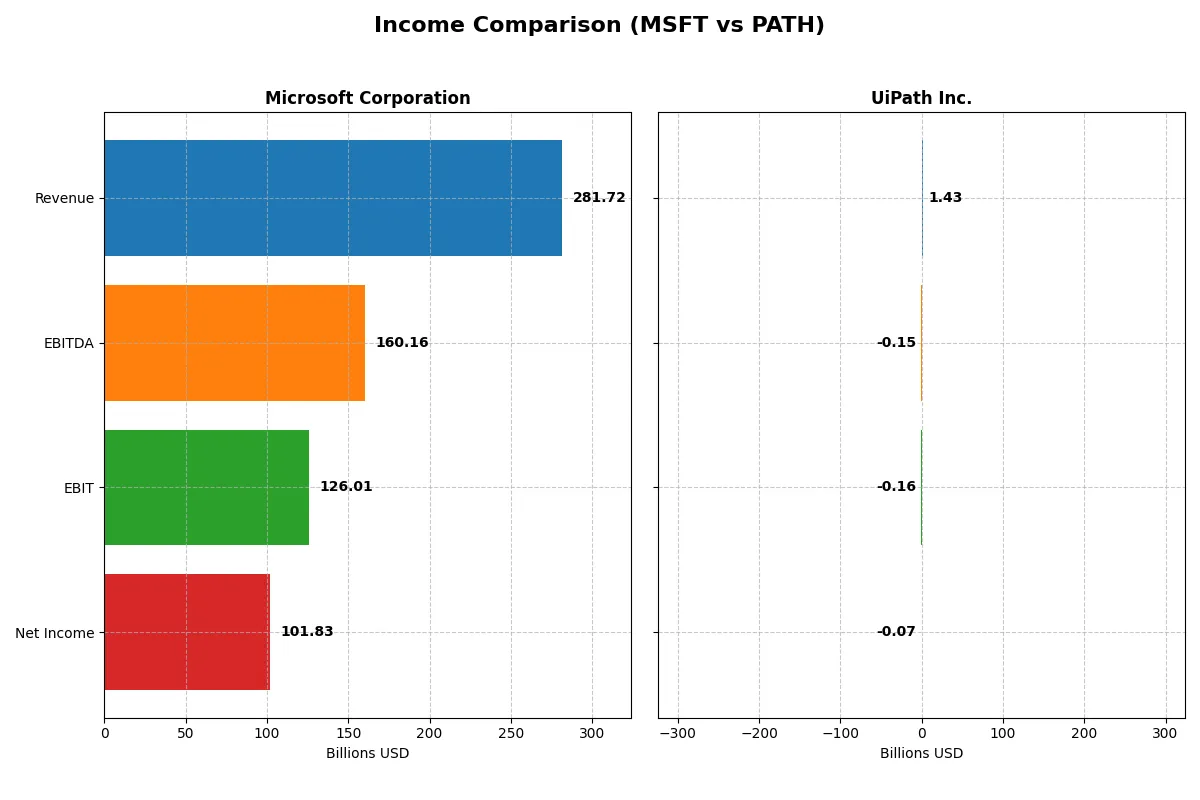
This data dissects the core profitability and scalability of both corporate engines to reveal who dominates the bottom line:
| Metric | Microsoft Corporation (MSFT) | UiPath Inc. (PATH) |
|---|---|---|
| Revenue | 282B | 1.43B |
| Cost of Revenue | 88B | 247M |
| Operating Expenses | 65.4B | 1.35B |
| Gross Profit | 194B | 1.18B |
| EBITDA | 160B | -145M |
| EBIT | 126B | -163M |
| Interest Expense | 2.39B | 0 |
| Net Income | 102B | -74M |
| EPS | 13.7 | -0.13 |
| Fiscal Year | 2025 | 2025 |
Income Statement Analysis: The Bottom-Line Duel
This income statement comparison uncovers the true efficiency and profitability of Microsoft Corporation and UiPath Inc. over recent years.
Microsoft Corporation Analysis
Microsoft’s revenue surged from 168B in 2021 to 282B in 2025, with net income growing from 61B to 102B. Gross margins hold strong near 69%, and net margins remain robust above 36%. The 2025 fiscal year shows excellent operating leverage, with EBIT margin at 44.7%, confirming efficient cost control and sustained momentum in profitability.
UiPath Inc. Analysis
UiPath’s revenue expanded rapidly from 608M in 2021 to 1.43B in 2025, with net losses narrowing from -92M to -74M. The company boasts impressive gross margins above 82%, yet EBIT and net margins remain negative, reflecting ongoing investment and scaling costs. Recent progress in net margin improvement signals a positive trend toward operational efficiency.
Margin Dominance vs. Growth Trajectory
Microsoft delivers superior profitability with consistent positive margins and substantial net income growth. UiPath excels in revenue acceleration and margin improvement but remains unprofitable overall. Investors prioritizing stable cash flow and high returns will find Microsoft’s profile more attractive, while growth-focused investors may watch UiPath’s evolving margin story.
Financial Ratios Comparison
These vital ratios act as a diagnostic tool to expose underlying fiscal health, valuation premiums, and capital efficiency for Microsoft Corporation (MSFT) and UiPath Inc. (PATH):
| Ratios | Microsoft (MSFT) | UiPath (PATH) |
|---|---|---|
| ROE | 29.6% | -4.0% |
| ROIC | 22.0% | -7.4% |
| P/E | 36.3 | -108.0 |
| P/B | 10.8 | 4.3 |
| Current Ratio | 1.35 | 2.93 |
| Quick Ratio | 1.35 | 2.93 |
| D/E | 0.18 | 0.04 |
| Debt-to-Assets | 9.8% | 2.7% |
| Interest Coverage | 53.9 | 0 |
| Asset Turnover | 0.46 | 0.50 |
| Fixed Asset Turnover | 1.23 | 14.41 |
| Payout ratio | 23.6% | 0% |
| Dividend yield | 0.65% | 0% |
| Fiscal Year | 2025 | 2025 |
Efficiency & Valuation Duel: The Vital Signs
Financial ratios serve as a company’s DNA, uncovering hidden risks and operational excellence critical for investment decisions.
Microsoft Corporation
Microsoft delivers strong profitability with a 29.65% ROE and a 36.15% net margin, signaling efficient capital use. However, its valuation appears stretched, with a high P/E of 36.31 and P/B of 10.76. Shareholders receive modest dividends (0.65% yield), while reinvestment focuses heavily on R&D, fueling sustainable growth.
UiPath Inc.
UiPath struggles with negative profitability: ROE at -3.99% and a -5.15% net margin indicate operational challenges. The company trades at a negative P/E but a moderate P/B of 4.31, suggesting undervaluation. It pays no dividends, instead directing cash flow toward heavy R&D and growth initiatives, reflecting a high-risk, high-reward profile.
Premium Profitability vs. Growth Risk
Microsoft offers a superior balance of robust profitability and operational efficiency despite a premium valuation. UiPath’s ratios highlight significant risk with weak returns but potential upside through aggressive reinvestment. Investors seeking stability may favor Microsoft; those with a higher risk tolerance might consider UiPath’s growth story.
Which one offers the Superior Shareholder Reward?
I see Microsoft offers a modest 0.65% dividend yield with a sustainable 24% payout ratio, backed by robust free cash flow of 9.6B. Microsoft complements dividends with aggressive buybacks, enhancing total returns. UiPath pays no dividends but reinvests heavily in growth, reflected in its negative margins and zero payout. Its buyback activity is minimal or absent, limiting immediate shareholder rewards. For 2026, Microsoft’s balanced distribution—dividends plus buybacks—provides a more attractive and reliable shareholder return profile than UiPath’s growth-focused, non-distributive model.
Comparative Score Analysis: The Strategic Profile
The radar chart reveals the fundamental DNA and trade-offs of Microsoft Corporation and UiPath Inc., highlighting their core financial strengths and vulnerabilities:
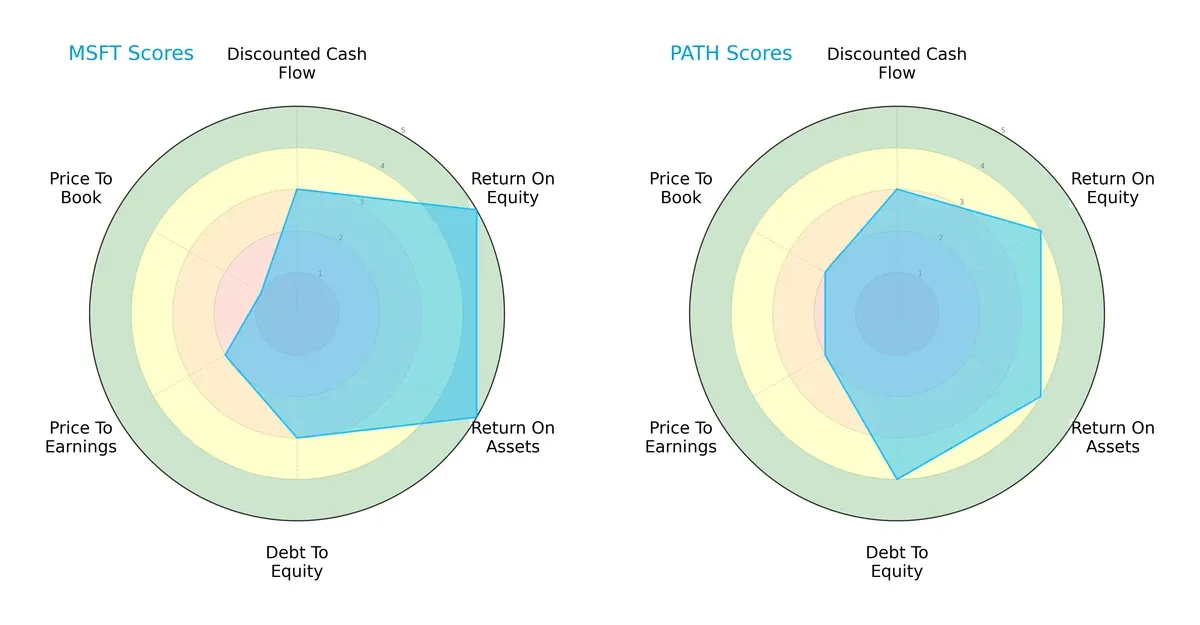
Microsoft dominates in profitability metrics, scoring a perfect 5 in ROE and ROA, showcasing its efficient capital and asset utilization. UiPath posts solid but slightly lower scores (4 each) in these areas, reflecting growth-stage dynamics. On financial risk, UiPath’s stronger debt-to-equity score (4 vs. 3) signals a more conservative leverage stance. Both share similar DCF scores (3), but Microsoft’s valuation ratios are stretched, with a very unfavorable price-to-book score (1) compared to UiPath’s moderate (2). Overall, Microsoft shows a high-profitability edge but with valuation risks, while UiPath offers a more balanced financial risk profile.
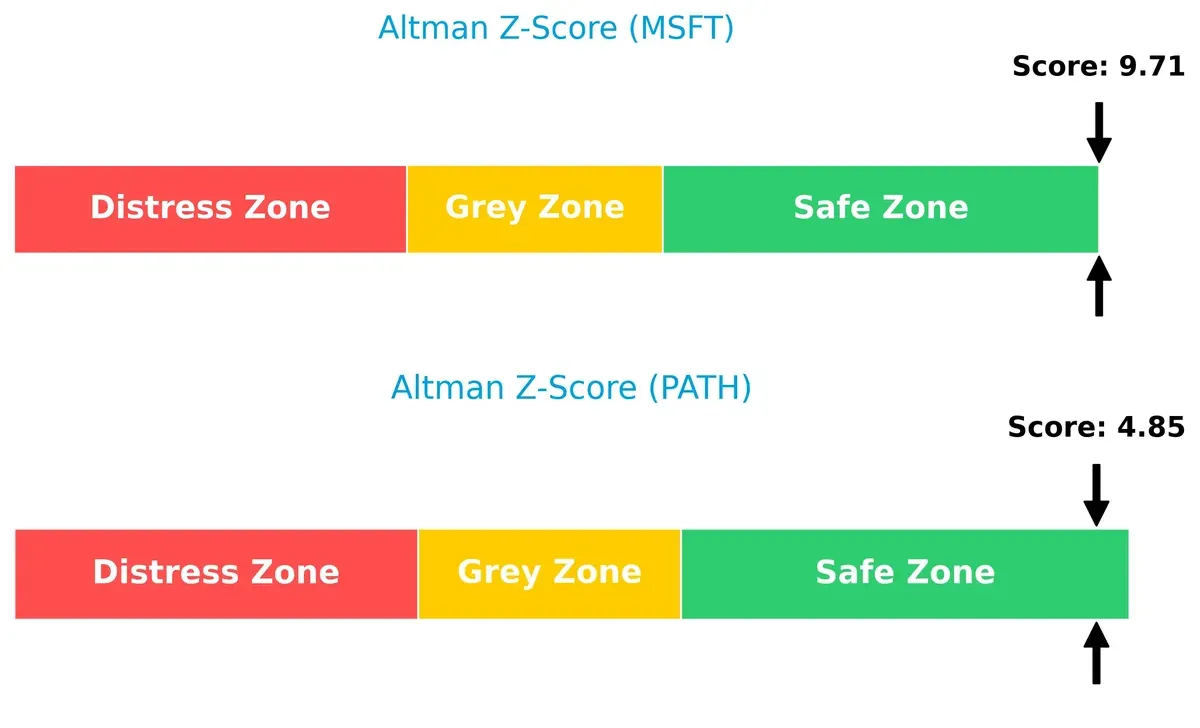
Bankruptcy Risk: Solvency Showdown
Microsoft’s Altman Z-Score of 9.7 vastly outpaces UiPath’s 4.85, both safely above the distress threshold, but this gap emphasizes Microsoft’s superior financial resilience in turbulent cycles:
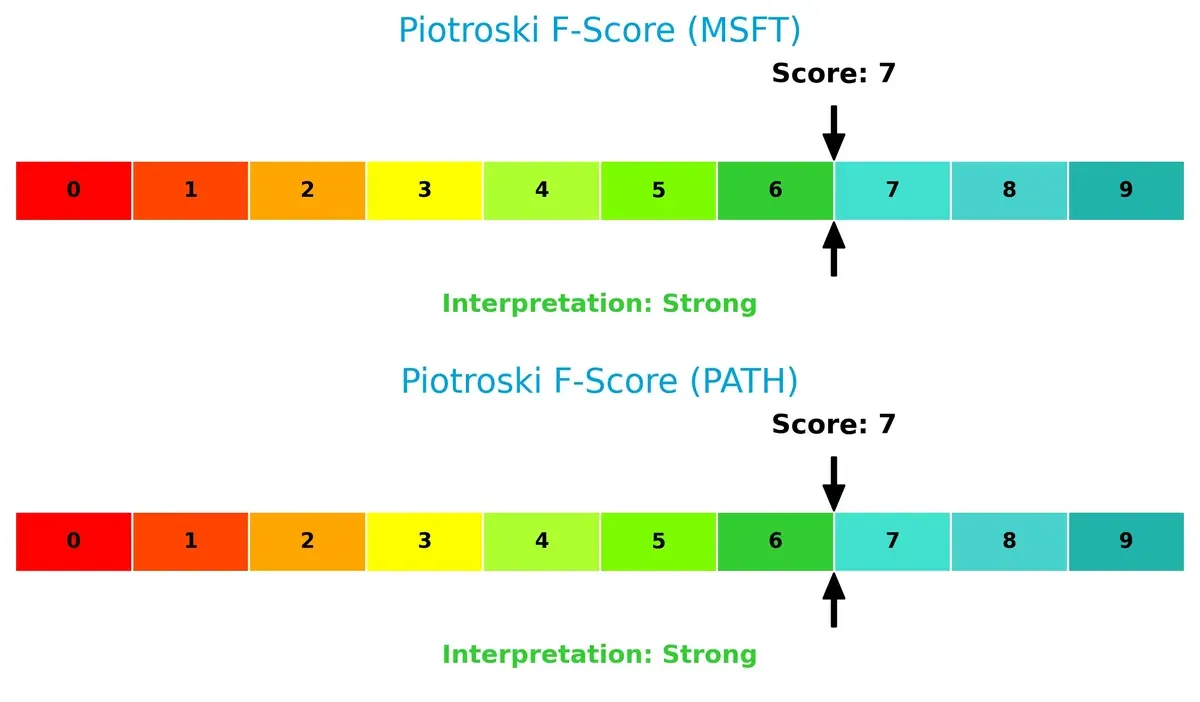
Financial Health: Quality of Operations
Both companies share a Piotroski F-Score of 7, indicating strong internal financial health. Neither shows red flags in profitability, leverage, or liquidity, confirming operational robustness as they navigate competitive markets:
How are the two companies positioned?
This section dissects Microsoft and UiPath’s operational DNA by comparing revenue distribution and internal dynamics. The goal: confront their economic moats to reveal which model offers the most durable competitive edge today.
Revenue Segmentation: The Strategic Mix
The following visual comparison dissects how Microsoft Corporation and UiPath Inc. diversify their income streams and where their primary sector bets lie:
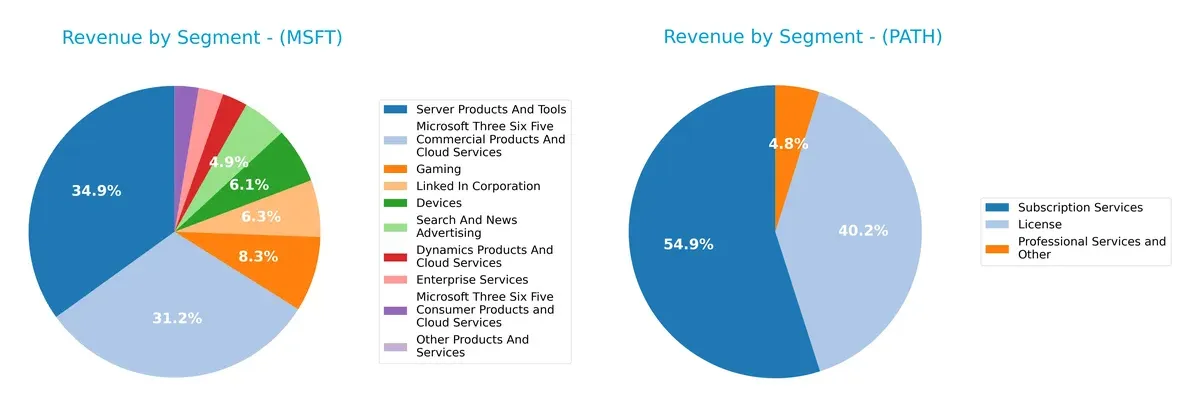
Microsoft’s revenue dwarfs UiPath’s, anchored by vast segments like Server Products and Tools ($98.4B) and Microsoft 365 Commercial ($87.8B). UiPath pivots mainly on Subscription Services ($802M) and License sales ($587M). Microsoft’s diverse portfolio reflects ecosystem lock-in and infrastructure dominance, reducing concentration risk. UiPath’s narrower focus signals higher dependency on automation software, which could heighten vulnerability to market shifts despite potential growth.
Strengths and Weaknesses Comparison
The table below compares the Strengths and Weaknesses of Microsoft and UiPath:
Microsoft Strengths
- Diversified revenue across cloud, gaming, enterprise, and devices
- Strong profitability with 36.15% net margin and 29.65% ROE
- Global presence with $282B revenue split roughly evenly between US and international markets
- Conservative debt levels with 9.79% debt to assets
- Favorable quick ratio of 1.35 supports liquidity
- Innovative cloud and enterprise service segments driving growth
UiPath Strengths
- High current and quick ratios at 2.93 indicate strong liquidity
- Low debt to equity of 0.04 signals conservative leverage
- Favorable fixed asset turnover of 14.41 reflects efficient asset use
- Presence in Americas, EMEA, and Asia Pacific supports geographic diversification
- Favorable P/E ratio despite losses may indicate growth potential
Microsoft Weaknesses
- Unfavorable PE and PB ratios suggest elevated valuation risk
- Asset turnover at 0.46 is lower than peers, indicating less efficient asset use
- Dividend yield low at 0.65% may deter income-focused investors
- Neutral current ratio of 1.35 could limit short-term flexibility
- Relatively high P/B of 10.76 raises valuation concerns
UiPath Weaknesses
- Negative net margin (-5.15%), ROE (-3.99%), and ROIC (-7.41%) reflect unprofitability
- Interest coverage at zero highlights vulnerability to debt costs
- Unfavorable asset turnover of 0.5 points to operational inefficiency
- No dividend yield limits income returns
- Unfavorable PB ratio of 4.31 may reflect overvaluation risk
Microsoft’s strengths lie in diversified revenues, strong profitability, and global scale. Its weaknesses revolve around valuation and asset efficiency. UiPath shows strong liquidity and asset efficiency but struggles with profitability and interest coverage. These contrasts highlight Microsoft’s mature market position versus UiPath’s growth and operational challenges.
The Moat Duel: Analyzing Competitive Defensibility
A structural moat is the only reliable barrier protecting long-term profits from relentless competition erosion. Let’s dissect the competitive fortresses of two software giants:
Microsoft Corporation: Ecosystem Lock-in Driving Consistent Value Creation
Microsoft’s moat centers on a deeply entrenched ecosystem with high switching costs across cloud, productivity, and OS platforms. This manifests in a robust ROIC exceeding WACC by 13%, signaling efficient capital use and margin stability. In 2026, Azure’s cloud growth and AI integration could deepen this moat, though a slight ROIC decline warrants caution.
UiPath Inc.: Innovation-Driven Automation with Emerging Profitability
UiPath’s moat stems from its AI-powered robotic process automation platform, differentiating it with rapid innovation rather than entrenched scale. Unlike Microsoft, UiPath currently sheds value (ROIC below WACC) but shows a compelling upward ROIC trend, reflecting improving operational efficiency. Expansion into new industries in 2026 could transform this growth into durable competitive advantage.
Ecosystem Lock-in vs. Innovation Momentum: Who Holds the Moat Advantage?
Microsoft’s wider and more durable ecosystem moat currently outmatches UiPath’s emerging but unproven innovation moat. While UiPath’s profitability trend is promising, Microsoft remains better equipped to defend and expand its market share in 2026.
Which stock offers better returns?
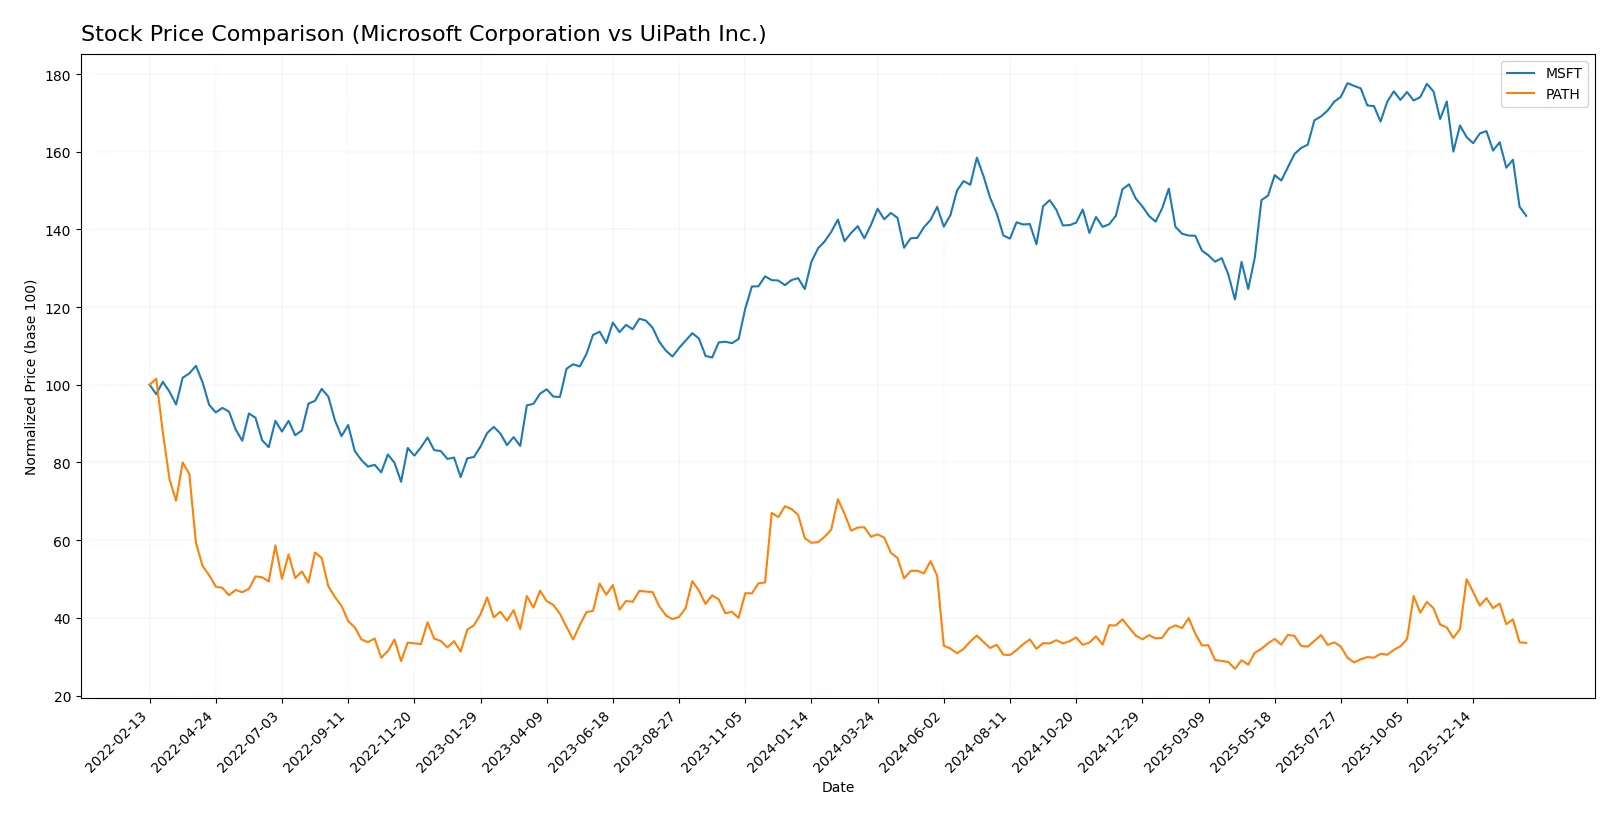
The past year showed Microsoft’s stock gaining modestly before a sharp recent pullback, while UiPath’s shares declined significantly with steady selling pressure.
Trend Comparison
Microsoft’s stock rose 1.67% over the past 12 months, indicating a neutral to slightly bullish trend with decelerating momentum and a high volatility level (std dev 41.8).
UiPath’s stock fell 44.88% over the same period, confirming a bearish trend with deceleration and low volatility (std dev 2.9).
Microsoft outperformed UiPath by a wide margin, delivering far stronger market performance despite a recent short-term decline.
Target Prices
The current analyst consensus shows strong upside potential for both Microsoft Corporation and UiPath Inc.
| Company | Target Low | Target High | Consensus |
|---|---|---|---|
| Microsoft Corporation | 450 | 675 | 600.04 |
| UiPath Inc. | 14 | 19 | 16.6 |
Analysts expect Microsoft’s stock to rise significantly from its current 423.37 price, signaling confidence in its resilient enterprise cloud growth. UiPath’s consensus target also suggests solid appreciation potential from 12.54, reflecting optimism in automation adoption.

Don’t Let Luck Decide Your Entry Point
Optimize your entry points with our advanced ProRealTime indicators. You’ll get efficient buy signals with precise price targets for maximum performance. Start outperforming now!
How do institutions grade them?
Microsoft Corporation Grades
The latest institutional grades for Microsoft Corporation are listed below:
| Grading Company | Action | New Grade | Date |
|---|---|---|---|
| Citigroup | Maintain | Buy | 2026-01-30 |
| Wedbush | Maintain | Outperform | 2026-01-29 |
| Cantor Fitzgerald | Maintain | Overweight | 2026-01-29 |
| RBC Capital | Maintain | Outperform | 2026-01-29 |
| Stifel | Maintain | Buy | 2026-01-29 |
| DA Davidson | Maintain | Buy | 2026-01-29 |
| Keybanc | Maintain | Overweight | 2026-01-29 |
| Piper Sandler | Maintain | Overweight | 2026-01-29 |
| Evercore ISI Group | Maintain | Outperform | 2026-01-29 |
| Wells Fargo | Maintain | Overweight | 2026-01-29 |
UiPath Inc. Grades
Below are the recent institutional grades for UiPath Inc.:
| Grading Company | Action | New Grade | Date |
|---|---|---|---|
| Barclays | Maintain | Equal Weight | 2026-01-12 |
| RBC Capital | Maintain | Sector Perform | 2026-01-05 |
| RBC Capital | Maintain | Sector Perform | 2025-12-10 |
| Morgan Stanley | Maintain | Equal Weight | 2025-12-09 |
| DA Davidson | Maintain | Neutral | 2025-12-05 |
| Mizuho | Maintain | Neutral | 2025-12-04 |
| Evercore ISI Group | Maintain | In Line | 2025-12-04 |
| Needham | Maintain | Hold | 2025-12-04 |
| Wells Fargo | Maintain | Equal Weight | 2025-12-04 |
| Canaccord Genuity | Maintain | Buy | 2025-12-04 |
Which company has the best grades?
Microsoft Corporation consistently receives higher grades such as Buy, Outperform, and Overweight from multiple top-tier institutions. UiPath’s grades cluster around Equal Weight and Neutral, with fewer Buy ratings. This disparity suggests Microsoft is viewed more favorably by analysts, potentially affecting investor confidence and valuation.
Risks specific to each company
The following categories identify critical pressure points and systemic threats facing Microsoft Corporation and UiPath Inc. in the 2026 market environment:
1. Market & Competition
Microsoft Corporation
- Dominates with diversified software and cloud offerings; faces intense competition from tech giants and agile startups.
UiPath Inc.
- Operates in a niche RPA market; faces rapid innovation pressure and competition from larger cloud providers expanding automation.
2. Capital Structure & Debt
Microsoft Corporation
- Maintains a conservative debt-to-equity ratio (0.18) and strong interest coverage (52.8x), indicating low financial risk.
UiPath Inc.
- Exhibits very low debt (0.04 D/E) but zero interest coverage, reflecting limited earnings to service debt and potential liquidity concerns.
3. Stock Volatility
Microsoft Corporation
- Beta at 1.08 suggests moderate volatility aligned with tech sector norms; stable market cap supports resilience.
UiPath Inc.
- Beta close to 1.07 but smaller market cap and higher trading volume imply susceptibility to sharper price swings.
4. Regulatory & Legal
Microsoft Corporation
- Faces global antitrust scrutiny and data privacy regulations, given its size and market reach.
UiPath Inc.
- Subject to compliance risks in multiple jurisdictions with evolving automation and AI regulatory frameworks.
5. Supply Chain & Operations
Microsoft Corporation
- Benefits from robust, integrated supply chains and strong vendor relationships worldwide.
UiPath Inc.
- Relies heavily on software development talent and cloud infrastructure; operational scaling may strain resources.
6. ESG & Climate Transition
Microsoft Corporation
- Invests heavily in sustainability initiatives and carbon neutrality goals, enhancing ESG credentials.
UiPath Inc.
- ESG programs less developed, presenting reputational and compliance risks amid rising stakeholder expectations.
7. Geopolitical Exposure
Microsoft Corporation
- Diversified global footprint exposes it to geopolitical tensions, especially US-China tech conflicts.
UiPath Inc.
- Concentrated business in US, Romania, Japan; regional instability could disproportionately impact operations.
Which company shows a better risk-adjusted profile?
Microsoft’s dominant market position, strong capital structure, and diversified operations underpin a superior risk-adjusted profile. UiPath’s operational scale and liquidity constraints elevate its risk, despite growth potential in automation. Microsoft’s Altman Z-Score (9.7) versus UiPath’s (4.9) confirms stronger financial stability for Microsoft. Meanwhile, UiPath’s zero interest coverage signals fragility in earnings to cover expenses, highlighting risk.
Final Verdict: Which stock to choose?
Microsoft’s superpower lies in its unmatched ability to generate consistent value through a wide economic moat and solid capital efficiency. Its main point of vigilance is a slightly declining ROIC trend, signaling the need to monitor profitability sustainability. It suits portfolios focused on steady, long-term, large-cap growth.
UiPath’s strategic moat is its promising growth trajectory fueled by innovation in automation software. While it currently shows value destruction, its improving profitability and strong liquidity profile offer a compelling turnaround story. It fits well in a higher-risk, growth-oriented portfolio willing to embrace recovery potential.
If you prioritize durable value creation and stable cash generation, Microsoft outshines due to its strong moat and consistent returns. However, if you seek aggressive growth with a tolerance for volatility, UiPath offers better upside potential amid its improving fundamentals. Each presents distinct analytical scenarios for different investor profiles.
Disclaimer: Investment carries a risk of loss of initial capital. The past performance is not a reliable indicator of future results. Be sure to understand risks before making an investment decision.
Go Further
I encourage you to read the complete analyses of Microsoft Corporation and UiPath Inc. to enhance your investment decisions: