Home > Comparison > Technology > MSFT vs TDC
The strategic rivalry between Microsoft Corporation and Teradata Corporation shapes the technology sector’s software infrastructure landscape. Microsoft dominates with a diversified, high-margin business spanning cloud, productivity, and personal computing. Teradata operates a focused, capital-efficient multi-cloud data platform targeting enterprise analytics. This analysis pits Microsoft’s scale and ecosystem breadth against Teradata’s specialized agility, aiming to identify which trajectory offers superior risk-adjusted returns for diversified portfolios.
Table of contents
Companies Overview
Microsoft Corporation and Teradata Corporation shape the competitive landscape in software infrastructure with distinct market roles.
Microsoft Corporation: Global Software Giant
Microsoft dominates the software infrastructure sector through diversified revenue streams. Its core engine includes cloud platform Azure, productivity suites like Office 365, and enterprise solutions such as Dynamics 365. In 2026, Microsoft sharpens focus on intelligent cloud and AI integration, reinforcing its leadership in a broad technology ecosystem.
Teradata Corporation: Multi-Cloud Data Analytics Specialist
Teradata leads in connected multi-cloud data platforms for enterprise analytics. It generates revenue by delivering Teradata Vantage for data integration and migration, supported by business consulting and maintenance services. The 2026 strategy prioritizes simplifying data ecosystems and accelerating cloud adoption across industries like healthcare and finance.
Strategic Collision: Similarities & Divergences
Both firms operate in software infrastructure but differ sharply in scope and scale. Microsoft offers a broad technology portfolio with a closed ecosystem, while Teradata focuses narrowly on multi-cloud analytics with open architecture. Their primary battleground is cloud data services, where Microsoft’s scale contrasts with Teradata’s specialized agility. Investment profiles diverge accordingly—Microsoft’s vast market presence versus Teradata’s niche expertise.
Income Statement Comparison
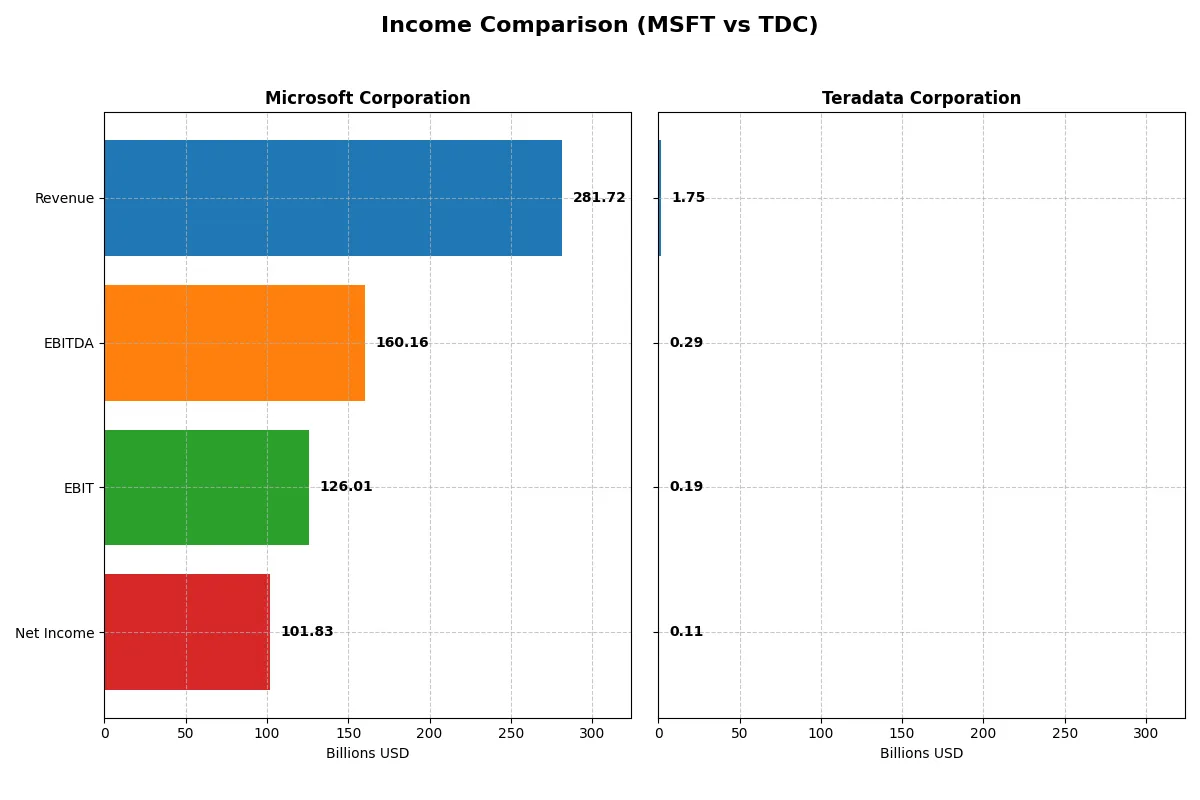
This data dissects the core profitability and scalability of both corporate engines to reveal who dominates the bottom line:
| Metric | Microsoft Corporation (MSFT) | Teradata Corporation (TDC) |
|---|---|---|
| Revenue | 282B | 1.75B |
| Cost of Revenue | 87.8B | 692M |
| Operating Expenses | 65.4B | 849M |
| Gross Profit | 194B | 1.06B |
| EBITDA | 160B | 293M |
| EBIT | 126B | 193M |
| Interest Expense | 2.39B | 29M |
| Net Income | 102B | 114M |
| EPS | 13.7 | 1.18 |
| Fiscal Year | 2025 | 2024 |
Income Statement Analysis: The Bottom-Line Duel
The income statement comparison reveals how efficiently each company converts revenue into profit over recent years.
Microsoft Corporation Analysis
Microsoft’s revenue surged from 168B in 2021 to 282B in 2025, reflecting robust growth. Net income climbed from 61B to 102B, maintaining a strong net margin near 36%. The 2025 results show high operational efficiency with a gross margin of 68.8% and EBIT margin of 44.7%, underscoring sustained profitability momentum.
Teradata Corporation Analysis
Teradata’s revenue declined slightly from 1.9B in 2021 to 1.75B in 2024, with net income halving from 147M to 114M. Despite a lower scale, Teradata improved EBIT margin to 11% and net margin to 6.5% in 2024. The company’s 2024 net income growth of 93% year-over-year signals a recent rebound in operational efficiency amid top-line pressures.
Verdict: Scale and Margin Dominance vs. Recovery and Efficiency
Microsoft dominates with strong double-digit revenue growth and superior margins, delivering consistent profitability expansion. Teradata faces top-line contraction but shows improved margins and earnings momentum in 2024. For investors, Microsoft’s profile offers reliable scale and margin power, while Teradata presents a higher-risk turnaround story with efficiency gains.
Financial Ratios Comparison
These vital ratios act as a diagnostic tool to expose the underlying fiscal health, valuation premiums, and capital efficiency of the companies compared below:
| Ratios | Microsoft Corporation (MSFT) | Teradata Corporation (TDC) |
|---|---|---|
| ROE | 29.6% | 85.7% |
| ROIC | 22.0% | 16.9% |
| P/E | 36.3 | 26.3 |
| P/B | 10.8 | 22.6 |
| Current Ratio | 1.35 | 0.81 |
| Quick Ratio | 1.35 | 0.79 |
| D/E | 0.18 | 4.33 |
| Debt-to-Assets | 9.8% | 33.8% |
| Interest Coverage | 53.9 | 7.2 |
| Asset Turnover | 0.46 | 1.03 |
| Fixed Asset Turnover | 1.23 | 9.07 |
| Payout Ratio | 23.6% | 0% |
| Dividend Yield | 0.65% | 0% |
| Fiscal Year | 2025 | 2024 |
Efficiency & Valuation Duel: The Vital Signs
Financial ratios act as a company’s DNA, exposing hidden risks and revealing operational excellence crucial for informed investment decisions.
Microsoft Corporation
Microsoft demonstrates strong profitability with a 29.65% ROE and a robust 36.15% net margin, highlighting efficient operations. Its valuation appears stretched, with a P/E ratio of 36.31 and P/B of 10.76, above typical benchmarks. Shareholders receive modest dividends (0.65% yield), while the company reinvests heavily in R&D (11.5% of revenue) to fuel growth.
Teradata Corporation
Teradata posts an impressive 85.7% ROE but a modest net margin of 6.51%, suggesting leverage-driven returns. The P/E of 26.34 and P/B of 22.58 indicate a relatively expensive valuation given its operational scale. It pays no dividends, instead directing resources to R&D (16.2% of revenue), signaling a focus on innovation and expansion amid financial constraints like a weak current ratio (0.81).
Operational Efficiency vs. Valuation Discipline
Microsoft offers balanced profitability and growth reinvestment despite a high valuation, backed by solid capital structure and shareholder returns. Teradata’s high ROE contrasts with weaker margins and liquidity, reflecting riskier financial health. Investors favoring stability and consistent returns may lean toward Microsoft, while those seeking aggressive growth might consider Teradata’s profile.
Which one offers the Superior Shareholder Reward?
I compare Microsoft Corporation (MSFT) and Teradata Corporation (TDC) on shareholder reward through dividends and buybacks. MSFT pays a modest dividend yield near 0.65% with a sustainable payout ratio around 24%, supported by solid free cash flow coverage above 50%. Its active buyback program further boosts returns, reflecting strong capital allocation discipline. TDC pays no dividends but reinvests free cash flow mainly in operations and debt reduction, with a high debt load and weaker operating margins signaling riskier sustainability. Buybacks are minimal or nonexistent at TDC, limiting total shareholder return. I conclude MSFT offers a superior total return profile in 2026, balancing reliable income and growth with prudent buybacks.
Comparative Score Analysis: The Strategic Profile
The radar chart reveals the fundamental DNA and trade-offs of Microsoft Corporation and Teradata Corporation, highlighting their financial strengths and valuation nuances:
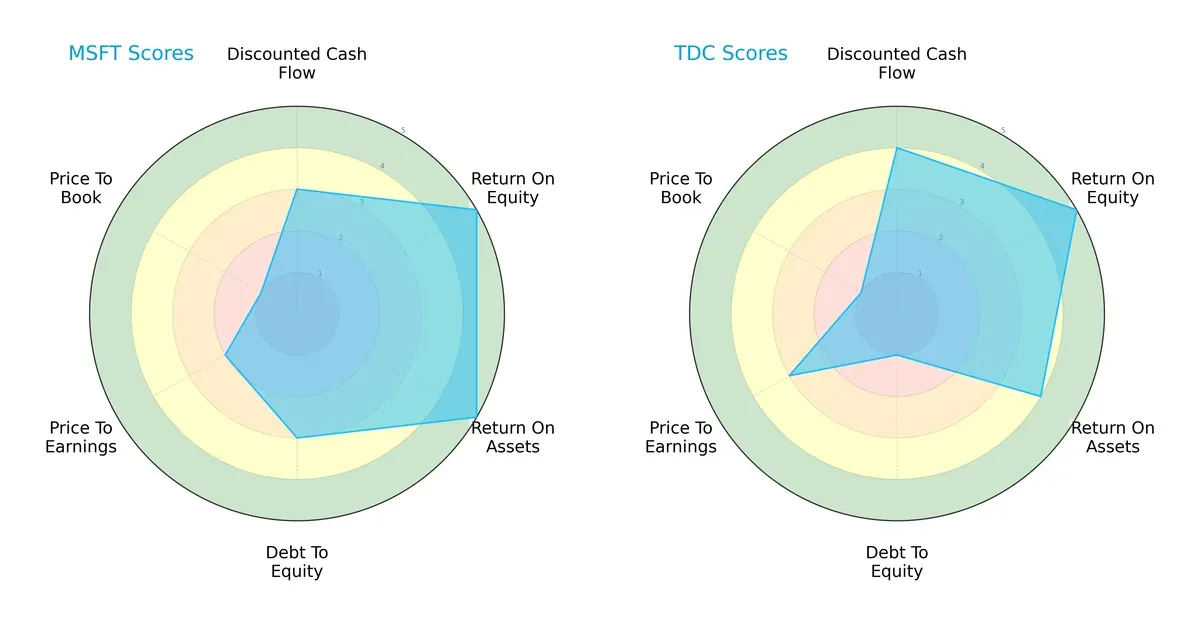
Microsoft shows a more balanced profile with very favorable returns on equity (5) and assets (5), and moderate debt management (3). Teradata leans on a stronger discounted cash flow score (4) but is challenged by a weak debt-to-equity score (1). Both struggle with price-to-book valuations (1), but Microsoft’s valuation scores are slightly less unfavorable. Overall, Microsoft’s diversified edge contrasts with Teradata’s reliance on specific financial strengths.
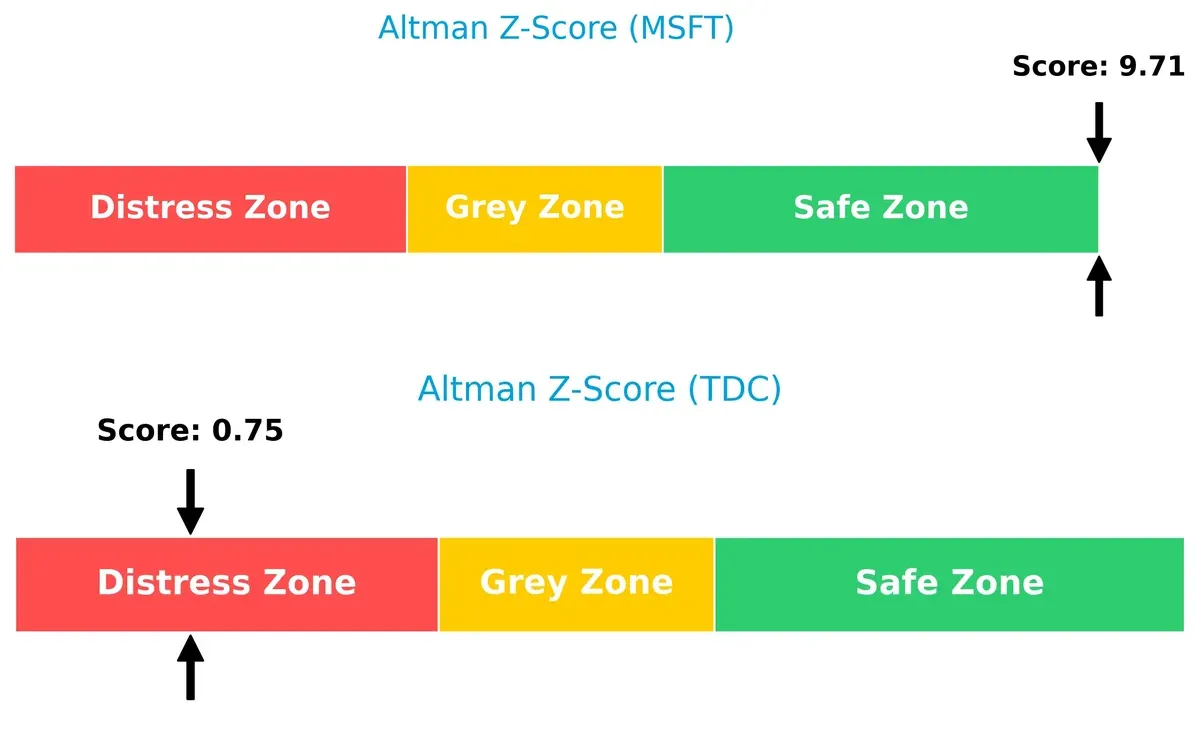
Bankruptcy Risk: Solvency Showdown
Microsoft’s Altman Z-Score of 9.7 places it safely above distress thresholds, signaling robust long-term survival potential. Teradata’s 0.75 score signals high bankruptcy risk in this cycle:
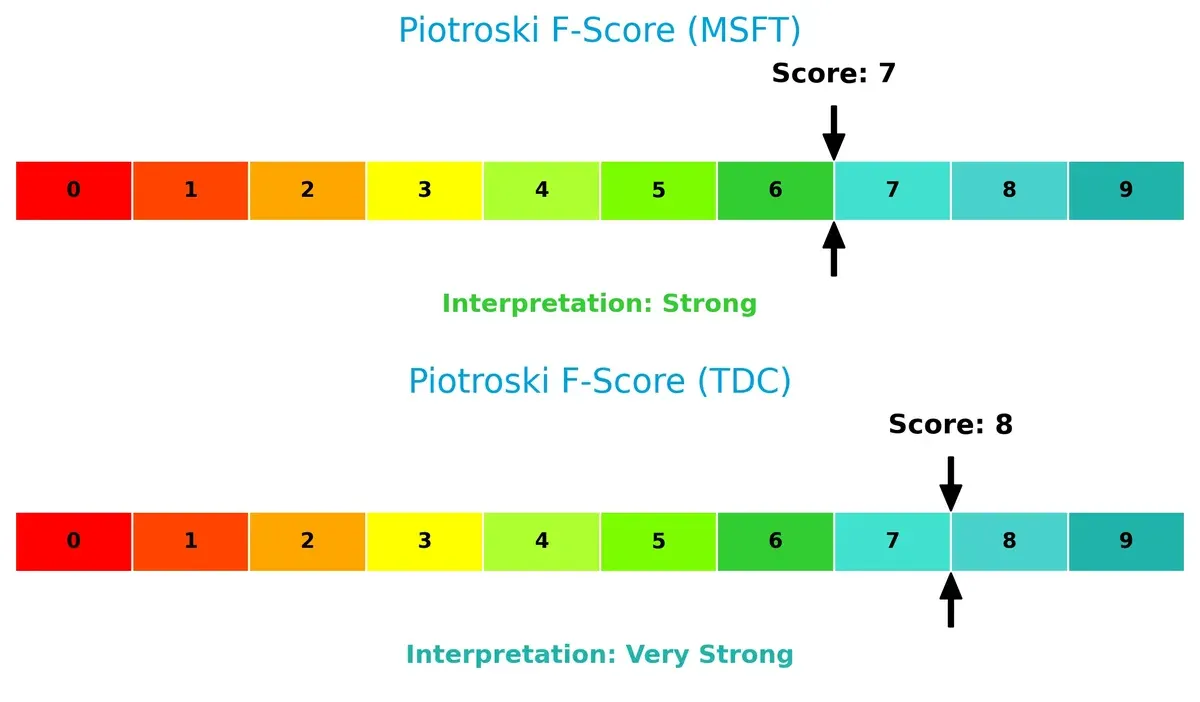
Financial Health: Quality of Operations
Teradata’s Piotroski F-Score of 8 surpasses Microsoft’s 7, indicating slightly stronger internal financial health. However, both firms demonstrate solid operational quality without glaring red flags:
How are the two companies positioned?
This section dissects the operational DNA of Microsoft and Teradata by comparing their revenue distribution and internal dynamics. The goal is to confront their economic moats and identify which business model offers the most resilient, sustainable competitive advantage today.
Revenue Segmentation: The Strategic Mix
This visual comparison dissects how Microsoft Corporation and Teradata Corporation diversify their income streams and where their primary sector bets lie:
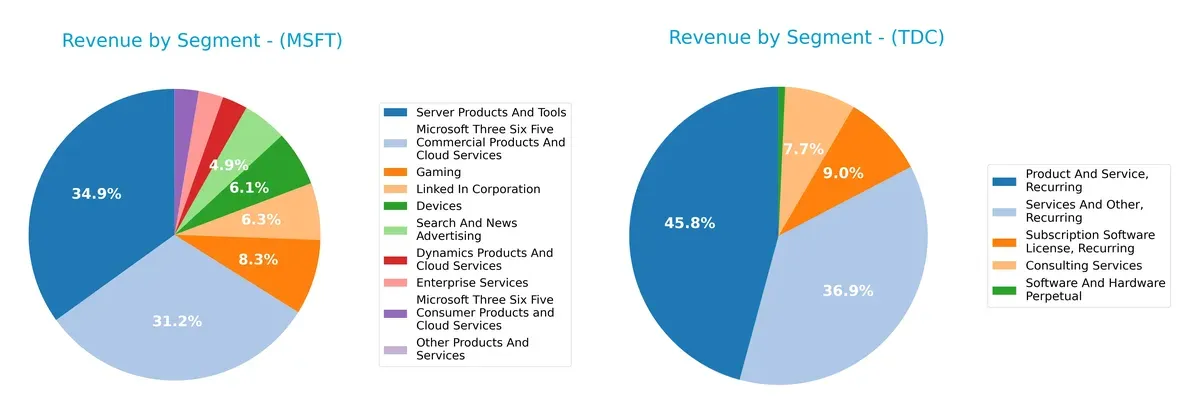
Microsoft dwarfs Teradata in scale and variety, with key segments like Server Products and Tools ($98B) and Microsoft 365 Commercial ($87.7B) anchoring its revenue. Teradata relies heavily on recurring Product and Service revenue ($1.48B) with smaller contributions from consulting and subscription licenses. Microsoft’s broad ecosystem reduces concentration risk and supports infrastructure dominance. Teradata’s focused model risks dependence on a few segments, limiting diversification benefits.
Strengths and Weaknesses Comparison
This table compares the Strengths and Weaknesses of Microsoft Corporation and Teradata Corporation:
Microsoft Strengths
- Highly diversified revenue streams across multiple products and services
- Strong global presence with significant US and Non-US revenues
- Favorable profitability metrics with 36% net margin and 22% ROIC
- Low financial leverage and strong interest coverage
Teradata Strengths
- Favorable ROE and ROIC indicating efficient capital use
- Strong asset turnover showing operational efficiency
- Favorable interest coverage despite higher leverage
- Recurring revenue streams provide stability
Microsoft Weaknesses
- High valuation multiples (PE 36.31, PB 10.76) may limit upside
- Asset turnover is relatively low, suggesting less efficient asset use
- Dividend yield is low at 0.65%, may deter income investors
- Neutral current ratio poses some liquidity caution
Teradata Weaknesses
- Weak liquidity ratios (current and quick ratios below 1) indicate potential short-term risk
- High debt-to-equity ratio (4.33) signals financial leverage concerns
- Unfavorable valuation multiples (PE 26.34, PB 22.58) may imply overvaluation
- No dividend yield reduces income appeal
Microsoft’s strengths lie in its broad diversification, profitable operations, and solid balance sheet. Teradata shows strong capital efficiency and recurring revenue but faces liquidity and leverage challenges. These factors shape each company’s strategic focus on growth versus risk management.
The Moat Duel: Analyzing Competitive Defensibility
A structural moat is the only reliable shield protecting long-term profits from relentless competitive pressure and market disruption:
Microsoft Corporation: Ecosystem Lock-in through Intangible Assets
Microsoft’s moat stems from its vast ecosystem and strong intangible assets like Office 365 and Azure. This generates stable high ROIC near 44.7% EBIT margin, despite a slight ROIC decline in 2025. New AI-driven cloud services could deepen this moat but require careful execution.
Teradata Corporation: Cost Advantage in Multi-Cloud Analytics
Teradata relies on a cost advantage in connected multi-cloud data platforms. Its ROIC rose sharply, signaling efficient capital use and growing profitability. Despite recent revenue declines, strong margin recovery and expanding cloud integration offer growth levers distinct from Microsoft’s broader ecosystem.
Ecosystem Lock-in vs. Cost Advantage: The Moat Face-Off
Microsoft’s wider moat benefits from entrenched network effects and global scale, creating higher absolute profitability and margin resilience. Teradata’s moat is narrower but gaining durability through cost efficiency and cloud specialization. Microsoft remains better equipped to defend market share long term.
Which stock offers better returns?
The past year shows Microsoft’s price edging up 1.67%, with slowing momentum and a peak near 524. In contrast, Teradata’s shares fell sharply by 26.15%, despite recent slight recovery signs.
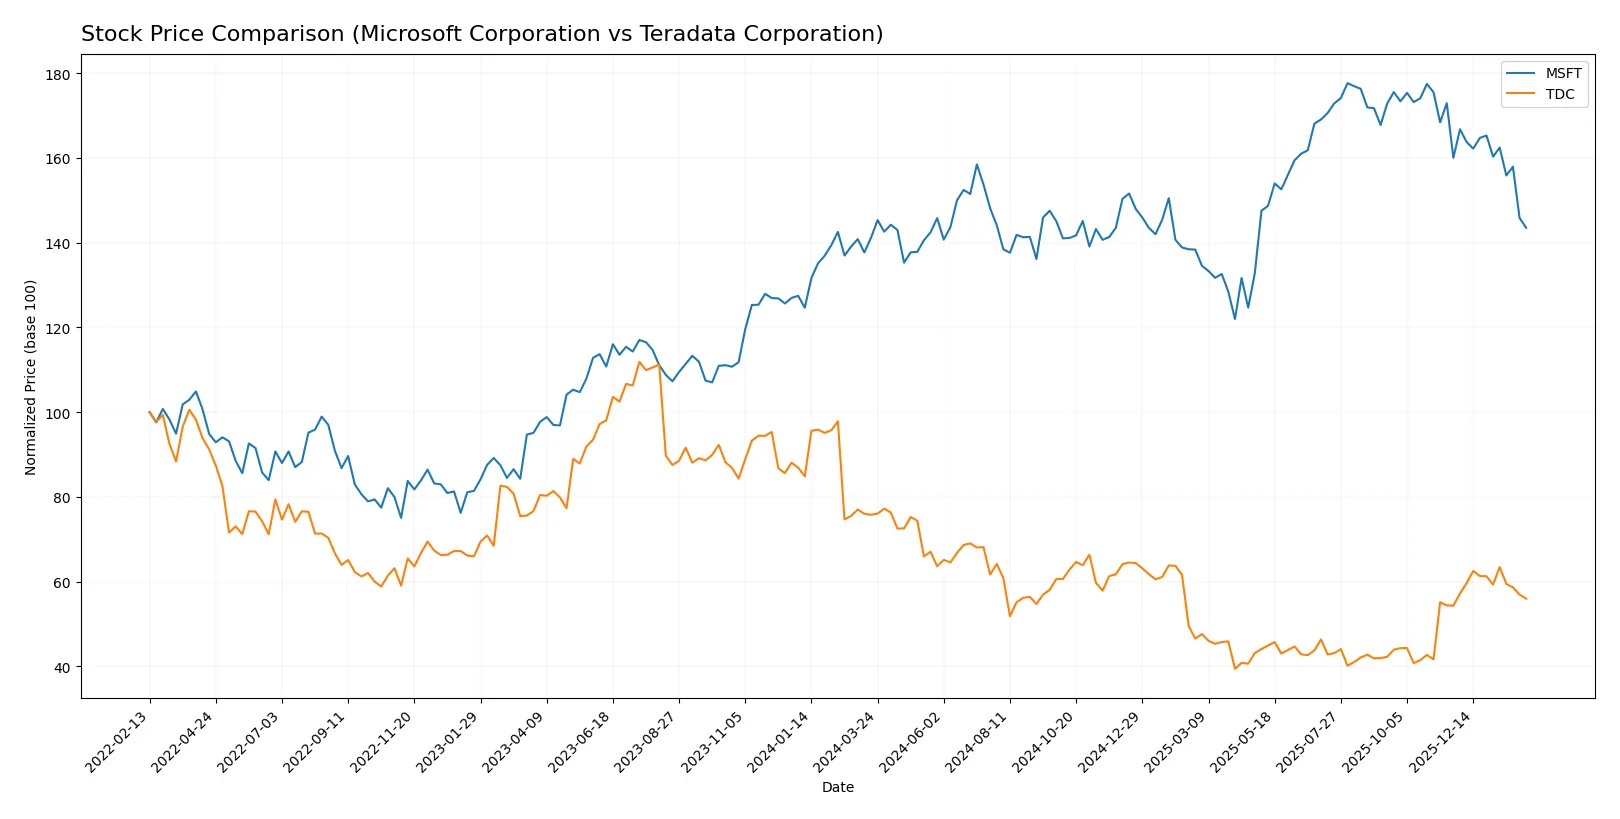
Trend Comparison
Microsoft’s stock rose 1.67% over the past 12 months, indicating a neutral trend with decelerating momentum and large price swings between 359.84 and 524.11.
Teradata’s stock dropped 26.15% over the same period, marking a clear bearish trend but accelerating downward movement and a tighter price range from 19.73 to 38.67.
Microsoft’s stock delivered the highest market performance, showing relative stability versus Teradata’s pronounced decline and recent minor rebound.
Target Prices
Analysts present a bullish consensus on Microsoft Corporation and Teradata Corporation with clear upside potential.
| Company | Target Low | Target High | Consensus |
|---|---|---|---|
| Microsoft Corporation | 450 | 675 | 600.04 |
| Teradata Corporation | 27 | 35 | 31 |
Microsoft’s consensus target of 600.04 exceeds its current price of 423.37, indicating substantial growth expectations. Teradata’s target consensus of 31 also suggests modest upside from its 28.02 price.

Don’t Let Luck Decide Your Entry Point
Optimize your entry points with our advanced ProRealTime indicators. You’ll get efficient buy signals with precise price targets for maximum performance. Start outperforming now!
How do institutions grade them?
Microsoft Corporation Grades
The following table summarizes recent institutional grades for Microsoft Corporation:
| Grading Company | Action | New Grade | Date |
|---|---|---|---|
| Citigroup | Maintain | Buy | 2026-01-30 |
| Wedbush | Maintain | Outperform | 2026-01-29 |
| Cantor Fitzgerald | Maintain | Overweight | 2026-01-29 |
| RBC Capital | Maintain | Outperform | 2026-01-29 |
| Stifel | Maintain | Buy | 2026-01-29 |
| DA Davidson | Maintain | Buy | 2026-01-29 |
| Keybanc | Maintain | Overweight | 2026-01-29 |
| Piper Sandler | Maintain | Overweight | 2026-01-29 |
| Evercore ISI Group | Maintain | Outperform | 2026-01-29 |
| Wells Fargo | Maintain | Overweight | 2026-01-29 |
Teradata Corporation Grades
The following table summarizes recent institutional grades for Teradata Corporation:
| Grading Company | Action | New Grade | Date |
|---|---|---|---|
| Barclays | Maintain | Underweight | 2026-01-12 |
| RBC Capital | Maintain | Sector Perform | 2026-01-05 |
| Morgan Stanley | Maintain | Overweight | 2025-12-17 |
| Citizens | Upgrade | Market Outperform | 2025-11-10 |
| Barclays | Maintain | Underweight | 2025-11-05 |
| Evercore ISI Group | Maintain | Outperform | 2025-11-05 |
| TD Cowen | Maintain | Hold | 2025-11-05 |
| UBS | Maintain | Neutral | 2025-08-06 |
| Guggenheim | Maintain | Buy | 2025-05-07 |
| Barclays | Maintain | Underweight | 2025-04-21 |
Which company has the best grades?
Microsoft consistently receives strong buy, outperform, and overweight ratings from major firms, reflecting broad institutional confidence. Teradata exhibits more mixed grades, ranging from underweight to outperform. Microsoft’s superior consensus may influence investor sentiment positively, while Teradata’s varied outlook suggests higher uncertainty.
Risks specific to each company
The following categories identify the critical pressure points and systemic threats facing both firms in the 2026 market environment:
1. Market & Competition
Microsoft Corporation
- Dominates cloud and software infrastructure with a diversified global footprint. Faces intense competition from AWS and Google Cloud.
Teradata Corporation
- Focuses on multi-cloud data platforms, competing in a niche market with limited scale versus giants like Microsoft.
2. Capital Structure & Debt
Microsoft Corporation
- Maintains a strong balance sheet with low debt-to-equity (0.18) and high interest coverage (52.84x).
Teradata Corporation
- Carries high leverage (D/E 4.33) and weaker liquidity ratios, signaling elevated financial risk.
3. Stock Volatility
Microsoft Corporation
- Exhibits moderate beta (1.08), reflecting slightly above-market volatility.
Teradata Corporation
- Shows low beta (0.54), indicating less market sensitivity but possibly lower liquidity.
4. Regulatory & Legal
Microsoft Corporation
- Faces ongoing antitrust scrutiny due to market dominance and acquisitions.
Teradata Corporation
- Subject to standard industry regulations with lower regulatory spotlight.
5. Supply Chain & Operations
Microsoft Corporation
- Benefits from diversified global supply chains but exposed to semiconductor shortages.
Teradata Corporation
- Relies on fewer suppliers, increasing vulnerability to operational disruptions.
6. ESG & Climate Transition
Microsoft Corporation
- Leads in ESG initiatives with aggressive carbon neutrality goals.
Teradata Corporation
- ESG efforts are improving but lag behind industry leaders.
7. Geopolitical Exposure
Microsoft Corporation
- Global operations expose it to US-China tensions and data privacy issues.
Teradata Corporation
- Smaller international footprint reduces geopolitical risk but limits growth opportunities.
Which company shows a better risk-adjusted profile?
Microsoft’s dominant market position, strong balance sheet, and robust ESG initiatives create a more resilient risk-adjusted profile. Teradata’s high leverage and weak liquidity ratios raise red flags, despite its niche market focus. The biggest risk for Microsoft is regulatory pressure, while Teradata’s financial leverage and distress zone Altman Z-Score signal significant solvency concerns. Recent data confirms Teradata’s Altman Z-Score at 0.75, indicating a high bankruptcy risk, unlike Microsoft’s safe zone score above 9. I conclude Microsoft offers a safer investment with manageable risks in 2026.
Final Verdict: Which stock to choose?
Microsoft’s superpower lies in its unmatched scale and robust cash generation, enabling relentless innovation and strategic acquisitions. Its main point of vigilance is a declining ROIC trend, signaling potential margin pressures ahead. This stock suits portfolios aiming for long-term, aggressive growth in technology leadership.
Teradata commands a strategic moat through its specialized data analytics niche and improving profitability, showing a rare durable competitive advantage with rising ROIC. While it lacks Microsoft’s safety cushion and has balance sheet leverage risks, its appeal grows for investors seeking GARP—growth at a reasonable price—with a focus on niche market strength.
If you prioritize resilient, large-cap tech dominance and consistent cash flow, Microsoft is the compelling choice due to its scale and stable profitability. However, if you seek asymmetric upside in a focused, improving data analytics player with a favorable moat trend, Teradata offers better growth potential but with higher risk. Each fits distinct investor profiles balancing growth ambitions and risk tolerance.
Disclaimer: Investment carries a risk of loss of initial capital. The past performance is not a reliable indicator of future results. Be sure to understand risks before making an investment decision.
Go Further
I encourage you to read the complete analyses of Microsoft Corporation and Teradata Corporation to enhance your investment decisions: