Home > Comparison > Technology > MSFT vs SNPS
The strategic rivalry between Microsoft Corporation and Synopsys, Inc. shapes the future of the software infrastructure sector. Microsoft operates as a diversified technology giant with broad cloud, productivity, and consumer software offerings. Synopsys, a specialized electronic design automation leader, focuses on chip design and verification solutions. This analysis will assess which company’s operational model aligns better with superior risk-adjusted returns for a balanced portfolio in 2026.
Table of contents
Companies Overview
Microsoft and Synopsys both anchor critical niches in the software infrastructure market, shaping digital innovation and technology.
Microsoft Corporation: Global Software Infrastructure Giant
Microsoft dominates with a diversified software ecosystem, generating revenue across Productivity and Business Processes, Intelligent Cloud, and More Personal Computing segments. Its 2026 strategy centers on expanding Azure cloud services while integrating AI through Nuance and GitHub, reinforcing its leadership in enterprise solutions and cloud computing. This multi-segment approach drives resilience and growth.
Synopsys, Inc.: Specialized Electronic Design Automation Leader
Synopsys excels in EDA software for integrated circuit design and verification, crucial for semiconductor innovation. Its core revenue comes from platforms like Fusion Design and Verification Continuum, complemented by IP solutions and security testing. In 2026, the firm focuses on enhancing virtual prototyping and FPGA-based products to meet complex chip design needs, targeting electronics and industrial sectors.
Strategic Collision: Similarities & Divergences
Both companies operate in software infrastructure but diverge sharply in scope and approach. Microsoft pursues a broad, cloud-centric ecosystem, while Synopsys focuses on niche, high-tech semiconductor tools. Their primary battleground lies in digital innovation enabling hardware and software synergy. Microsoft offers a robust, scalable investment profile; Synopsys presents specialized, high-growth potential with concentrated industry exposure.
Income Statement Comparison
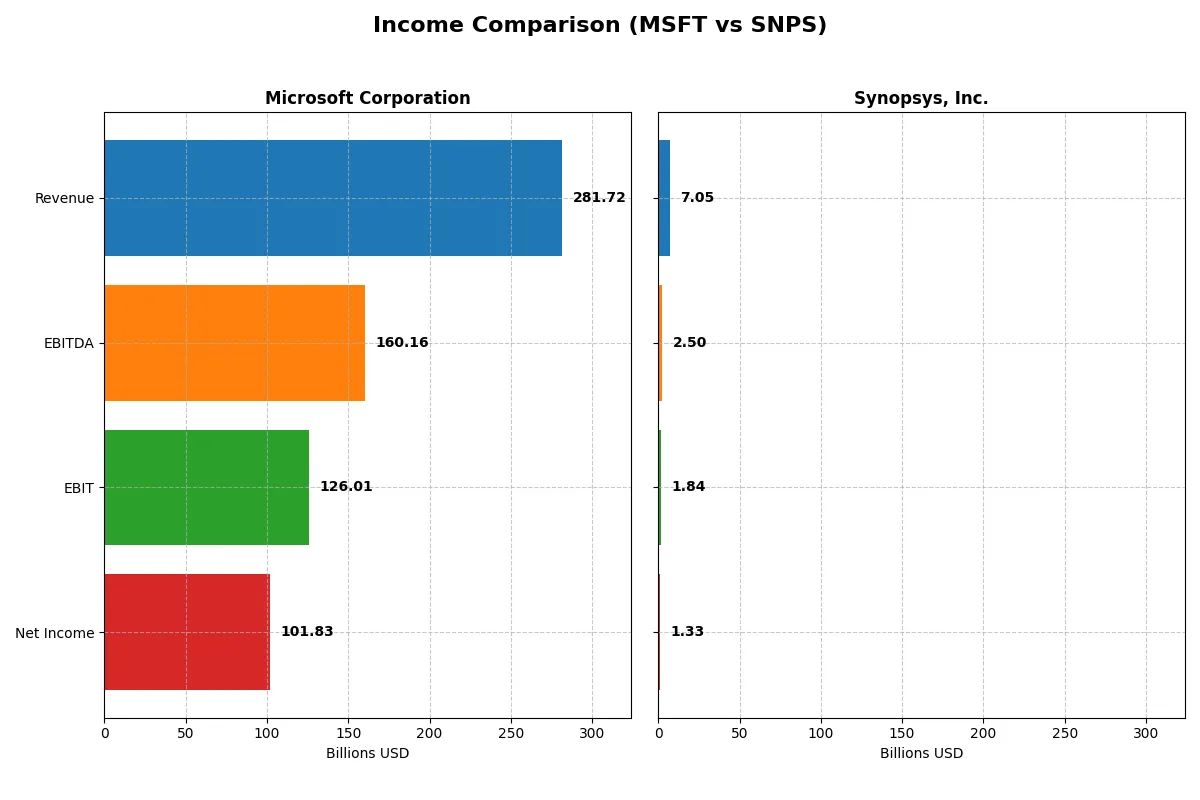
The following data dissects the core profitability and scalability of both corporate engines to reveal who dominates the bottom line:
| Metric | Microsoft Corporation (MSFT) | Synopsys, Inc. (SNPS) |
|---|---|---|
| Revenue | 282B | 7.1B |
| Cost of Revenue | 87.8B | 1.6B |
| Operating Expenses | 65.4B | 4.5B |
| Gross Profit | 194B | 5.4B |
| EBITDA | 160B | 2.5B |
| EBIT | 126B | 1.8B |
| Interest Expense | 2.4B | 447M |
| Net Income | 102B | 1.3B |
| EPS | 13.7 | 8.13 |
| Fiscal Year | 2025 | 2025 |
Income Statement Analysis: The Bottom-Line Duel
This income statement comparison reveals the true efficiency and profitability of Microsoft Corporation and Synopsys, Inc. in their latest fiscal years.
Microsoft Corporation Analysis
Microsoft’s revenue surged from $245B in 2024 to $282B in 2025, a 15% increase, fueling net income growth from $88B to $102B. The company sustains robust margins with a gross margin near 69% and a net margin above 36%, reflecting efficient cost control despite rising expenses. Operating income expanded by nearly 17%, showing strong momentum and disciplined capital allocation.
Synopsys, Inc. Analysis
Synopsys posted revenue growth from $6.13B in 2024 to $7.05B in 2025, up 15%, with net income declining from $2.26B to $1.33B. Its gross margin impresses at almost 77%, but net margin compressed to 18.9%, signaling margin pressure. Operating expenses grew faster than revenue, eroding profitability despite solid EBIT growth. The decline in EPS and net margin flags efficiency challenges in the most recent year.
Profitability Strength vs. Margin Pressure
Microsoft dominates with superior net margins and consistent profit growth, showcasing a scalable, efficient business model. Synopsys delivers impressive revenue and gross margin expansion but faces margin compression and declining EPS. For investors prioritizing sustainable profitability and operational efficiency, Microsoft’s profile presents a clearer fundamental winner.
Financial Ratios Comparison
These vital ratios act as a diagnostic tool to expose the underlying fiscal health, valuation premiums, and capital efficiency of the companies analyzed:
| Ratios | Microsoft Corporation (MSFT) | Synopsys, Inc. (SNPS) |
|---|---|---|
| ROE | 29.6% | 4.7% |
| ROIC | 22.0% | 2.0% |
| P/E | 36.3 | 54.6 |
| P/B | 10.8 | 2.6 |
| Current Ratio | 1.35 | 1.62 |
| Quick Ratio | 1.35 | 1.52 |
| D/E (Debt-to-Equity) | 0.18 | 0.50 |
| Debt-to-Assets | 9.8% | 29.6% |
| Interest Coverage | 53.9 | 2.0 |
| Asset Turnover | 0.46 | 0.15 |
| Fixed Asset Turnover | 1.23 | 5.04 |
| Payout Ratio | 23.6% | 0% |
| Dividend Yield | 0.65% | 0% |
| Fiscal Year | 2025 | 2025 |
Efficiency & Valuation Duel: The Vital Signs
Ratios act as a company’s DNA, revealing hidden risks and operational excellence that raw numbers alone cannot expose.
Microsoft Corporation
Microsoft posts a robust 29.65% ROE and a strong 36.15% net margin, signaling excellent profitability. However, its P/E of 36.31 suggests the stock trades at a premium, reflecting high growth expectations. Microsoft returns modest dividends at 0.65%, while reinvesting heavily in R&D to sustain its competitive moat and future growth.
Synopsys, Inc.
Synopsys shows weaker profitability with a 4.7% ROE and an 18.89% net margin, indicating operational challenges. Its P/E of 54.56 signals an expensive valuation, stretching investor expectations. The company offers no dividend, focusing instead on aggressive R&D investment, which accounts for over 35% of revenue, aiming to drive innovation and long-term value.
Premium Valuation vs. Operational Safety
Microsoft balances high profitability and a premium valuation, benefiting from a wide economic moat and disciplined capital allocation. Synopsys’s expensive multiples and low returns raise caution despite strong R&D. Investors seeking operational safety may prefer Microsoft, while those favoring growth risk might consider Synopsys’s innovation-driven profile.
Which one offers the Superior Shareholder Reward?
I compare Microsoft and Synopsys on dividends, payout ratios, and buybacks to assess shareholder rewards. Microsoft yields 0.65% with a 24% payout ratio, well-covered by free cash flow. It also runs a robust buyback program, fueling returns. Synopsys pays no dividends but invests heavily in growth and acquisitions, with free cash flow reinvestment near 89%. Its buybacks are minimal, focusing on long-term value creation. Microsoft’s balanced distribution and buybacks offer a more sustainable, attractive total return profile in 2026 compared to Synopsys’ growth-first approach.
Comparative Score Analysis: The Strategic Profile
The radar chart reveals the fundamental DNA and trade-offs of Microsoft Corporation and Synopsys, Inc., highlighting their financial strengths and vulnerabilities across key metrics:
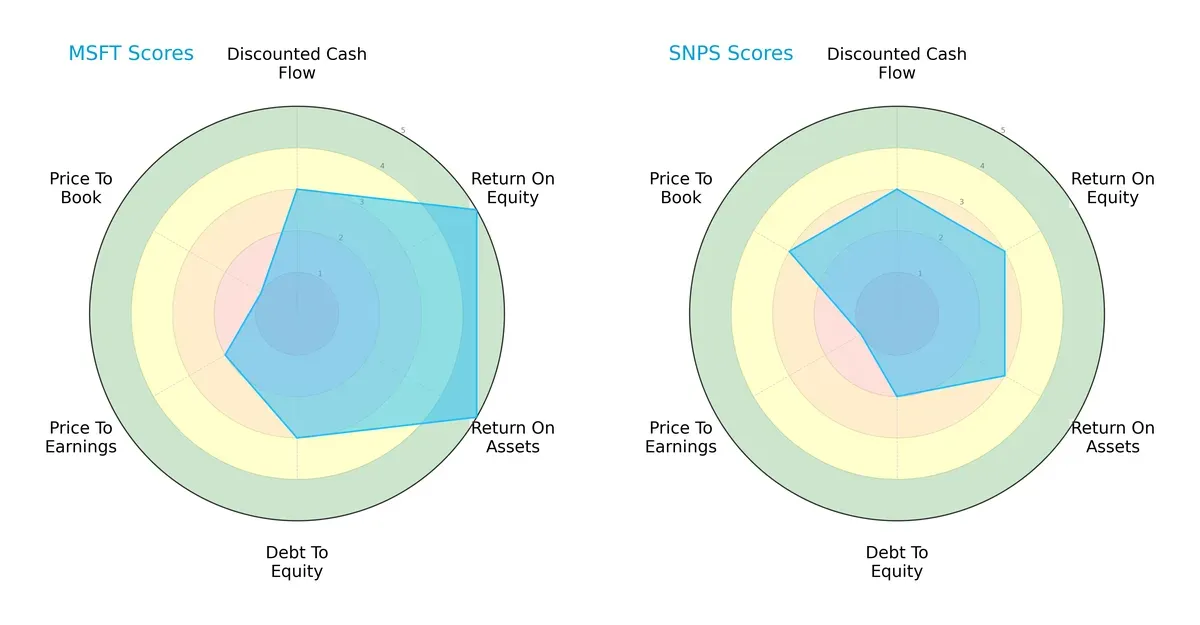
Microsoft dominates in profitability with peak ROE and ROA scores of 5, reflecting superior capital efficiency. Synopsys shows moderate returns at 3 in these areas but maintains a slightly stronger valuation balance with a better price-to-book score of 3 versus Microsoft’s 1. Microsoft’s debt-to-equity score of 3 is more conservative than Synopsys’s 2, indicating a healthier leverage profile. Overall, Microsoft offers a more balanced and robust strategic profile, while Synopsys relies more on valuation appeal amid moderate operational returns.
Bankruptcy Risk: Solvency Showdown
Microsoft’s Altman Z-Score of 9.7 versus Synopsys’s 3.5 signals a stark difference in financial safety:
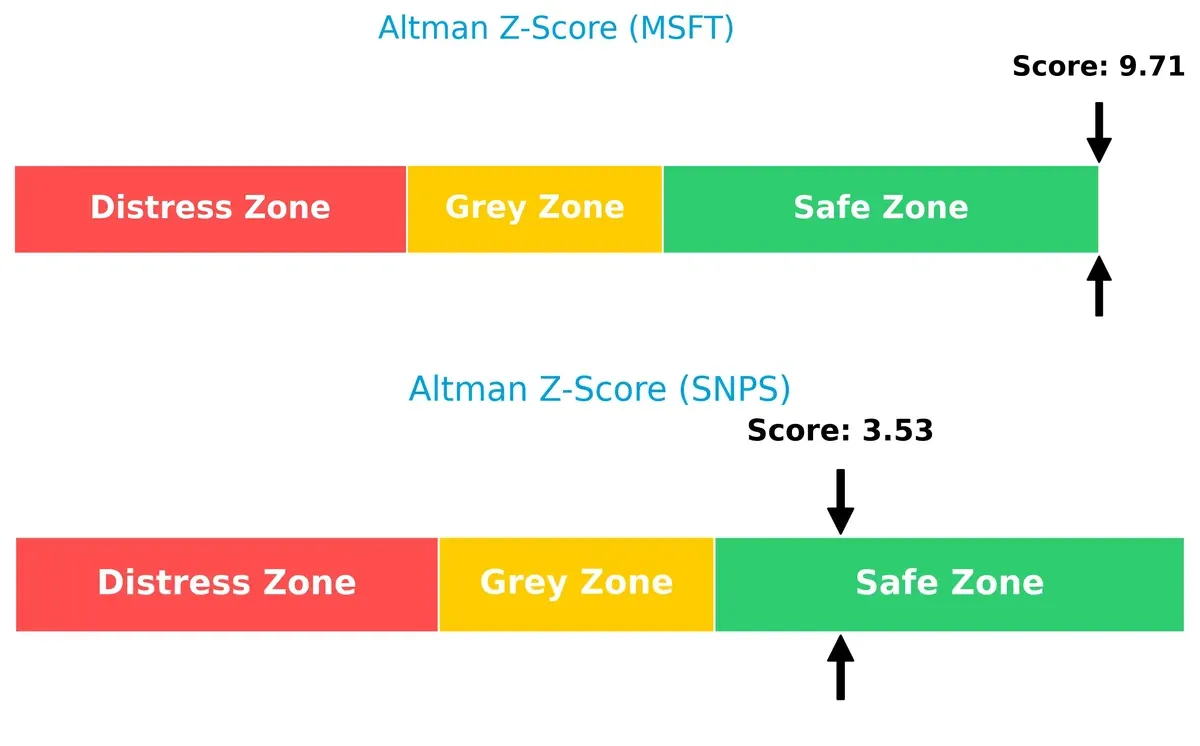
Microsoft sits comfortably in the safe zone, suggesting a very low bankruptcy risk in this cycle. Synopsys, while still in the safe zone, edges closer to the grey area, implying higher caution for long-term solvency amid market volatility.
Financial Health: Quality of Operations
Microsoft’s Piotroski F-Score of 7 versus Synopsys’s 4 marks a clear edge in operational quality and internal financial strength:
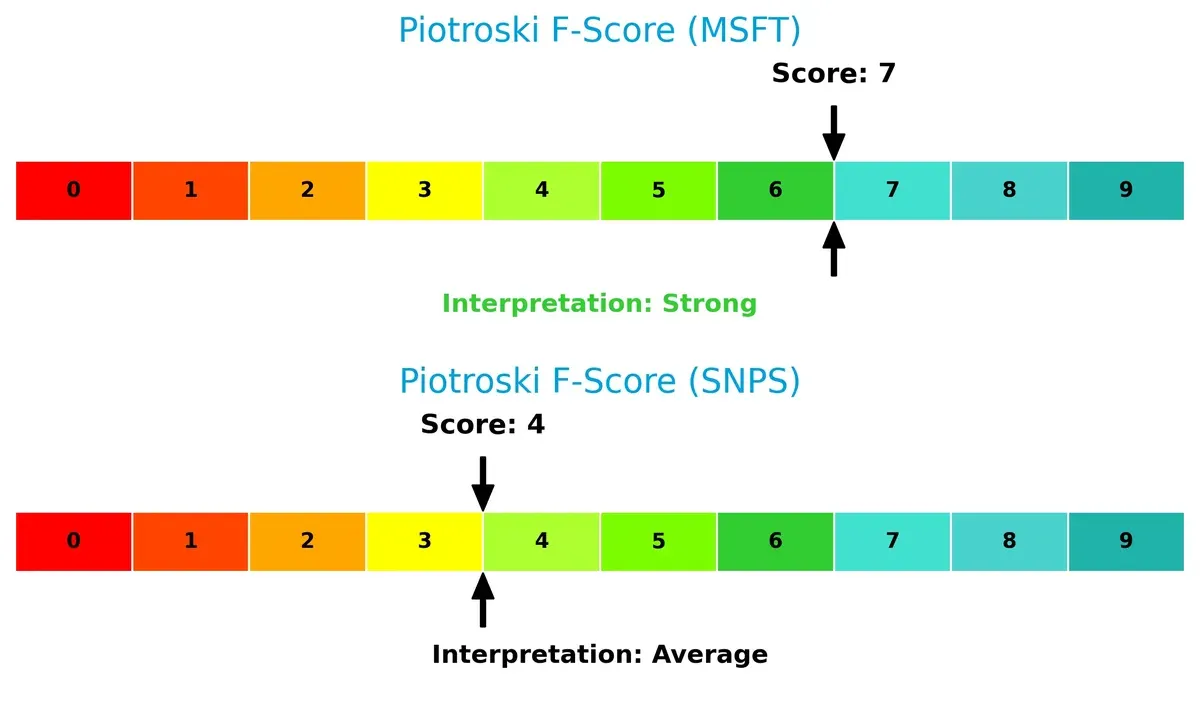
I see Microsoft as financially robust, showing strong profitability, liquidity, and efficiency metrics. Synopsys’s average score reveals some internal red flags that investors should monitor closely before commitment.
How are the two companies positioned?
This section dissects Microsoft and Synopsys’ operational DNA by comparing their revenue distribution and internal dynamics, including strengths and weaknesses. The goal is to confront their economic moats and identify which business model offers the most resilient competitive advantage today.
Revenue Segmentation: The Strategic Mix
This visual comparison dissects how Microsoft Corporation and Synopsys, Inc. diversify their income streams and reveals where their primary sector bets lie:
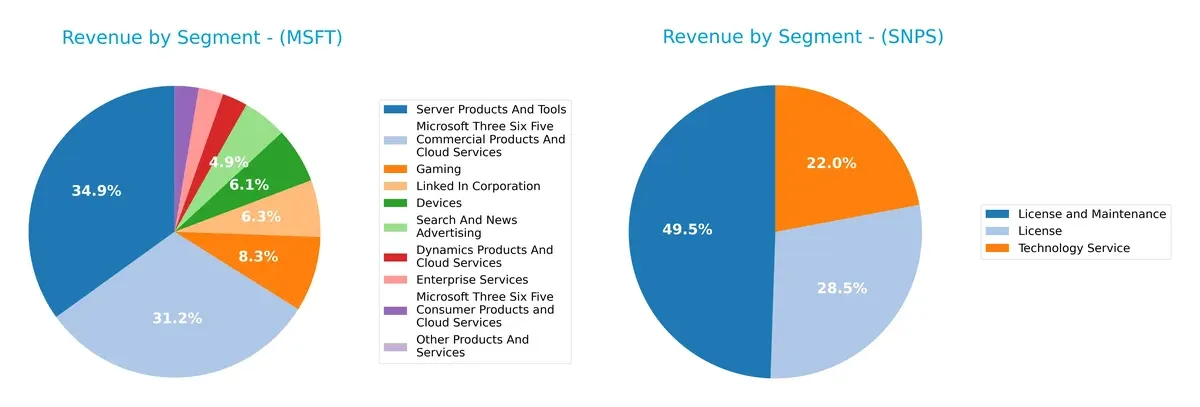
Microsoft dominates with a broad portfolio, anchored by Server Products and Tools ($98B) and Microsoft 365 Commercial ($88B). Its mix spans gaming ($23B), LinkedIn ($18B), and devices ($17B), showcasing ecosystem lock-in and infrastructure dominance. Synopsys, by contrast, pivots mainly on License and Maintenance ($3.5B) plus License ($2B), showing concentration risk in software licensing. Microsoft’s diversification cushions cyclical tech shocks; Synopsys depends heavily on core licensing revenue.
Strengths and Weaknesses Comparison
This table compares the Strengths and Weaknesses of Microsoft Corporation and Synopsys, Inc.:
Microsoft Corporation Strengths
- High net margin (36.15%) and strong ROE (29.65%)
- Favorable ROIC (22.02%) above WACC
- Diversified revenue streams across multiple segments
- Significant global presence with balanced US and Non-US sales
- Low debt-to-assets ratio (9.79%) and high interest coverage (52.84)
Synopsys, Inc. Strengths
- Favorable net margin (18.89%) and solid current and quick ratios
- Favorable fixed asset turnover (5.04) supports operational efficiency
- Favorable debt-to-assets ratio (29.64%) indicating moderate leverage
- Diverse geographic presence with US and Asia-Pacific markets
- Consistent revenue from license, maintenance, and technology services
Microsoft Corporation Weaknesses
- Unfavorable valuation metrics: high P/E (36.31) and P/B (10.76)
- Moderate current ratio (1.35) signals average liquidity
- Unfavorable asset turnover (0.46) suggests less efficient asset use
- Low dividend yield (0.65%) might deter income investors
Synopsys, Inc. Weaknesses
- Low ROE (4.7%) and ROIC (1.97%) below WACC indicate weak capital returns
- High P/E (54.56) reflects expensive valuation
- Unfavorable asset turnover (0.15) implies poor asset utilization
- Zero dividend yield limits shareholder income potential
Microsoft exhibits robust profitability and strong global diversification but faces valuation and asset efficiency challenges. Synopsys benefits from operational efficiency in fixed assets and moderate leverage but struggles with returns on capital and faces expensive valuation metrics. These factors shape their strategic priorities in profitability and capital allocation.
The Moat Duel: Analyzing Competitive Defensibility
A structural moat guards long-term profits from relentless competition erosion. Only a durable competitive advantage can sustain value creation:
Microsoft Corporation: Ecosystem Lock-in Fuels Consistent Value Creation
Microsoft’s moat stems from a vast ecosystem of software and cloud services, creating high switching costs. Its 44.7% EBIT margin and 13.2% ROIC above WACC confirm strong profitability. In 2026, Azure expansion and AI integrations could deepen its moat, despite a slight ROIC decline.
Synopsys, Inc.: Specialized IP and Design Tools Under Pressure
Synopsys relies on proprietary electronic design automation tools and IP licensing, a cost advantage moat. However, its negative ROIC vs. WACC indicates value destruction. Although revenue grows, profitability erosion and rising interest expenses threaten its position. Opportunities lie in expanding AI-driven design platforms.
Ecosystem Lock-in vs. Specialized IP: Microsoft’s Moat Runs Deeper
Microsoft’s wide ecosystem lock-in yields stable, superior returns, while Synopsys struggles to sustain value amid profitability declines. Microsoft is better positioned to defend market share with diversified, scalable assets.
Which stock offers better returns?
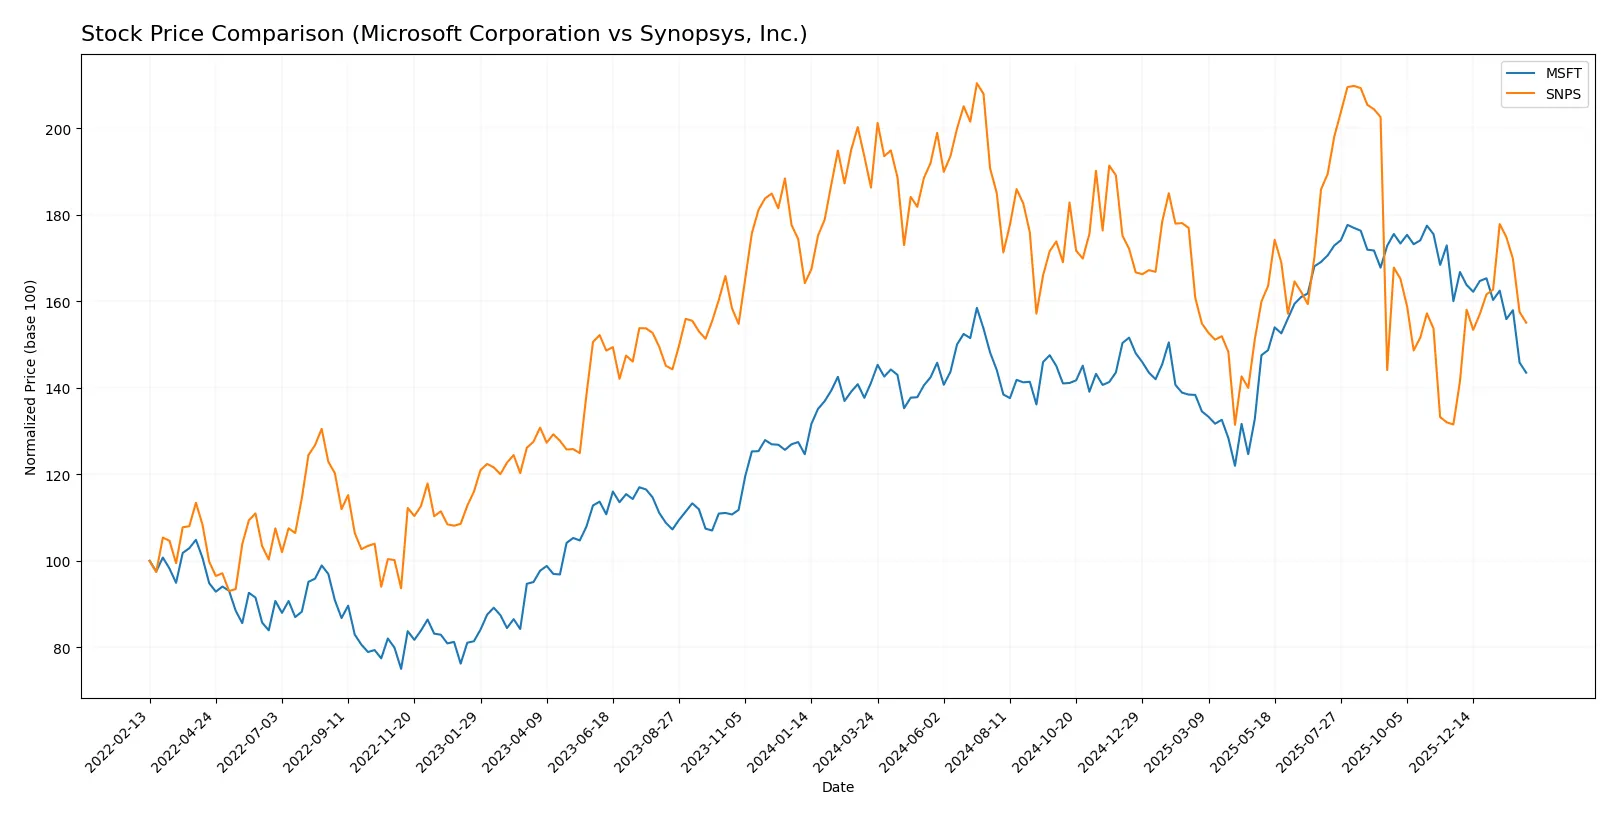
The past year reveals contrasting price dynamics for Microsoft and Synopsys, with Microsoft showing mild gains and Synopsys enduring notable declines before rebounding recently.
Trend Comparison
Microsoft’s stock rose 1.67% over the last 12 months, indicating a mild bullish trend with decelerating momentum. The price ranged from 360 to 524, showing moderate volatility.
Synopsys’s stock dropped 16.75% over the same period, reflecting a bearish trend with accelerating decline. It saw a wider price range, from 388 to 621, and higher volatility than Microsoft.
Synopsys experienced a stronger negative trend overall, but its recent rebound contrasts with Microsoft’s decelerating gains. Microsoft delivered the highest market performance over the full 12-month span.
Target Prices
Analysts present a bullish consensus for Microsoft Corporation and Synopsys, Inc., with target prices well above current levels.
| Company | Target Low | Target High | Consensus |
|---|---|---|---|
| Microsoft Corporation | 450 | 675 | 600.04 |
| Synopsys, Inc. | 425 | 600 | 530 |
Microsoft’s consensus target price of 600 implies a 42% upside from the current 423 level. Synopsys shows a similar upside potential, with a 530 consensus target versus a 458 price today. Both stocks enjoy strong analyst conviction.

Don’t Let Luck Decide Your Entry Point
Optimize your entry points with our advanced ProRealTime indicators. You’ll get efficient buy signals with precise price targets for maximum performance. Start outperforming now!
How do institutions grade them?
Microsoft Corporation Grades
Here are the most recent institutional grades for Microsoft Corporation:
| Grading Company | Action | New Grade | Date |
|---|---|---|---|
| Citigroup | Maintain | Buy | 2026-01-30 |
| Wedbush | Maintain | Outperform | 2026-01-29 |
| Cantor Fitzgerald | Maintain | Overweight | 2026-01-29 |
| RBC Capital | Maintain | Outperform | 2026-01-29 |
| Stifel | Maintain | Buy | 2026-01-29 |
| DA Davidson | Maintain | Buy | 2026-01-29 |
| Keybanc | Maintain | Overweight | 2026-01-29 |
| Piper Sandler | Maintain | Overweight | 2026-01-29 |
| Evercore ISI Group | Maintain | Outperform | 2026-01-29 |
| Wells Fargo | Maintain | Overweight | 2026-01-29 |
Synopsys, Inc. Grades
The following institutional grades reflect recent views on Synopsys, Inc.:
| Grading Company | Action | New Grade | Date |
|---|---|---|---|
| Piper Sandler | Downgrade | Neutral | 2026-01-13 |
| Morgan Stanley | Maintain | Overweight | 2025-12-12 |
| Wells Fargo | Maintain | Equal Weight | 2025-12-11 |
| Keybanc | Maintain | Overweight | 2025-12-11 |
| JP Morgan | Maintain | Overweight | 2025-12-11 |
| Piper Sandler | Maintain | Overweight | 2025-12-11 |
| B of A Securities | Upgrade | Buy | 2025-12-11 |
| Needham | Maintain | Buy | 2025-12-11 |
| Rosenblatt | Maintain | Buy | 2025-12-11 |
| Rosenblatt | Upgrade | Buy | 2025-12-09 |
Which company has the best grades?
Microsoft consistently receives strong buy and outperform ratings from multiple top-tier institutions, signaling broad confidence. Synopsys shows a mix of overweight and buy ratings but includes a recent downgrade to neutral, indicating more varied sentiment. This divergence may influence investor perception of relative stability and growth prospects.
Risks specific to each company
The following categories identify the critical pressure points and systemic threats facing both firms in the 2026 market environment:
1. Market & Competition
Microsoft Corporation
- Dominates cloud and enterprise software with vast scale but faces intense rivalry from AWS and Google Cloud.
Synopsys, Inc.
- Operates in niche electronic design automation with fewer competitors, yet faces rapid innovation demands and customer concentration risks.
2. Capital Structure & Debt
Microsoft Corporation
- Maintains low debt-to-equity (0.18) and strong interest coverage (52.84), reflecting prudent capital structure.
Synopsys, Inc.
- Higher leverage (D/E 0.5) and moderate interest coverage (4.12) introduce greater financial risk under tightening credit conditions.
3. Stock Volatility
Microsoft Corporation
- Beta at 1.084 indicates moderate sensitivity to market swings, fitting for a tech giant with diversified revenue.
Synopsys, Inc.
- Slightly higher beta (1.126) signals somewhat elevated volatility, consistent with smaller market cap and sector cyclicality.
4. Regulatory & Legal
Microsoft Corporation
- Faces significant antitrust scrutiny in multiple jurisdictions, posing ongoing legal and compliance costs.
Synopsys, Inc.
- Less exposed to regulatory risks but must navigate complex export controls and IP protection in global markets.
5. Supply Chain & Operations
Microsoft Corporation
- Benefits from a diversified global supply chain but vulnerable to semiconductor shortages impacting hardware segments.
Synopsys, Inc.
- Relies heavily on semiconductor ecosystem stability; supply disruptions could delay product rollouts and impact revenues.
6. ESG & Climate Transition
Microsoft Corporation
- Commits to carbon neutrality by 2030, investing heavily in sustainable operations and reporting.
Synopsys, Inc.
- ESG initiatives less prominent; potential risk if investor focus on sustainability intensifies in semiconductor supply chains.
7. Geopolitical Exposure
Microsoft Corporation
- Significant global footprint exposes it to US-China tensions, trade restrictions, and data sovereignty laws.
Synopsys, Inc.
- Concentrated US base but dependent on international semiconductor clients, vulnerable to geopolitical trade disruptions.
Which company shows a better risk-adjusted profile?
Microsoft’s dominant market position, superior capital structure, and robust financial health give it a clearer risk advantage. Synopsys faces higher leverage and operational concentration risks. Its moderate Altman Z-score and lower Piotroski score signal a more cautious stance. Microsoft’s highly favorable ROE (29.65%) and interest coverage (52.84) contrast with Synopsys’s weaker profitability and coverage metrics. The biggest risk for Microsoft is regulatory scrutiny, while Synopsys’s financial leverage and market niche volatility stand out. Overall, Microsoft offers a better risk-adjusted profile supported by strong balance sheet resilience and diversified revenue streams.
Final Verdict: Which stock to choose?
Microsoft’s superpower lies in its robust capital efficiency and consistent value creation, marked by a strong moat around its cloud and software ecosystem. Its declining ROIC trend is a point of vigilance, suggesting the need to monitor operational leverage. It fits well in portfolios targeting steady, long-term growth with moderate risk tolerance.
Synopsys offers a strategic moat through its niche in semiconductor design automation and a high gross margin profile. While it carries higher financial risk and weaker profitability metrics than Microsoft, it presents a compelling case for investors seeking exposure to specialized tech innovation. Its profile suits growth-oriented portfolios willing to accept volatility.
If you prioritize durable economic moats and capital efficiency, Microsoft outshines with stronger value creation and financial stability. However, if you seek targeted growth in semiconductor software and can tolerate elevated risk, Synopsys offers superior niche exposure with potential upside from industry tailwinds. Both cases require careful attention to their distinct risk-return profiles.
Disclaimer: Investment carries a risk of loss of initial capital. The past performance is not a reliable indicator of future results. Be sure to understand risks before making an investment decision.
Go Further
I encourage you to read the complete analyses of Microsoft Corporation and Synopsys, Inc. to enhance your investment decisions: