Home > Comparison > Technology > MSFT vs STNE
The strategic rivalry between Microsoft Corporation and StoneCo Ltd. shapes the evolution of the technology sector’s software infrastructure landscape. Microsoft, a diversified tech giant, combines cloud, productivity, and device ecosystems, while StoneCo focuses on fintech solutions for Brazilian merchants. This head-to-head highlights a contrast between global scale and regional specialization. This analysis will determine which corporate model offers superior risk-adjusted returns for a diversified portfolio in 2026.
Table of contents
Companies Overview
Microsoft Corporation and StoneCo Ltd. stand as key players in the evolving software infrastructure market, shaping global and regional commerce.
Microsoft Corporation: Global Software Infrastructure Powerhouse
Microsoft commands the global technology sector with its diversified software infrastructure portfolio. It generates revenue mainly through cloud services, productivity software, and operating systems. In 2026, Microsoft sharpened its strategic focus on expanding its Intelligent Cloud segment and integrating AI-driven enterprise solutions, reinforcing its competitive advantage in scalable cloud platforms and productivity ecosystems.
StoneCo Ltd.: Regional Fintech Innovator for Commerce
StoneCo Ltd. leads Brazil’s fintech landscape by providing financial technology solutions that empower merchants across multiple channels. Its revenue engine relies on transaction fees and merchant services, supported by proprietary Stone Hubs. The company’s 2026 strategy centers on deepening local market penetration and enhancing digital commerce capabilities for small and medium-sized businesses in Latin America.
Strategic Collision: Similarities & Divergences
Microsoft and StoneCo both operate within software infrastructure but diverge sharply in scale and approach. Microsoft embraces a global, cloud-centric ecosystem focused on enterprise and developer services. StoneCo adopts a localized, merchant-centric model emphasizing fintech innovation in emerging markets. Their battleground lies in digital commerce platforms, where Microsoft targets broad enterprise clients and StoneCo zeroes in on regional merchants. These distinctions define contrasting risk profiles and growth trajectories for investors.
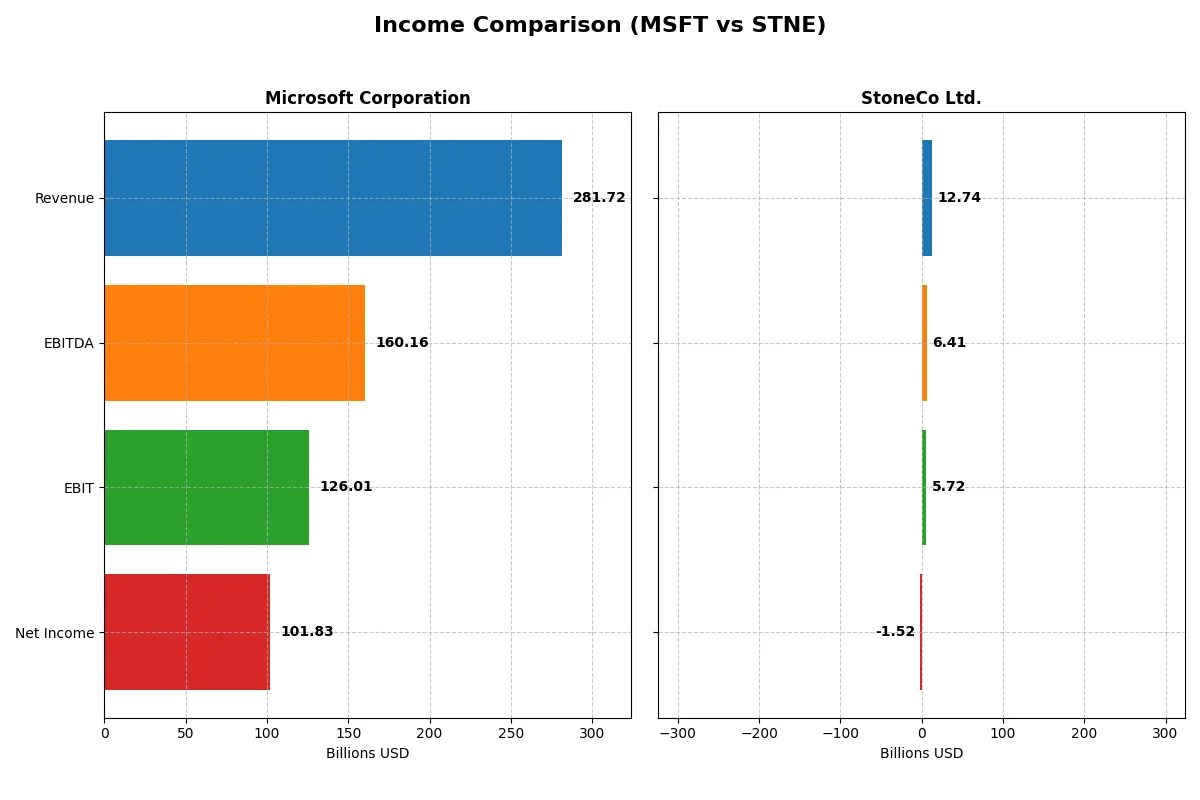
Income Statement Comparison
The following data dissects the core profitability and scalability of both corporate engines to reveal who dominates the bottom line:
| Metric | Microsoft Corporation (MSFT) | StoneCo Ltd. (STNE) |
|---|---|---|
| Revenue | 282B | 12.7B |
| Cost of Revenue | 87.8B | 3.39B |
| Operating Expenses | 65.4B | 3.47B |
| Gross Profit | 194B | 9.35B |
| EBITDA | 160B | 6.41B |
| EBIT | 126B | 5.72B |
| Interest Expense | 2.39B | 1.06B |
| Net Income | 102B | -1.52B |
| EPS | 13.7 | -5.02 |
| Fiscal Year | 2025 | 2024 |
Income Statement Analysis: The Bottom-Line Duel
This income statement comparison reveals which company’s operations run more efficiently and deliver stronger bottom-line results.
Microsoft Corporation Analysis
Microsoft’s revenue climbs steadily from $168B in 2021 to $282B in 2025, with net income rising from $61B to $102B. Gross margin remains robust near 69%, and net margin holds favorably at 36%. The 2025 results show efficient cost control and solid momentum in profitability, reflected in a 14.9% revenue growth and 15.6% EPS growth year-over-year.
StoneCo Ltd. Analysis
StoneCo’s revenue grows rapidly from BRL 3.2B in 2020 to BRL 12.7B in 2024, showcasing impressive expansion. Gross margin stays strong at 73%, and EBIT margin hits 44.9%. However, the net margin is negative at -11.9%, driven by substantial interest expenses and a sizable net loss of BRL -1.5B in 2024. Despite top-line growth, profitability struggles, raising concerns about operational leverage.
Margin Resilience vs. Growth Struggles
Microsoft delivers consistent revenue and profit growth with healthy margins, making it the clear fundamental winner. StoneCo impresses with rapid revenue expansion but suffers from persistent net losses and weak bottom-line efficiency. Investors prioritizing stable earnings will find Microsoft’s profile more attractive than StoneCo’s high-growth yet unprofitable model.
Financial Ratios Comparison
These vital ratios act as a diagnostic tool to expose the underlying fiscal health, valuation premiums, and capital efficiency of the companies compared below:
| Ratios | Microsoft Corporation (MSFT) | StoneCo Ltd. (STNE) |
|---|---|---|
| ROE | 29.6% | -12.9% |
| ROIC | 22.0% | 22.4% |
| P/E | 36.3 | -9.8 |
| P/B | 10.8 | 1.27 |
| Current Ratio | 1.35 | 1.37 |
| Quick Ratio | 1.35 | 1.37 |
| D/E (Debt-to-Equity) | 0.18 | 1.10 |
| Debt-to-Assets | 9.8% | 23.5% |
| Interest Coverage | 53.9 | 5.57 |
| Asset Turnover | 0.46 | 0.23 |
| Fixed Asset Turnover | 1.23 | 6.95 |
| Payout Ratio | 23.6% | 0% |
| Dividend Yield | 0.65% | 0% |
| Fiscal Year | 2025 | 2024 |
Efficiency & Valuation Duel: The Vital Signs
Ratios act as a company’s financial DNA, exposing hidden risks and revealing operational excellence behind headline numbers.
Microsoft Corporation
Microsoft shows robust profitability with a 29.65% ROE and a strong 36.15% net margin, reflecting operational efficiency. However, its valuation appears stretched, with a high P/E of 36.31 and P/B of 10.76. Shareholders receive a modest 0.65% dividend yield, while the company reinvests heavily in R&D, fueling future growth.
StoneCo Ltd.
StoneCo posts negative profitability metrics, including a -12.87% ROE and -11.89% net margin, signaling operational challenges. Its valuation is attractive with a P/E of -9.84 and P/B of 1.27, indicating undervaluation. The firm pays no dividends, focusing capital allocation on improving returns and scaling operations amid leverage concerns.
Premium Valuation vs. Operational Safety
Microsoft balances high profitability with a premium valuation, reflecting market confidence in growth and capital allocation. StoneCo offers value pricing but faces profitability headwinds and higher leverage risks. Investors prioritizing steady returns may favor Microsoft’s profile, while those seeking turnaround potential might lean toward StoneCo’s riskier setup.
Which one offers the Superior Shareholder Reward?
I compare Microsoft’s disciplined dividend yield near 0.65% with a payout ratio around 24%, supported by strong free cash flow of 9.6B in 2025. Its buybacks remain aggressive, enhancing shareholder value. StoneCo pays no dividends, relying on reinvestment amid losses and negative free cash flow. Buybacks are absent, raising sustainability concerns. Microsoft’s model blends reliable income with capital return, while StoneCo bets on growth turnaround. I judge Microsoft offers a more attractive and sustainable total return in 2026.
Comparative Score Analysis: The Strategic Profile
The radar chart reveals the fundamental DNA and trade-offs of both firms, highlighting their financial strengths and valuation nuances:
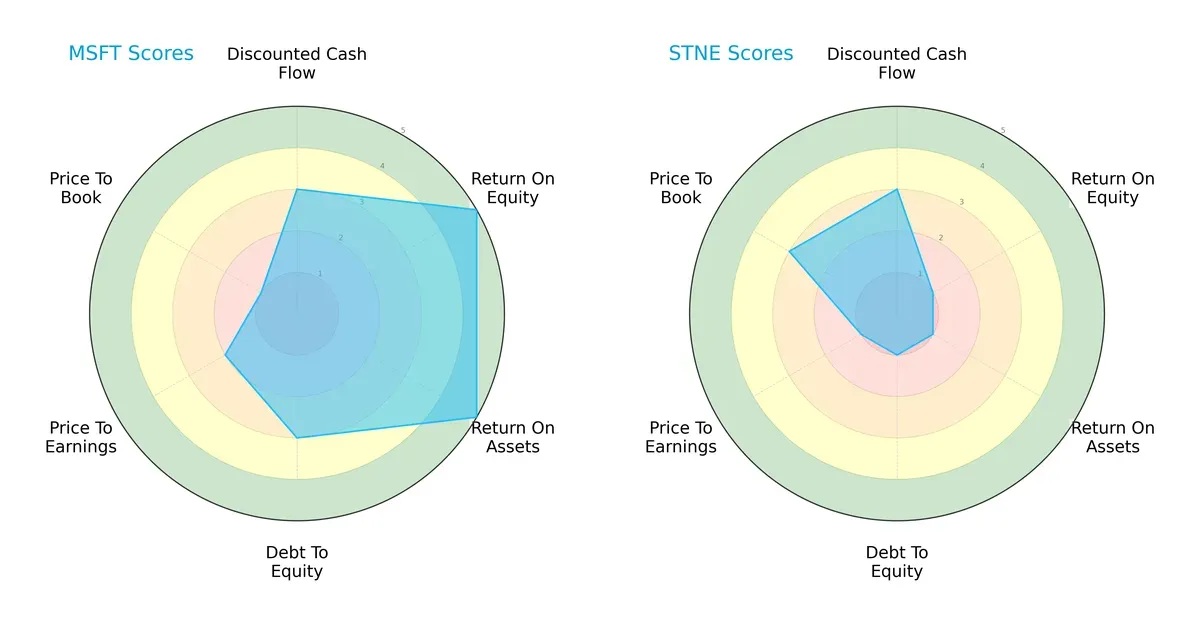
Microsoft Corporation demonstrates a more balanced profile with very favorable returns on equity and assets, supported by moderate debt management. StoneCo Ltd. relies heavily on valuation advantages but suffers from very unfavorable profitability and leverage scores, indicating a riskier financial structure.
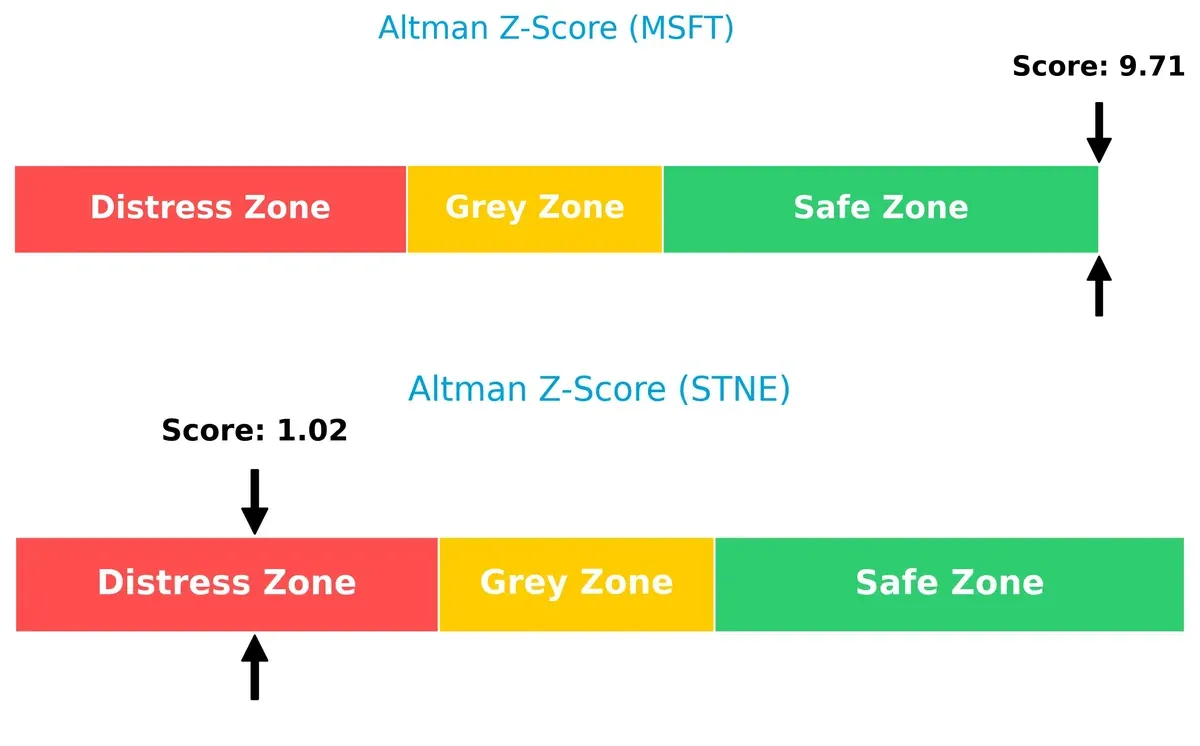
Bankruptcy Risk: Solvency Showdown
Microsoft’s Altman Z-Score of 9.7 places it securely in the safe zone, signaling robust long-term survival prospects. StoneCo’s 1.0 score signals distress and elevated bankruptcy risk in this economic cycle:
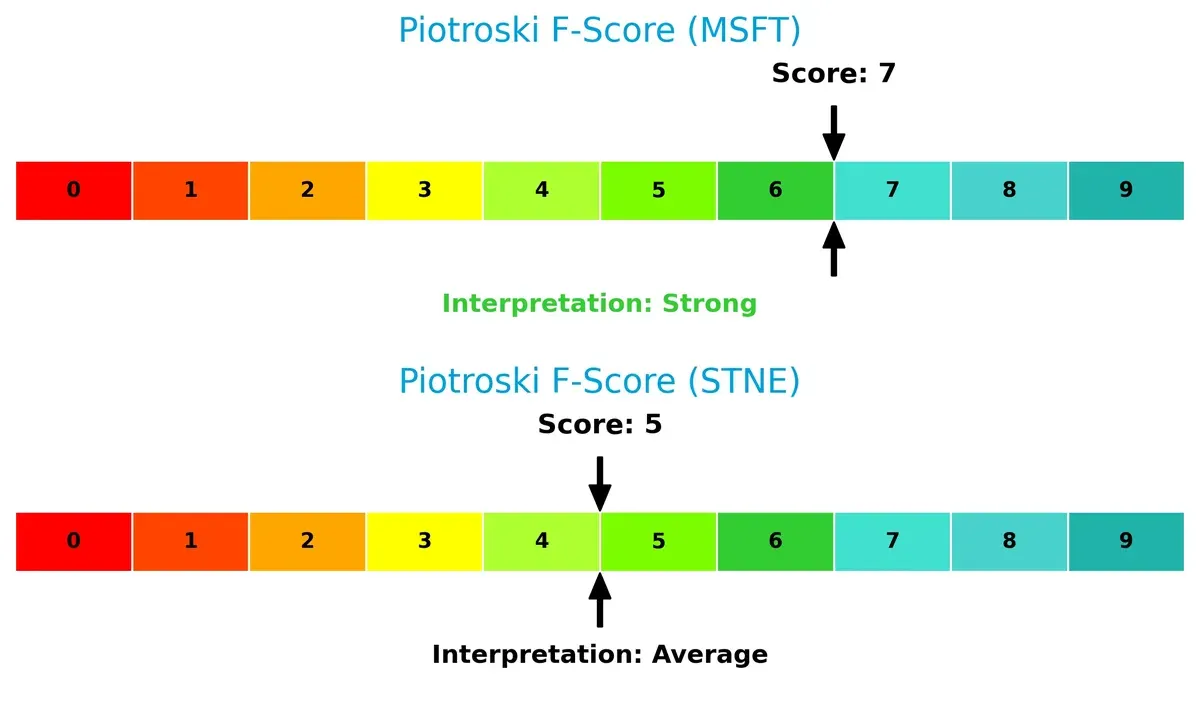
Financial Health: Quality of Operations
Microsoft’s Piotroski F-Score of 7 suggests strong financial health with solid internal metrics. StoneCo’s score of 5 indicates average quality, raising caution about operational risks relative to Microsoft:
How are the two companies positioned?
This section dissects the operational DNA of Microsoft and StoneCo by comparing revenue distribution and internal dynamics. The goal is to confront their economic moats to identify which model offers the most resilient competitive advantage today.
Revenue Segmentation: The Strategic Mix
This comparison dissects how Microsoft Corporation and StoneCo Ltd. diversify their income streams and reveals where their primary sector bets lie:
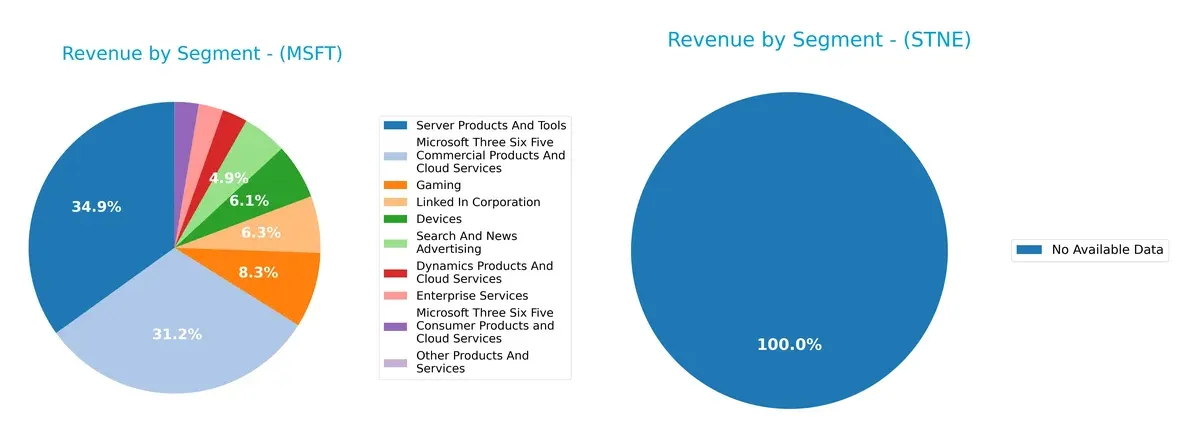
Microsoft dominates with a broad revenue spread, anchored by Server Products And Tools ($98.4B) and Microsoft 365 Commercial ($87.8B). Its Gaming ($23.5B) and LinkedIn ($17.8B) segments add diversification. StoneCo lacks disclosed segmentation data, preventing direct comparison. Microsoft’s diverse portfolio reduces concentration risk and supports ecosystem lock-in, while StoneCo’s undisclosed mix raises transparency concerns for investors seeking strategic clarity.
Strengths and Weaknesses Comparison
This table compares the Strengths and Weaknesses of Microsoft Corporation and StoneCo Ltd.:
Microsoft Strengths
- Highly diversified product portfolio across cloud, gaming, enterprise, and devices
- Favorable profitability ratios including 36.15% net margin and 29.65% ROE
- Strong global presence with balanced US and non-US revenues around 140B USD each
- Solid financial health with low debt-to-assets at 9.79% and high interest coverage ratio
StoneCo Strengths
- Favorable ROIC at 22.41% indicating efficient capital use
- Low price-to-book at 1.27 suggesting undervaluation
- Favorable quick ratio and interest coverage imply liquidity strength
- Strong fixed asset turnover at 6.95 denotes asset utilization efficiency
Microsoft Weaknesses
- Unfavorable valuation multiples: high P/E at 36.31 and P/B at 10.76
- Asset turnover below 0.5 limits revenue generation from assets
- Low dividend yield of 0.65% may deter income-focused investors
StoneCo Weaknesses
- Negative profitability with net margin at -11.89% and ROE at -12.87%
- High debt-to-equity ratio at 1.1 raises leverage concerns
- WACC at 10.7% exceeds ROIC, indicating potential value destruction
- Zero dividend yield limits shareholder returns
Microsoft’s strengths lie in diversified revenue streams and robust profitability backed by a solid balance sheet. StoneCo shows operational efficiency but suffers from negative profitability and higher leverage. These contrasts suggest Microsoft’s strategy focuses on global scale and steady earnings, while StoneCo faces challenges in turning efficient asset use into net profits.
The Moat Duel: Analyzing Competitive Defensibility
A structural moat is the sole barrier safeguarding long-term profits from relentless competition erosion. Let’s dissect these moats:
Microsoft Corporation: Ecosystem Lock-in and Intangible Assets
Microsoft’s moat stems from its massive ecosystem and strong intangible assets like Office 365 and Azure. This yields a high ROIC of 13.2%, though slightly declining. Expansion in cloud AI services in 2026 could deepen this edge, but competition remains fierce.
StoneCo Ltd.: Rapidly Growing Network Effects
StoneCo leverages network effects within Brazil’s digital payments market, reflected in an improving ROIC trend and strong margin improvement. Unlike Microsoft’s global scale, StoneCo’s moat is regional but shows durable growth potential through fintech innovations in Latin America.
Verdict: Ecosystem Lock-in vs. Network Effects Growth
Microsoft’s entrenched ecosystem offers a wider moat with stable high returns despite slight ROIC decline. StoneCo’s moat is narrower but deepening quickly, showing stronger ROIC momentum. Microsoft remains better positioned to defend global market share in 2026.
Which stock offers better returns?
Over the past year, Microsoft showed a modest price rise with decelerating momentum, while StoneCo experienced a slight overall decline accelerating recently.
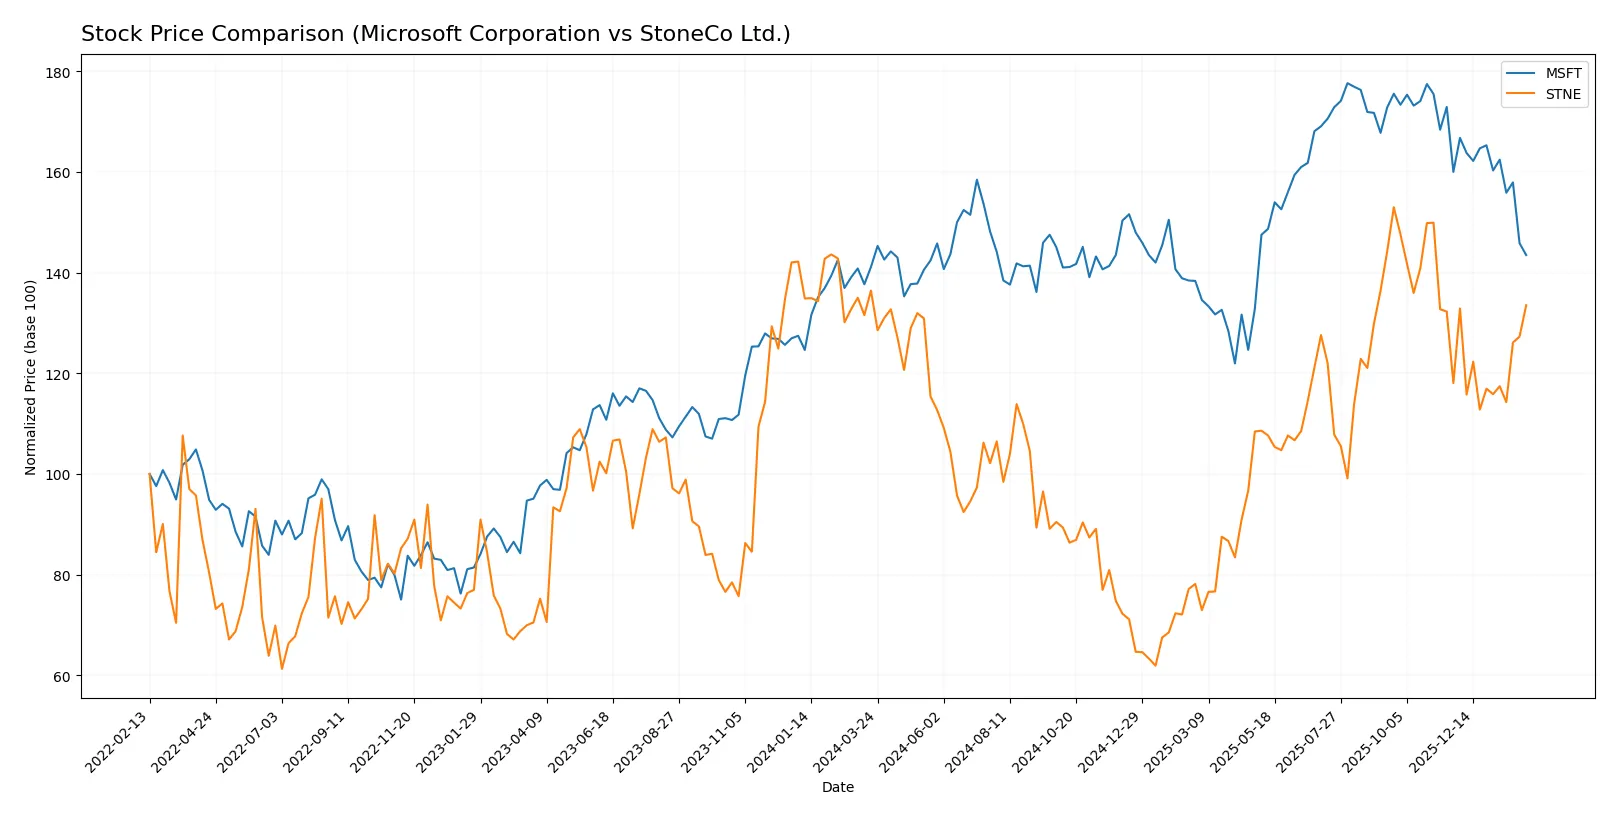
Trend Comparison
Microsoft’s stock rose 1.67% over the past year, signaling a bullish but decelerating trend. Its price ranged between 360 and 524, with high volatility at 41.8 standard deviation.
StoneCo’s stock declined 2.14% over the past year, marking a bearish trend with accelerating momentum. The price fluctuated from 7.85 to 19.4, and volatility remained low at 2.91 standard deviation.
Microsoft delivered the highest market performance overall, despite recent short-term weakness, while StoneCo showed recent strength but ended the year down.
Target Prices
Analysts present a clear consensus on target prices for Microsoft Corporation and StoneCo Ltd.
| Company | Target Low | Target High | Consensus |
|---|---|---|---|
| Microsoft Corporation | 450 | 675 | 600.04 |
| StoneCo Ltd. | 19 | 21 | 19.83 |
The consensus target for Microsoft suggests a 41% upside from the current price of 423.37, reflecting strong growth expectations. StoneCo’s target price implies a 17% potential increase from its current 16.94, signaling moderate optimism among analysts.

Don’t Let Luck Decide Your Entry Point
Optimize your entry points with our advanced ProRealTime indicators. You’ll get efficient buy signals with precise price targets for maximum performance. Start outperforming now!
How do institutions grade them?
Microsoft Corporation Grades
The following table shows recent grades from reputable financial institutions for Microsoft Corporation.
| Grading Company | Action | New Grade | Date |
|---|---|---|---|
| Citigroup | Maintain | Buy | 2026-01-30 |
| Wedbush | Maintain | Outperform | 2026-01-29 |
| Cantor Fitzgerald | Maintain | Overweight | 2026-01-29 |
| RBC Capital | Maintain | Outperform | 2026-01-29 |
| Stifel | Maintain | Buy | 2026-01-29 |
| DA Davidson | Maintain | Buy | 2026-01-29 |
| Keybanc | Maintain | Overweight | 2026-01-29 |
| Piper Sandler | Maintain | Overweight | 2026-01-29 |
| Evercore ISI Group | Maintain | Outperform | 2026-01-29 |
| Wells Fargo | Maintain | Overweight | 2026-01-29 |
StoneCo Ltd. Grades
The following table shows recent grades from reputable financial institutions for StoneCo Ltd.
| Grading Company | Action | New Grade | Date |
|---|---|---|---|
| Goldman Sachs | Maintain | Buy | 2026-01-28 |
| UBS | Maintain | Buy | 2026-01-28 |
| Goldman Sachs | Maintain | Buy | 2025-10-14 |
| B of A Securities | Maintain | Buy | 2025-09-09 |
| UBS | Maintain | Buy | 2025-08-29 |
| JP Morgan | Maintain | Overweight | 2025-07-16 |
| Barclays | Maintain | Equal Weight | 2025-05-12 |
| Barclays | Maintain | Equal Weight | 2025-04-23 |
| Citigroup | Upgrade | Buy | 2025-04-22 |
| Morgan Stanley | Maintain | Underweight | 2025-03-21 |
Which company has the best grades?
Microsoft receives consistently strong grades focused on “Buy,” “Outperform,” and “Overweight” ratings. StoneCo shows mostly “Buy” grades with some “Equal Weight” and one recent upgrade. Microsoft’s broader institutional support suggests greater confidence, potentially reducing risk for investors.
Risks specific to each company
The following categories identify critical pressure points and systemic threats facing both firms in the 2026 market environment:
1. Market & Competition
Microsoft Corporation
- Dominates global software infrastructure with diversified cloud and productivity segments. Faces intense competition from AWS, Google Cloud, and emerging AI firms.
StoneCo Ltd.
- Competes in Brazil’s fintech market, challenged by local banks and international digital payment platforms. Limited geographic diversification increases vulnerability.
2. Capital Structure & Debt
Microsoft Corporation
- Maintains low debt-to-equity ratio at 0.18, with strong interest coverage of 52.8x indicating solid financial stability.
StoneCo Ltd.
- Higher leverage with debt-to-equity of 1.1, though interest coverage remains adequate at 5.4x. Debt burden is a concern amid volatile earnings.
3. Stock Volatility
Microsoft Corporation
- Beta of 1.08 suggests moderate volatility, consistent with large-cap tech stocks.
StoneCo Ltd.
- Beta of 1.79 signals elevated volatility, reflecting market sensitivity and smaller market cap.
4. Regulatory & Legal
Microsoft Corporation
- Faces ongoing antitrust scrutiny and data privacy regulations globally, but has experience managing complex compliance landscapes.
StoneCo Ltd.
- Subject to Brazil’s evolving fintech regulations and currency controls, increasing operational uncertainty.
5. Supply Chain & Operations
Microsoft Corporation
- Robust global supply chain with diversified suppliers for devices and cloud infrastructure.
StoneCo Ltd.
- Reliant on local technology providers and payment networks; supply chain disruptions in Brazil pose material risks.
6. ESG & Climate Transition
Microsoft Corporation
- Committed to carbon neutrality and strong ESG reporting, enhancing brand reputation and investor appeal.
StoneCo Ltd.
- ESG practices less transparent; climate transition risks in Brazil’s regulatory environment remain uncertain.
7. Geopolitical Exposure
Microsoft Corporation
- Exposure diversified globally, mitigating risks from any single region.
StoneCo Ltd.
- Concentrated exposure in Brazil and Latin America heightens vulnerability to regional political instability.
Which company shows a better risk-adjusted profile?
Microsoft’s dominant market position and conservative capital structure provide a more resilient risk-adjusted profile. StoneCo’s key risk lies in high leverage combined with regional concentration and regulatory uncertainty. Microsoft’s Altman Z-score of 9.7 confirms strong financial health, while StoneCo’s 1.0 indicates distress risk. The widening gap in interest coverage and debt levels justifies caution on StoneCo despite growth potential.
Final Verdict: Which stock to choose?
Microsoft Corporation’s superpower lies in its unmatched capital efficiency and consistent value creation. It commands a strong competitive moat with high returns on invested capital, though its premium valuation and slowing ROIC trend warrant vigilance. It suits portfolios aiming for stable, long-term growth with moderate risk tolerance.
StoneCo Ltd. boasts a durable competitive advantage marked by rapidly improving profitability and a strategic foothold in digital payments. Despite a weaker safety profile and recent negative earnings, its attractive valuation and growth trajectory appeal to investors favoring emerging market exposure and higher risk-reward profiles.
If you prioritize durable, steady value creation and capital efficiency, Microsoft outshines as the compelling choice due to its robust moat and financial strength. However, if you seek high-growth potential with an appetite for volatility, StoneCo offers superior upside through accelerating ROIC and growth, albeit with pronounced risks.
Disclaimer: Investment carries a risk of loss of initial capital. The past performance is not a reliable indicator of future results. Be sure to understand risks before making an investment decision.
Go Further
I encourage you to read the complete analyses of Microsoft Corporation and StoneCo Ltd. to enhance your investment decisions: