Home > Comparison > Technology > MSFT vs PANW
The strategic rivalry between Microsoft Corporation and Palo Alto Networks defines the current trajectory of the software infrastructure sector. Microsoft operates as a diversified technology powerhouse with extensive cloud, productivity, and personal computing segments. In contrast, Palo Alto Networks focuses sharply on cybersecurity solutions with high-margin subscription services. This analysis will evaluate which company’s operational model delivers superior risk-adjusted returns for a diversified portfolio navigating evolving technological demands.
Table of contents
Companies Overview
Microsoft Corporation and Palo Alto Networks, Inc. stand as key players shaping the software infrastructure landscape.
Microsoft Corporation: Software Infrastructure Giant
Microsoft dominates the software infrastructure market with diversified revenue streams across cloud computing, productivity tools, and personal computing. Its core engine includes Azure cloud services, Office 365 subscriptions, and Windows licensing. In 2026, the company sharpens its focus on expanding cloud capabilities and integrating AI solutions within enterprise ecosystems to sustain its competitive advantage.
Palo Alto Networks, Inc.: Cybersecurity Innovator
Palo Alto Networks leads in the cybersecurity software sector, generating revenue through firewall appliances, subscription-based threat prevention, and cloud security services. In 2026, it prioritizes enhancing its security analytics and automation offerings to address evolving cyber threats, targeting medium to large enterprises across diverse industries.
Strategic Collision: Similarities & Divergences
Both firms operate within software infrastructure but diverge sharply in approach. Microsoft embraces a broad ecosystem spanning cloud, productivity, and devices, while Palo Alto focuses narrowly on security. Their primary battleground is enterprise cloud adoption, where security integration is critical. Microsoft offers diversified stability; Palo Alto presents high-growth potential with cybersecurity specialization.
Income Statement Comparison
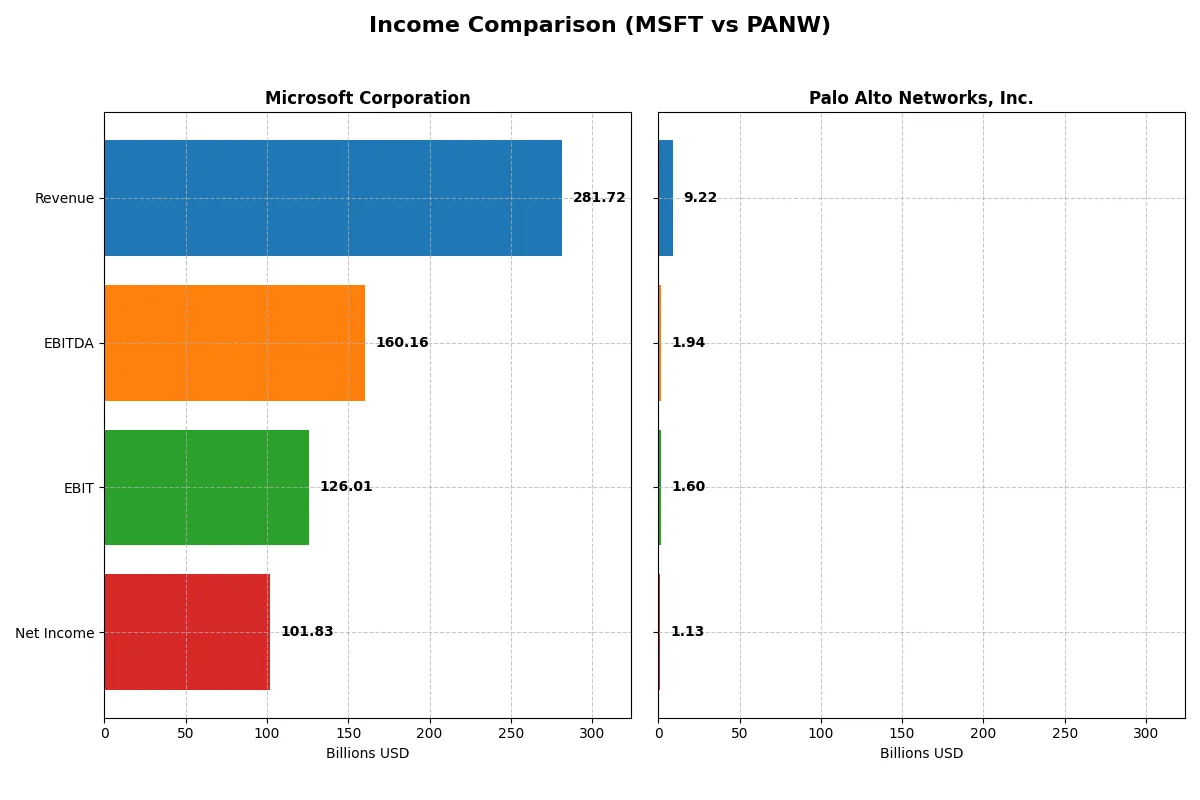
This data dissects the core profitability and scalability of both corporate engines to reveal who dominates the bottom line:
| Metric | Microsoft Corporation (MSFT) | Palo Alto Networks, Inc. (PANW) |
|---|---|---|
| Revenue | 282B | 9.2B |
| Cost of Revenue | 87.8B | 2.45B |
| Operating Expenses | 65.4B | 5.53B |
| Gross Profit | 194B | 6.77B |
| EBITDA | 160B | 1.94B |
| EBIT | 126B | 1.60B |
| Interest Expense | 2.39B | 3.0M |
| Net Income | 102B | 1.13B |
| EPS | 13.7 | 1.71 |
| Fiscal Year | 2025 | 2025 |
Income Statement Analysis: The Bottom-Line Duel
This income statement comparison reveals the true efficiency and growth dynamics driving each company’s financial engine through recent fiscal years.
Microsoft Corporation Analysis
Microsoft’s revenue climbed from $168B in 2021 to $282B in 2025, reflecting robust growth. Net income surged from $61B to $102B, sustaining a strong net margin near 36%. Gross margin remains healthy at 68.8%, illustrating efficient cost control. The 2025 fiscal year shows momentum with a 15% revenue increase and stable profitability, highlighting operational strength.
Palo Alto Networks, Inc. Analysis
Palo Alto Networks expanded revenue from $4.3B in 2021 to $9.2B in 2025, doubling its scale. Net income turned positive with a $1.1B profit in 2025 after earlier losses, though the net margin at 12.3% trails Microsoft’s. Gross margin remains impressive at 73.4%. The 2025 year saw a sharp EBIT growth of 61%, yet net margin and EPS declined, signaling margin pressure despite top-line gains.
Scale and Margin: Industry Giant vs. High Growth Challenger
Microsoft delivers superior scale and margin efficiency, with consistent profitability and solid margin expansion. Palo Alto Networks impresses with rapid revenue and net income growth but faces volatility in net margin and earnings per share. For investors, Microsoft offers stability and cash flow strength; Palo Alto Networks presents a riskier, high-growth profile requiring close margin monitoring.
Financial Ratios Comparison
These vital ratios act as a diagnostic tool to expose underlying fiscal health, valuation premiums, and capital efficiency for Microsoft Corporation (MSFT) and Palo Alto Networks, Inc. (PANW):
| Ratios | Microsoft Corporation (MSFT) | Palo Alto Networks, Inc. (PANW) |
|---|---|---|
| ROE | 29.6% | 14.5% |
| ROIC | 22.0% | 5.7% |
| P/E | 36.3 | 101.4 |
| P/B | 10.8 | 14.7 |
| Current Ratio | 1.35 | 0.89 |
| Quick Ratio | 1.35 | 0.89 |
| D/E | 0.18 | 0.04 |
| Debt-to-Assets | 9.8% | 1.4% |
| Interest Coverage | 53.9 | 414.3 |
| Asset Turnover | 0.46 | 0.39 |
| Fixed Asset Turnover | 1.23 | 12.56 |
| Payout Ratio | 23.6% | 0% |
| Dividend Yield | 0.65% | 0% |
| Fiscal Year | 2025 | 2025 |
Efficiency & Valuation Duel: The Vital Signs
Financial ratios act as a company’s DNA, exposing hidden risks and operational strengths critical for informed investment decisions.
Microsoft Corporation
Microsoft demonstrates strong profitability with a 29.65% ROE and a robust 36.15% net margin, signaling operational excellence. Its valuation appears stretched, with a high P/E of 36.31 and P/B of 10.76. Shareholders receive a modest 0.65% dividend yield, complemented by consistent reinvestment in R&D, supporting future growth.
Palo Alto Networks, Inc.
Palo Alto shows moderate profitability, with a 14.49% ROE and a 12.3% net margin, reflecting steady but less dominant operations. The valuation is highly stretched, marked by a steep P/E of 101.43 and P/B of 14.7. It offers no dividend, instead prioritizing aggressive R&D investment to fuel expansion.
Premium Valuation vs. Operational Safety
Microsoft balances strong returns and operational safety despite rich valuation multiples. Palo Alto carries higher valuation risk and lower profitability but invests heavily in growth. Risk-averse investors may prefer Microsoft’s solid fundamentals; growth seekers might find Palo Alto’s profile more appealing.
Which one offers the Superior Shareholder Reward?
I compare Microsoft Corporation and Palo Alto Networks, Inc. on shareholder returns in 2026. Microsoft pays a dividend yield around 0.65%, well covered by free cash flow, with a payout ratio near 24%. It also runs consistent buybacks, strengthening total returns. Palo Alto Networks pays no dividend but reinvests heavily in growth with a free cash flow conversion above 90%. Buybacks are absent, increasing reliance on capital appreciation. Microsoft’s distribution is more sustainable, blending income and buybacks, while Palo Alto depends on operational growth and market multiple expansion. I conclude Microsoft offers a more balanced and reliable total return profile for investors today.
Comparative Score Analysis: The Strategic Profile
The radar chart reveals the fundamental DNA and trade-offs of Microsoft Corporation and Palo Alto Networks, Inc., highlighting their distinct strategic strengths:
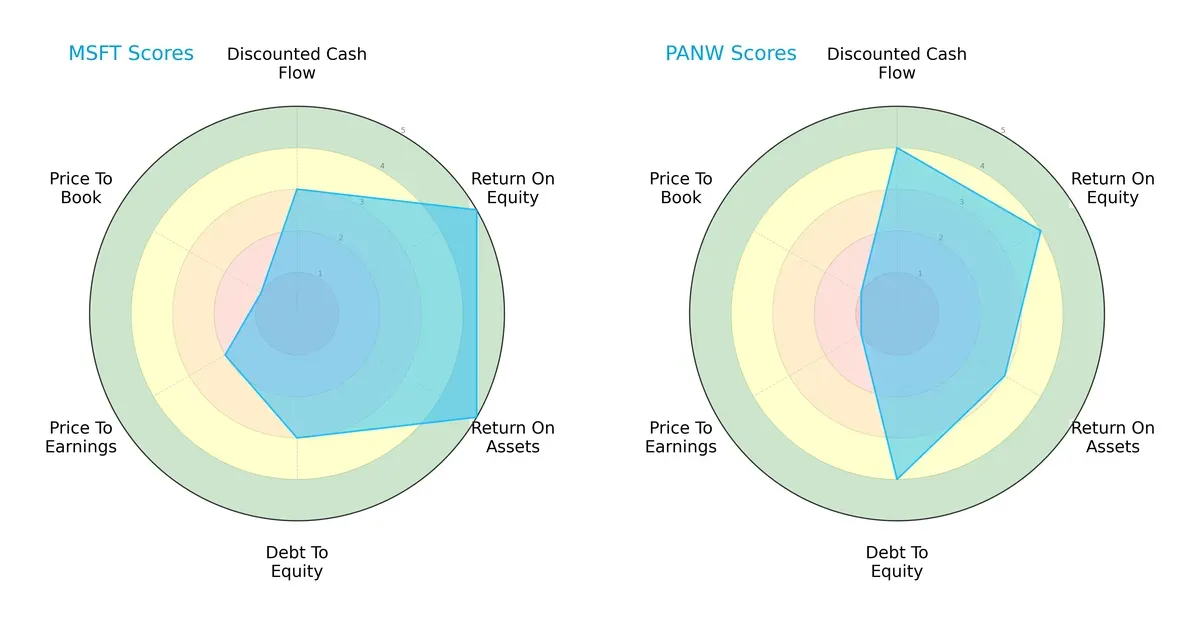
Microsoft displays superior profitability metrics with top-tier ROE and ROA scores (both 5), signaling efficient capital use and asset management. Palo Alto leads in discounted cash flow (4) and maintains a stronger debt-to-equity position (4), reflecting prudent leverage and growth potential. Microsoft’s valuation scores lag significantly (P/E at 2 and P/B at 1), suggesting potential overvaluation risks. Overall, Microsoft offers a highly efficient but less balanced profile, while Palo Alto presents a more balanced risk-return trade-off anchored by cash flow and moderate leverage.
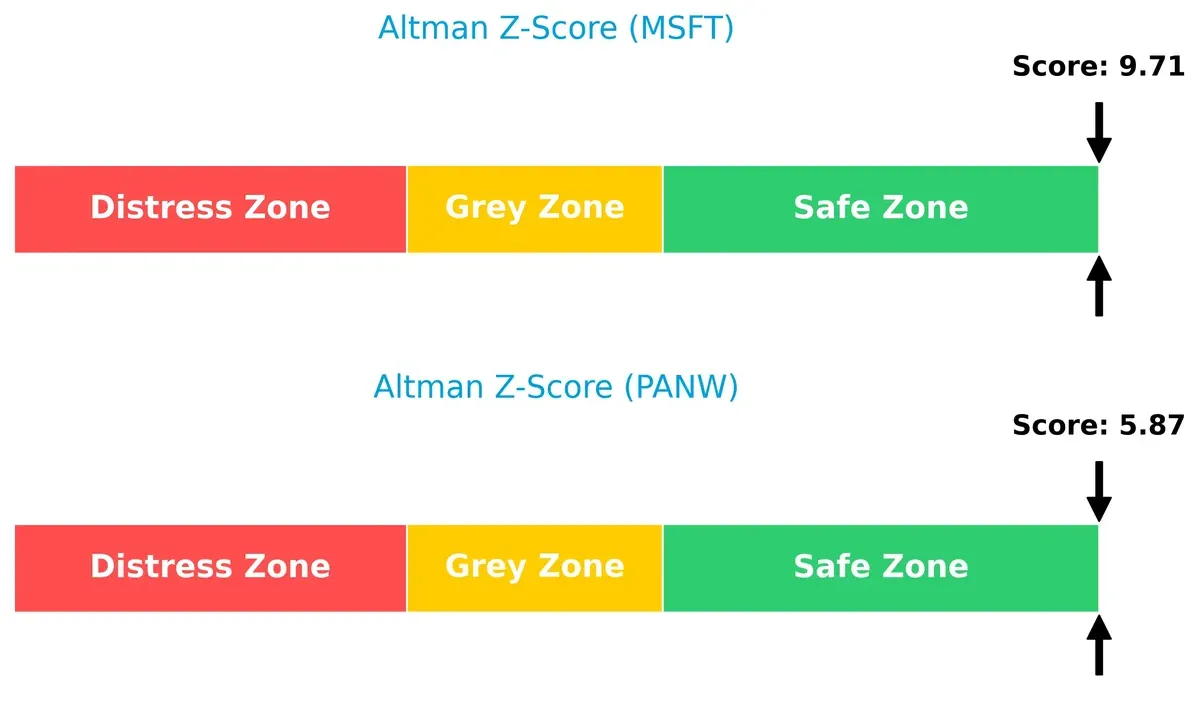
Bankruptcy Risk: Solvency Showdown
Microsoft’s Altman Z-Score of 9.7 vastly exceeds Palo Alto’s 5.9, placing both well within the safe zone but indicating Microsoft’s stronger resilience for long-term survival in volatile markets:
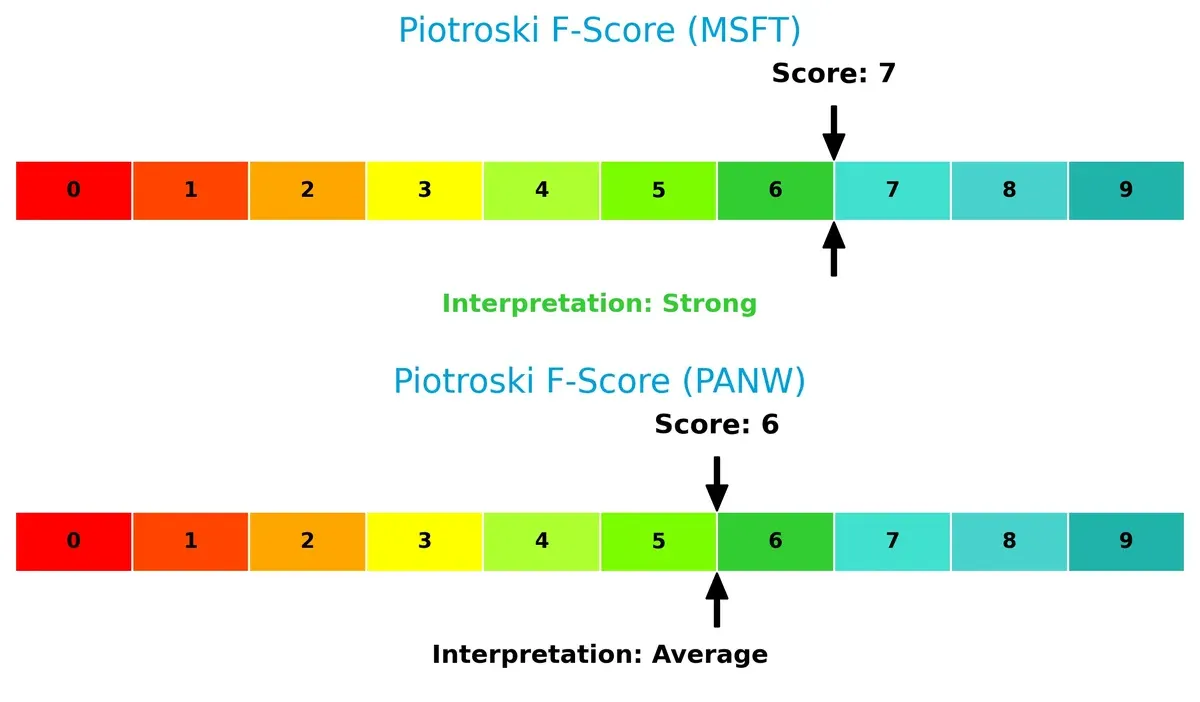
Financial Health: Quality of Operations
Microsoft’s Piotroski F-Score of 7 outperforms Palo Alto’s 6, signaling superior operational quality and fewer internal red flags. Both firms show financial strength, but Microsoft edges ahead in overall earnings quality and balance sheet robustness:
How are the two companies positioned?
This section dissects the operational DNA of Microsoft and Palo Alto Networks by comparing revenue distribution and internal dynamics. The goal is to confront their economic moats and identify which model offers the most resilient competitive advantage today.
Revenue Segmentation: The Strategic Mix
This visual comparison dissects how Microsoft Corporation and Palo Alto Networks diversify their income streams and where their primary sector bets lie:
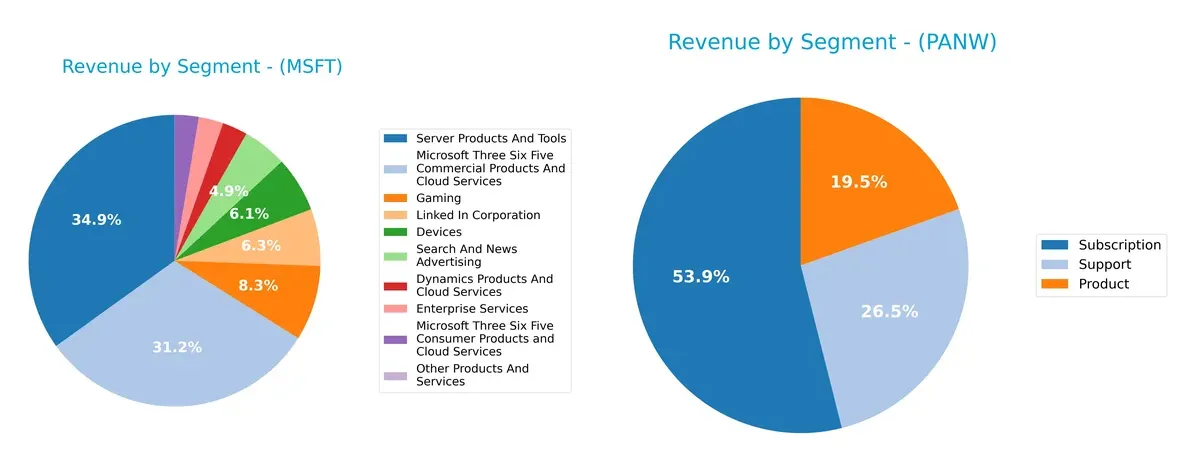
Microsoft’s revenue dwarfs Palo Alto Networks’, anchored by highly diversified segments like Server Products and Tools ($98.4B), Microsoft 365 Commercial ($87.8B), and Gaming ($23.5B). Palo Alto Networks pivots heavily on Subscription revenue ($4.97B), with smaller, less varied Product ($1.8B) and Support ($2.45B) segments. Microsoft’s broad ecosystem reduces concentration risk, while Palo Alto’s reliance on subscriptions reflects strong recurring revenue but heightens exposure to market shifts in cybersecurity demand.
Strengths and Weaknesses Comparison
This table compares the Strengths and Weaknesses of Microsoft Corporation and Palo Alto Networks, Inc.:
Microsoft Corporation Strengths
- Highly diversified revenue streams across cloud, enterprise, gaming, and advertising
- Strong profitability with 36.15% net margin and 29.65% ROE
- Favorable leverage and liquidity ratios
- Significant global presence with balanced US and non-US revenue
- Large market share in multiple software segments
Palo Alto Networks, Inc. Strengths
- Focused subscription-based business model supports recurring revenue
- Favorable WACC and strong interest coverage ratio
- High fixed asset turnover indicates efficient asset use
- Expanding global footprint with growth in Americas, Asia Pacific, and EMEA
- Positive net margin and moderate profitability metrics
Microsoft Corporation Weaknesses
- Unfavorable valuation multiples (PE 36.31, PB 10.76) suggest premium pricing
- Lower asset turnover reflects potential inefficiencies
- Dividend yield is low at 0.65%
- Neutral current ratio signals moderate short-term liquidity
- Exposure to intense competition in multiple segments
Palo Alto Networks, Inc. Weaknesses
- Unfavorable valuation metrics with high PE (101.43) and PB (14.7)
- Weak current ratio (0.89) indicates liquidity risk
- Lower ROIC (5.67%) relative to WACC reduces capital efficiency
- No dividend yield limits investor income
- Net margin and ROE below Microsoft’s levels
Both companies show slightly favorable overall ratios but differ in scale and business model. Microsoft’s broad diversification and strong profitability contrast with Palo Alto’s focused growth and asset efficiency. Liquidity and valuation metrics suggest caution for Palo Alto, while Microsoft’s premium valuation demands justified growth.
The Moat Duel: Analyzing Competitive Defensibility
A structural moat is the only barrier protecting long-term profits from relentless competition erosion. Let’s examine the moat dynamics of two tech giants:
Microsoft Corporation: Ecosystem Moat Fuels Margin Stability
Microsoft’s competitive advantage comes from its vast ecosystem and entrenched Intangible Assets. This manifests in high ROIC versus WACC and stable 44.7% EBIT margins. In 2026, its cloud expansion and AI integrations deepen this moat, though slowing ROIC signals emerging pressure.
Palo Alto Networks, Inc.: Innovation-Driven Growth Moat
Palo Alto Networks leverages rapid innovation and Network Effects in cybersecurity. Unlike Microsoft’s scale, its moat is narrower but growing, supported by a surging ROIC trend despite current value destruction. Its expanding cloud security offerings position it well for market disruption in 2026.
Ecosystem Scale vs. Innovation Momentum: The Moat Showdown
Microsoft wields a wider moat anchored by a mature ecosystem and superior profitability metrics. Palo Alto Networks exhibits a promising moat trajectory but lacks Microsoft’s entrenched scale. Microsoft remains better equipped to defend its dominant market share long-term.
Which stock offers better returns?
The past year showed contrasting dynamics: Microsoft’s price edged up modestly with decelerating momentum, while Palo Alto Networks surged strongly before slowing down near recent highs.
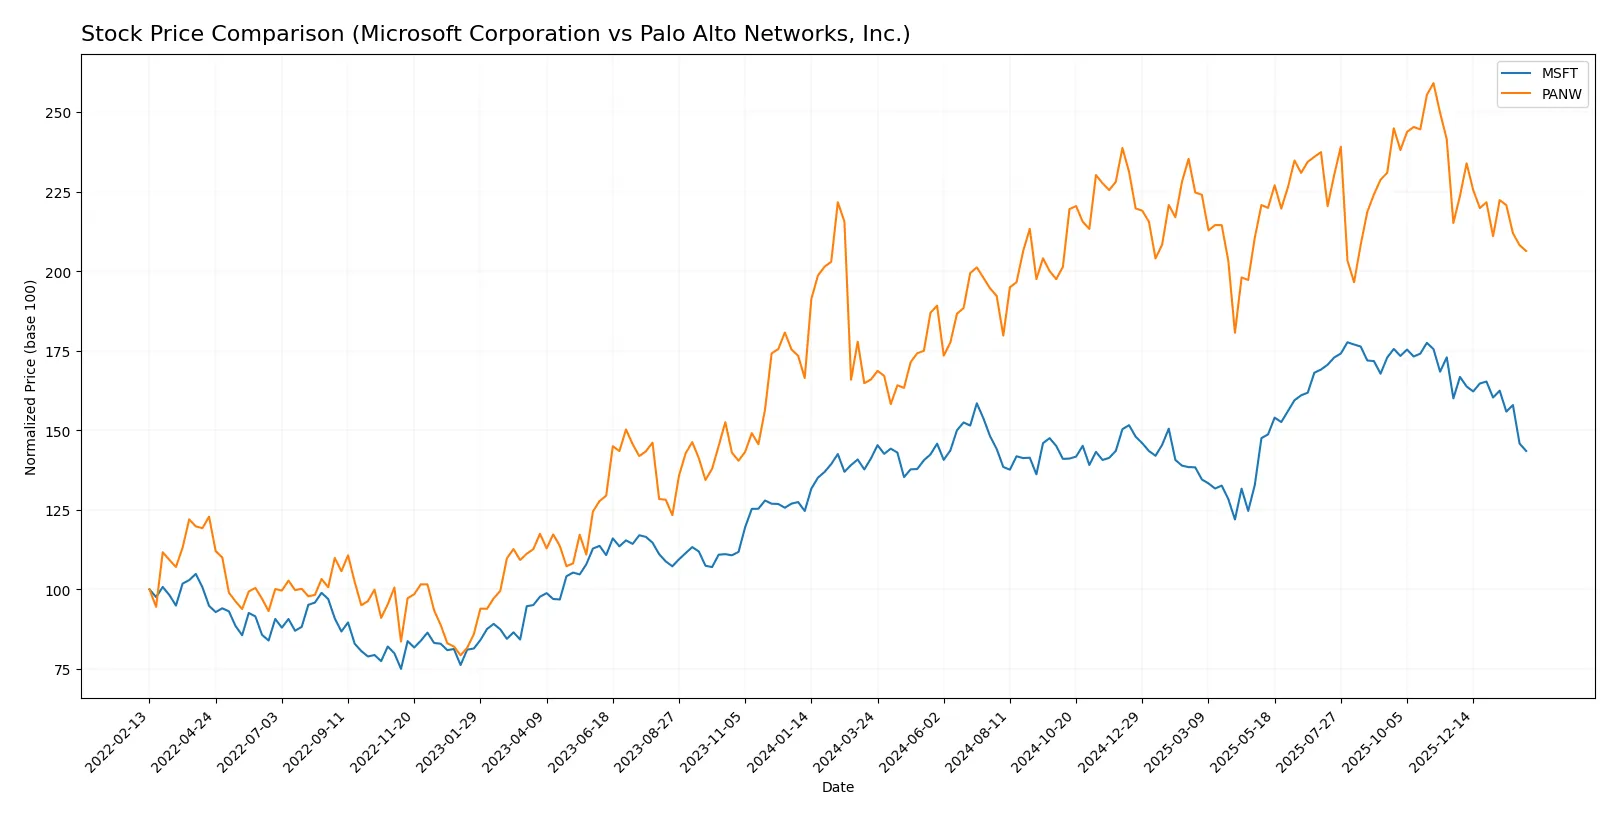
Trend Comparison
Microsoft’s stock gained 1.67% over 12 months, indicating a neutral-to-bullish trend with decelerating momentum. The price ranged between 360 and 524, showing moderate volatility (41.8 std deviation).
Palo Alto Networks outperformed with a 24.34% gain over the same period, marked by a bullish but decelerating trend. Price ranged from 135 to 220, with lower volatility (18.96 std deviation).
Comparing both, Palo Alto Networks delivered substantially higher returns despite decelerating momentum. Microsoft’s performance remained near neutral with limited upside over the year.
Target Prices
Analysts present a bullish consensus for both Microsoft Corporation and Palo Alto Networks, reflecting strong growth expectations.
| Company | Target Low | Target High | Consensus |
|---|---|---|---|
| Microsoft Corporation | 450 | 675 | 600.04 |
| Palo Alto Networks, Inc. | 157 | 265 | 231.07 |
Microsoft’s consensus target of 600 significantly exceeds its current price of 423, signaling confidence in its cloud and software dominance. Palo Alto Networks’ target consensus at 231 also outpaces its 175 price, indicating optimism in its cybersecurity leadership.

Don’t Let Luck Decide Your Entry Point
Optimize your entry points with our advanced ProRealTime indicators. You’ll get efficient buy signals with precise price targets for maximum performance. Start outperforming now!
How do institutions grade them?
The following presents institutional grades assigned to Microsoft Corporation and Palo Alto Networks, Inc.:
Microsoft Corporation Grades
Below is a summary of recent grades assigned by major financial institutions for Microsoft Corporation.
| Grading Company | Action | New Grade | Date |
|---|---|---|---|
| Citigroup | Maintain | Buy | 2026-01-30 |
| Wedbush | Maintain | Outperform | 2026-01-29 |
| Cantor Fitzgerald | Maintain | Overweight | 2026-01-29 |
| RBC Capital | Maintain | Outperform | 2026-01-29 |
| Stifel | Maintain | Buy | 2026-01-29 |
| DA Davidson | Maintain | Buy | 2026-01-29 |
| Keybanc | Maintain | Overweight | 2026-01-29 |
| Piper Sandler | Maintain | Overweight | 2026-01-29 |
| Evercore ISI Group | Maintain | Outperform | 2026-01-29 |
| Wells Fargo | Maintain | Overweight | 2026-01-29 |
Palo Alto Networks, Inc. Grades
Below is a summary of recent grades assigned by major financial institutions for Palo Alto Networks, Inc.
| Grading Company | Action | New Grade | Date |
|---|---|---|---|
| Needham | Maintain | Buy | 2026-01-28 |
| UBS | Maintain | Neutral | 2026-01-13 |
| Guggenheim | Upgrade | Neutral | 2026-01-05 |
| Piper Sandler | Maintain | Overweight | 2026-01-05 |
| Morgan Stanley | Maintain | Overweight | 2025-12-18 |
| HSBC | Downgrade | Reduce | 2025-11-21 |
| Goldman Sachs | Maintain | Buy | 2025-11-21 |
| Needham | Maintain | Buy | 2025-11-20 |
| Oppenheimer | Maintain | Outperform | 2025-11-20 |
| UBS | Maintain | Neutral | 2025-11-20 |
Which company has the best grades?
Microsoft consistently receives strong grades such as Buy, Outperform, and Overweight from multiple reputable firms. Palo Alto Networks shows more mixed ratings, ranging from Buy and Overweight to Neutral and Reduce. This divergence suggests investors may view Microsoft as a more uniformly favored option, potentially indicating greater institutional confidence.
Risks specific to each company
The following categories identify the critical pressure points and systemic threats facing both firms in the 2026 market environment:
1. Market & Competition
Microsoft Corporation
- Dominates broad software sectors with strong cloud and productivity moats. Faces intense competition from tech giants and cloud providers.
Palo Alto Networks, Inc.
- Operates in a highly competitive cybersecurity market with rapid innovation. Smaller scale than MSFT limits market reach.
2. Capital Structure & Debt
Microsoft Corporation
- Maintains low debt-to-equity (0.18) and strong interest coverage (52.8x), showing solid financial stability.
Palo Alto Networks, Inc.
- Very low debt level (D/E 0.04) and exceptional interest coverage (532x), signaling conservative leverage use.
3. Stock Volatility
Microsoft Corporation
- Beta of 1.08 indicates market-level volatility, typical for large tech names.
Palo Alto Networks, Inc.
- Lower beta of 0.75 suggests less sensitivity to market swings despite higher P/E volatility risk.
4. Regulatory & Legal
Microsoft Corporation
- Subject to antitrust scrutiny and privacy regulations globally, a persistent risk for dominant platforms.
Palo Alto Networks, Inc.
- Faces cybersecurity-specific regulations and compliance risks, especially with government clients.
5. Supply Chain & Operations
Microsoft Corporation
- Complex global hardware and software supply chains expose it to geopolitical and logistical disruptions.
Palo Alto Networks, Inc.
- Primarily software and virtual appliances reduce physical supply chain risks but depend on cloud infrastructure stability.
6. ESG & Climate Transition
Microsoft Corporation
- Invests heavily in sustainability programs and climate initiatives; reputational risk is material.
Palo Alto Networks, Inc.
- ESG focus growing but less mature; cybersecurity services indirectly support digital sustainability.
7. Geopolitical Exposure
Microsoft Corporation
- Significant global revenue exposure includes risks from US-China tensions and data privacy laws.
Palo Alto Networks, Inc.
- Primarily US-based but expanding globally; geopolitical risks exist in international cybersecurity contracts.
Which company shows a better risk-adjusted profile?
Microsoft’s greatest risk lies in regulatory scrutiny and global geopolitical tension impacting its vast operations. Palo Alto Networks faces its biggest threat from competitive pressures and valuation stretched by high P/E multiples. Microsoft’s diverse revenue streams and stronger balance sheet underpin a more balanced risk-adjusted profile. Recent regulatory actions against Big Tech validate caution around MSFT, but its Altman Z-score of 9.7 confirms strong financial resilience. Palo Alto’s lower liquidity ratios and higher valuation multiples increase its vulnerability despite solid operational niche.
Final Verdict: Which stock to choose?
Microsoft Corporation’s superpower lies in its unparalleled scale and efficiency, generating robust cash flows that fuel innovation and shareholder returns. Its point of vigilance is a high valuation multiple, which demands continued growth to justify premium pricing. It suits portfolios seeking steady, long-term growth with moderate risk tolerance.
Palo Alto Networks, Inc. commands a strategic moat through its cloud security dominance and recurring revenue model, offering resilience in a fast-evolving cyber landscape. Despite a weaker liquidity profile versus Microsoft, it presents a dynamic growth story with improving profitability, fitting well for investors favoring growth at a reasonable price.
If you prioritize proven value creation and consistent cash generation, Microsoft outshines with its established moat and financial strength. However, if you seek aggressive growth fueled by expanding market share and improving returns, Palo Alto Networks offers better upside potential despite higher risk. Both scenarios require close attention to valuation and market cycles.
Disclaimer: Investment carries a risk of loss of initial capital. The past performance is not a reliable indicator of future results. Be sure to understand risks before making an investment decision.
Go Further
I encourage you to read the complete analyses of Microsoft Corporation and Palo Alto Networks, Inc. to enhance your investment decisions: