Home > Comparison > Technology > MSFT vs PLTR
The strategic rivalry between Microsoft Corporation and Palantir Technologies defines the current trajectory of the technology sector. Microsoft operates as a diversified software infrastructure powerhouse with extensive cloud and productivity offerings. Palantir is a specialized software platform leader focused on data integration and intelligence solutions. This analysis evaluates which model—broad-based dominance or niche innovation—offers the superior risk-adjusted return for a diversified technology portfolio.
Table of contents
Companies Overview
Microsoft Corporation and Palantir Technologies Inc. shape the cutting edge of the software infrastructure landscape in 2026.
Microsoft Corporation: Global Software and Cloud Powerhouse
Microsoft stands as a technology giant with a diversified software and cloud portfolio. It generates revenue through three core segments: Productivity and Business Processes, Intelligent Cloud, and More Personal Computing. In 2026, Microsoft sharpens its strategic focus on expanding Azure cloud services and embedding AI across enterprise solutions, reinforcing its competitive advantage in cloud computing and productivity ecosystems.
Palantir Technologies Inc.: Data-Driven Intelligence Innovator
Palantir specializes in software platforms for intelligence and data analytics. Its revenue engine centers on Palantir Gotham, Foundry, Apollo, and AI Platform, which enable complex data integration and operational decision-making. In 2026, Palantir emphasizes AI-driven analytics and flexible software deployment, aiming to deepen its footprint in government and commercial sectors with cutting-edge AI capabilities.
Strategic Collision: Similarities & Divergences
Both companies lead in software infrastructure but diverge in business philosophy: Microsoft favors a broad cloud and productivity ecosystem, while Palantir pursues a specialized, data-centric intelligence niche. They compete primarily in enterprise cloud and AI services. Microsoft offers a mature, diversified investment profile; Palantir presents higher growth potential but with greater operational concentration and risk exposure.
Income Statement Comparison
The following data dissects the core profitability and scalability of both corporate engines to reveal who dominates the bottom line:
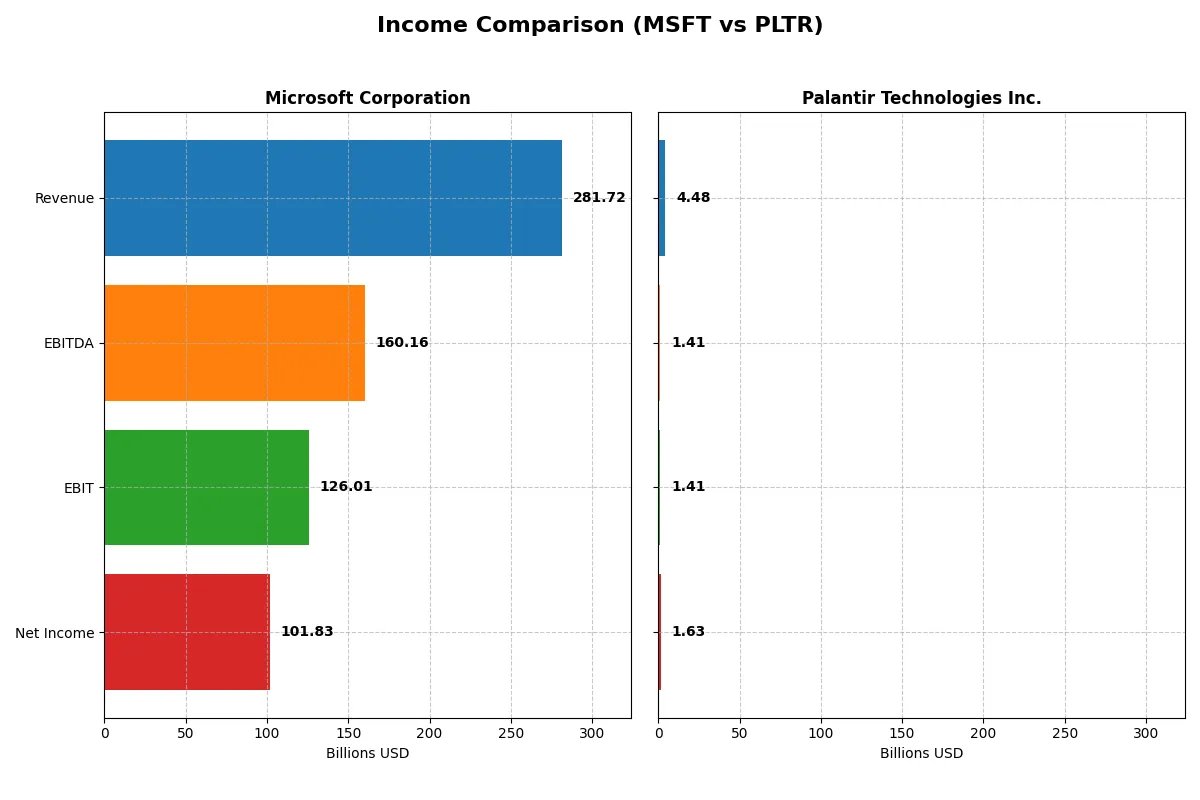
| Metric | Microsoft Corporation (MSFT) | Palantir Technologies Inc. (PLTR) |
|---|---|---|
| Revenue | 282B | 4.48B |
| Cost of Revenue | 87.8B | 789M |
| Operating Expenses | 65.4B | 2.27B |
| Gross Profit | 194B | 3.69B |
| EBITDA | 160B | 1.41B |
| EBIT | 126B | 1.41B |
| Interest Expense | 2.39B | 0 |
| Net Income | 102B | 1.63B |
| EPS | 13.7 | 0.69 |
| Fiscal Year | 2025 | 2025 |
Income Statement Analysis: The Bottom-Line Duel
This income statement comparison reveals which company operates its business more efficiently and delivers stronger profitability momentum.
Microsoft Corporation Analysis
Microsoft’s revenue surged from $168B in 2021 to $282B in 2025, with net income rising from $61B to $102B. Its gross margin remains robust near 69%, while net margin hovers around 36%, signaling solid profitability. In 2025, Microsoft sustains momentum with a 14.9% revenue growth and a stable net margin, reflecting disciplined cost management and operational efficiency.
Palantir Technologies Inc. Analysis
Palantir’s revenue climbed impressively from $1.5B in 2021 to $4.5B in 2025, with net income reversing losses to $1.6B profit. Gross margin expanded to 82%, and net margin improved to roughly 36%. The latest year shows explosive 56% revenue growth and a 125% net margin increase, underscoring rapid scaling and improved cost control despite its smaller scale compared to Microsoft.
Scale and Momentum: Established Giant vs. High-Growth Challenger
Microsoft commands a dominant scale with steady, efficient growth and strong margins, while Palantir delivers far higher growth rates and margin expansion from a smaller base. Microsoft’s consistency offers reliability; Palantir’s dynamic profile appeals to growth-focused investors. The fundamental winner depends on investor preference for scale stability or aggressive expansion potential.
Financial Ratios Comparison
These vital ratios act as a diagnostic tool to expose the underlying fiscal health, valuation premiums, and capital efficiency of the companies compared below:
| Ratios | Microsoft Corporation (MSFT) | Palantir Technologies Inc. (PLTR) |
|---|---|---|
| ROE | 29.6% | 9.2% |
| ROIC | 22.0% | 5.5% |
| P/E | 36.3 | 368.2 |
| P/B | 10.8 | 34.0 |
| Current Ratio | 1.35 | 5.96 |
| Quick Ratio | 1.35 | 5.96 |
| D/E (Debt-to-Equity) | 0.18 | 0.05 |
| Debt-to-Assets | 9.8% | 3.8% |
| Interest Coverage | 53.9 | 0 |
| Asset Turnover | 0.46 | 0.45 |
| Fixed Asset Turnover | 1.23 | 11.9 |
| Payout ratio | 23.6% | 0 |
| Dividend yield | 0.65% | 0 |
| Fiscal Year | 2025 | 2024 |
Efficiency & Valuation Duel: The Vital Signs
Ratios act as a company’s DNA, revealing hidden risks and operational excellence critical for informed investment decisions.
Microsoft Corporation
Microsoft demonstrates robust profitability with a 29.65% ROE and a commanding 36.15% net margin, reflecting operational efficiency. However, its valuation appears stretched, marked by a high 36.31 P/E and a 10.76 P/B ratio. Shareholders receive modest 0.65% dividends, while significant reinvestment in R&D sustains growth and competitive advantage.
Palantir Technologies Inc.
Palantir shows moderate profitability with a 9.24% ROE and 16.13% net margin but suffers from an extremely high 368.2 P/E and 34.01 P/B, signaling a richly priced stock. It pays no dividends, focusing heavily on growth through R&D and maintaining a strong liquidity position with a 5.96 current ratio, despite some operational inefficiencies.
Premium Valuation vs. Operational Safety
Microsoft offers a better balance of profitability and operational discipline, though at a premium valuation. Palantir’s high multiples and weaker returns elevate its risk profile. Investors seeking steady returns may favor Microsoft’s profile, while growth-oriented investors might tolerate Palantir’s stretched metrics.
Which one offers the Superior Shareholder Reward?
I compare Microsoft’s disciplined dividend payout averaging 24% with a 0.65% yield, supported by strong FCF coverage above 1.5x. Microsoft combines steady dividends with aggressive buybacks fueling shareholder returns. Palantir pays no dividends, reinvesting heavily in growth and R&D. Its free cash flow covers buybacks minimally, risking sustainability. Microsoft’s balanced distribution and robust cash flow promise a superior long-term total return in 2026. Palantir’s growth focus appeals but lacks immediate shareholder reward and dividend safety, making Microsoft the wiser choice for total return investors now.
Comparative Score Analysis: The Strategic Profile
The radar chart reveals the fundamental DNA and trade-offs of Microsoft Corporation and Palantir Technologies Inc.:
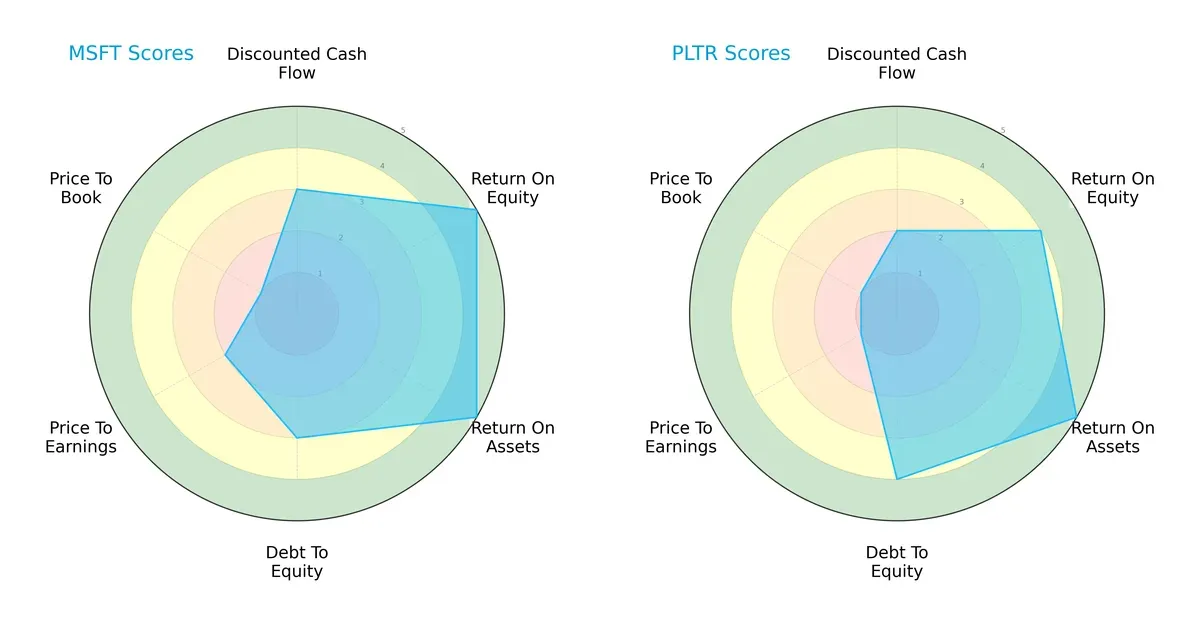
Microsoft dominates in return on equity and assets, scoring very favorably at 5 in both metrics, compared to Palantir’s 4 and 5 respectively. Palantir holds a slight edge in debt-to-equity with a 4 versus Microsoft’s 3, indicating better leverage management. Both firms share moderate discounted cash flow scores, but Microsoft’s valuation metrics lag, especially in price-to-book at 1, showing a potential overvaluation risk. Overall, Microsoft displays a more balanced profile, while Palantir leans on financial stability as its core strength.
Bankruptcy Risk: Solvency Showdown
Microsoft and Palantir both reside firmly in the safe zone on the Altman Z-Score scale:
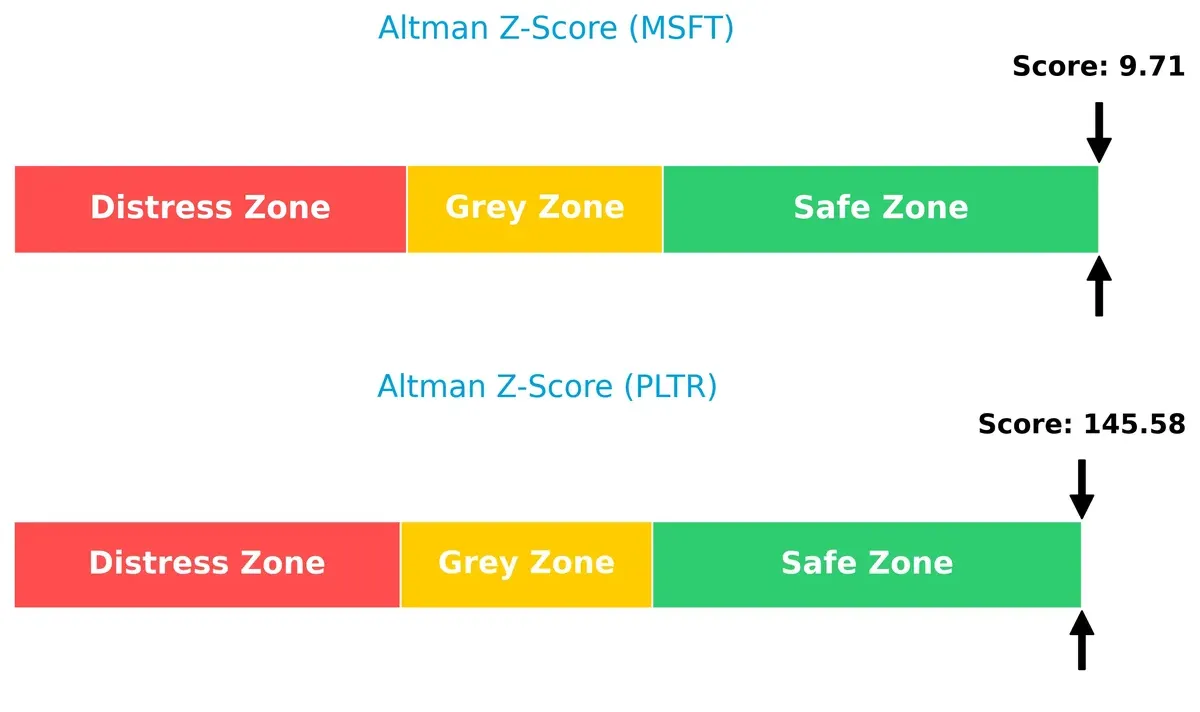
Palantir’s score of 146 vastly outpaces Microsoft’s 9.7, signaling an exceptionally lower bankruptcy risk. This suggests Palantir’s balance sheet is exceptionally robust in the current cycle, providing greater long-term survival assurance.
Financial Health: Quality of Operations
Both companies score a strong 7 on the Piotroski F-Score, reflecting solid financial health and operational quality:
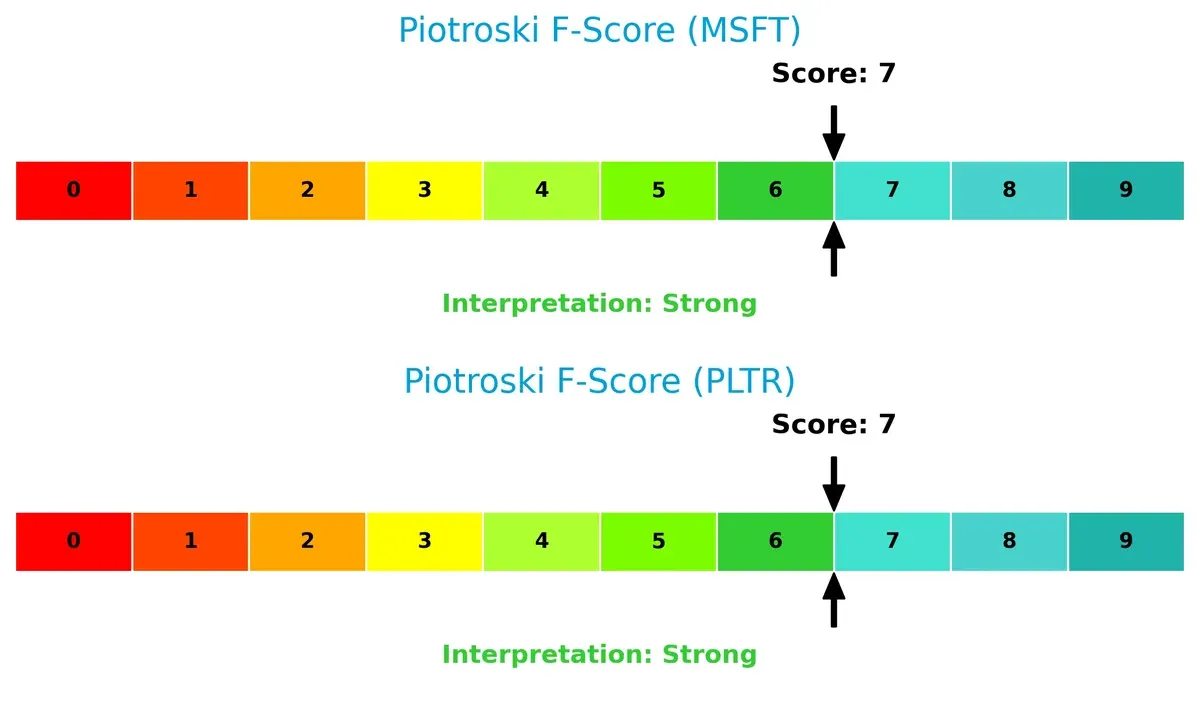
Neither firm shows red flags in internal metrics, indicating effective profitability, liquidity, and efficiency measures. Investors can consider both companies as financially sound based on this metric.
How are the two companies positioned?
This section dissects the operational DNA of Microsoft and Palantir by comparing their revenue distribution by segment and internal dynamics. The goal is to confront their economic moats and identify which business model offers the most resilient competitive advantage today.
Revenue Segmentation: The Strategic Mix
This comparison dissects how Microsoft Corporation and Palantir Technologies diversify their income streams and reveals their primary sector bets:
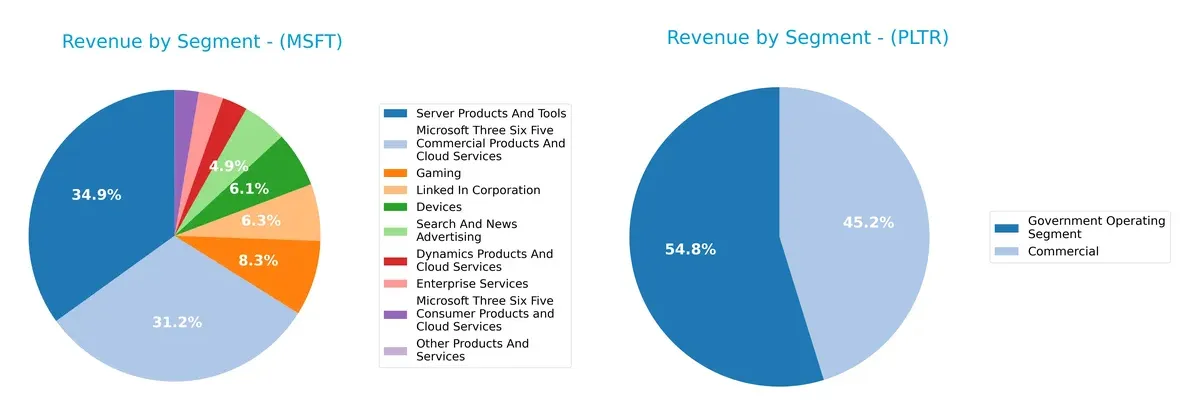
Microsoft dominates with a highly diversified revenue base spanning Server Products ($98.4B), Microsoft 365 ($87.8B), Gaming ($23.5B), and Devices ($17.3B). Palantir relies heavily on Government contracts ($1.57B) with a smaller Commercial segment ($1.30B). Microsoft’s broad ecosystem reduces concentration risk and fuels infrastructure dominance. Palantir’s focus on government projects anchors its revenue but poses risks if public spending shifts.
Strengths and Weaknesses Comparison
This table compares the Strengths and Weaknesses of Microsoft Corporation and Palantir Technologies Inc.:
Microsoft Corporation Strengths
- Highly diversified product segments including cloud, gaming, and enterprise services
- Strong profitability with 36.15% net margin and 29.65% ROE
- Favorable leverage metrics with low debt-to-assets at 9.79%
- Global presence with balanced US and non-US revenues over 140B USD each
- Innovation backed by multiple cloud platforms and software suites
- Large market share in server products and cloud services
Palantir Technologies Inc. Strengths
- Favorable net margin at 16.13% and strong interest coverage
- Very high fixed asset turnover at 11.92 indicating asset efficiency
- Favorable low debt-to-assets ratio at 3.77% and minimal leverage
- Growing commercial and government revenues with US dominance
- Favorable quick ratio at 5.96 suggests strong liquidity
- Focused innovation on government and commercial data analytics
Microsoft Corporation Weaknesses
- Unfavorable high PE at 36.31 and PB at 10.76 indicating valuation risk
- Asset turnover at 0.46 is low for efficiency
- Dividend yield low at 0.65%
- Moderate current ratio at 1.35 limits liquidity cushion
- Some product segments like advertising show slower growth
- High valuation multiples increase downside risk
Palantir Technologies Inc. Weaknesses
- Unfavorable high PE at 368.2 and PB at 34.01 raise valuation concerns
- ROE at 9.24% is weak relative to cost of capital
- Unfavorable current ratio at 5.96 may reflect working capital inefficiency
- No dividend yield reduces income appeal
- Neutral ROIC at 5.51% suggests limited capital efficiency
- Smaller global footprint with concentrated US revenue
Microsoft’s strengths lie in diversified revenue streams and strong profitability, supporting a broad competitive moat. Palantir excels in asset efficiency and niche innovation but faces significant valuation and profitability challenges. These contrasts shape their strategic priorities in growth and capital allocation.
The Moat Duel: Analyzing Competitive Defensibility
A structural moat shields long-term profits from competitive erosion. Without it, market share and margins erode swiftly. Let’s dissect two key players’ moats:
Microsoft Corporation: Ecosystem Lock-In Powerhouse
Microsoft leverages a vast ecosystem with high switching costs across productivity, cloud, and software infrastructure. This manifests in a strong 13% ROIC premium over WACC, though slightly declining. Azure expansion and AI integration could deepen this moat in 2026.
Palantir Technologies Inc.: Data-Driven Network Effects
Palantir’s moat stems from proprietary data analytics platforms creating network effects among government and enterprise clients. Unlike Microsoft, Palantir’s ROIC data is limited, but its 110% ROIC growth trend signals rising capital efficiency. Expansion into AI-powered solutions fuels future moat potential.
Ecosystem Lock-In vs. Network Effects: The Structural Moat Showdown
Microsoft wields a wider moat, proven by consistent value creation despite modest ROIC decline. Palantir’s accelerating ROIC growth suggests a strengthening moat but lacks long-term scale. Microsoft remains better equipped to defend market share amid intensifying competition.
Which stock offers better returns?
Over the past 12 months, both Microsoft Corporation and Palantir Technologies Inc. showed distinct price movements and trading dynamics, with Palantir displaying significant gains and Microsoft a more modest increase.
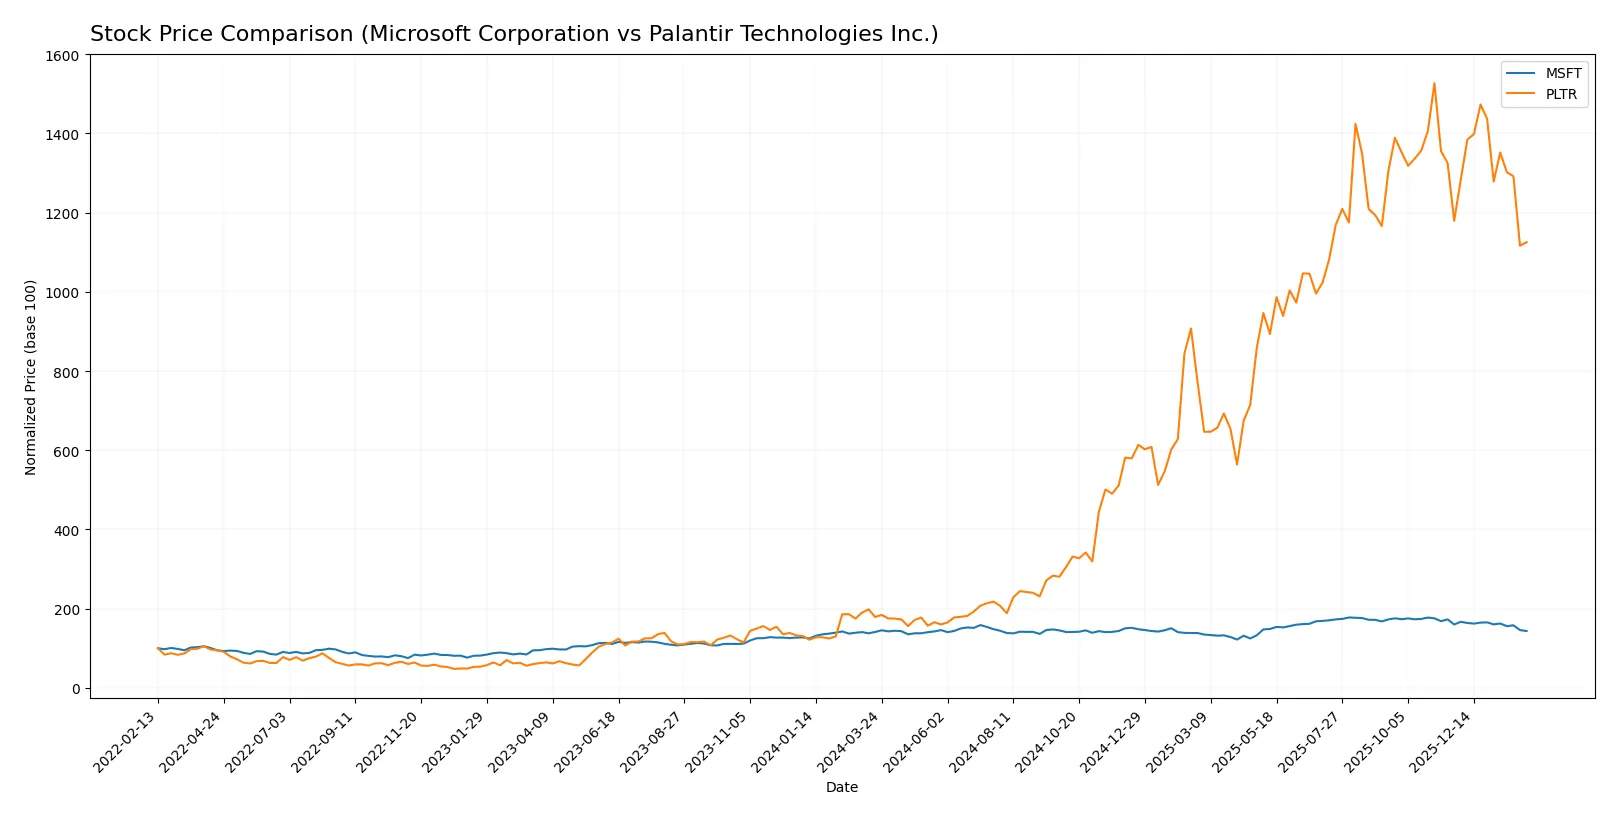
Trend Comparison
Microsoft’s stock rose 1.67% over the last year, indicating a neutral to mild bullish trend with decelerating momentum; it peaked at 524.11 and hit a low of 359.84.
Palantir surged 529.03%, marking a strong bullish trend with decelerating acceleration; its price ranged from 20.47 to a high of 200.47 during the same period.
Palantir delivered substantially higher returns than Microsoft, outperforming it by over 500% in market performance over the last 12 months.
Target Prices
Analysts present optimistic target price consensus for Microsoft Corporation and Palantir Technologies Inc.
| Company | Target Low | Target High | Consensus |
|---|---|---|---|
| Microsoft Corporation | 450 | 675 | 600.04 |
| Palantir Technologies Inc. | 160 | 230 | 201.31 |
Microsoft’s consensus target price of 600 suggests a 42% upside from the current 423.37 stock price. Palantir’s target consensus at 201 implies a 36% gain from today’s 147.76 price.

Don’t Let Luck Decide Your Entry Point
Optimize your entry points with our advanced ProRealTime indicators. You’ll get efficient buy signals with precise price targets for maximum performance. Start outperforming now!
How do institutions grade them?
Here is a summary of the latest institutional grades for Microsoft Corporation and Palantir Technologies Inc.:
Microsoft Corporation Grades
The table below shows recent grades from major investment firms for Microsoft:
| Grading Company | Action | New Grade | Date |
|---|---|---|---|
| Citigroup | Maintain | Buy | 2026-01-30 |
| Wedbush | Maintain | Outperform | 2026-01-29 |
| Cantor Fitzgerald | Maintain | Overweight | 2026-01-29 |
| RBC Capital | Maintain | Outperform | 2026-01-29 |
| Stifel | Maintain | Buy | 2026-01-29 |
| DA Davidson | Maintain | Buy | 2026-01-29 |
| Keybanc | Maintain | Overweight | 2026-01-29 |
| Piper Sandler | Maintain | Overweight | 2026-01-29 |
| Evercore ISI Group | Maintain | Outperform | 2026-01-29 |
| Wells Fargo | Maintain | Overweight | 2026-01-29 |
Palantir Technologies Inc. Grades
The recent institutional grades for Palantir are summarized in the table below:
| Grading Company | Action | New Grade | Date |
|---|---|---|---|
| Citigroup | Upgrade | Buy | 2026-01-12 |
| RBC Capital | Maintain | Underperform | 2025-11-04 |
| Baird | Maintain | Neutral | 2025-11-04 |
| Mizuho | Maintain | Neutral | 2025-11-04 |
| UBS | Maintain | Neutral | 2025-11-04 |
| Goldman Sachs | Maintain | Neutral | 2025-11-04 |
| Morgan Stanley | Maintain | Equal Weight | 2025-11-04 |
| Cantor Fitzgerald | Maintain | Neutral | 2025-11-04 |
| B of A Securities | Maintain | Buy | 2025-11-04 |
| Piper Sandler | Maintain | Overweight | 2025-11-04 |
Which company has the best grades?
Microsoft consistently receives positive grades, primarily “Buy,” “Outperform,” and “Overweight,” all maintained recently. Palantir’s grades are mixed, with mostly “Neutral” ratings and only a few “Buy” or better grades. This suggests Microsoft holds stronger analyst confidence, potentially influencing investor sentiment positively.
Risks specific to each company
The following categories identify the critical pressure points and systemic threats facing both firms in the 2026 market environment:
1. Market & Competition
Microsoft Corporation
- Dominates with diversified software and cloud offerings, facing intense competition in cloud and AI sectors.
Palantir Technologies Inc.
- Focuses on niche government and commercial analytics, but faces scaling challenges and growing competition in AI platforms.
2. Capital Structure & Debt
Microsoft Corporation
- Maintains a low debt-to-equity ratio (0.18) and strong interest coverage, signaling conservative leverage.
Palantir Technologies Inc.
- Exhibits even lower debt (0.05 D/E) and infinite interest coverage, reflecting minimal financial risk on debt.
3. Stock Volatility
Microsoft Corporation
- Beta near market average (1.08), implying moderate volatility in line with tech sector.
Palantir Technologies Inc.
- Higher beta (1.69) suggests greater stock price volatility and risk exposure.
4. Regulatory & Legal
Microsoft Corporation
- Faces antitrust scrutiny in multiple jurisdictions due to market dominance.
Palantir Technologies Inc.
- Operates in sensitive government and intelligence sectors, increasing regulatory and compliance risks.
5. Supply Chain & Operations
Microsoft Corporation
- Large global operations with diversified supply chains; some risks in hardware and cloud infrastructure.
Palantir Technologies Inc.
- Software-centric with lower physical supply chain exposure but dependent on stable data infrastructure.
6. ESG & Climate Transition
Microsoft Corporation
- Committed to carbon neutrality and strong ESG initiatives, enhancing reputation and regulatory compliance.
Palantir Technologies Inc.
- Emerging ESG focus; less mature but increasing attention due to government contracts and data privacy concerns.
7. Geopolitical Exposure
Microsoft Corporation
- Global footprint exposes it to risks from US-China tensions and international regulations.
Palantir Technologies Inc.
- Heavy reliance on US and allied government contracts concentrates geopolitical risk in defense and intelligence sectors.
Which company shows a better risk-adjusted profile?
Microsoft faces significant antitrust and geopolitical risks but benefits from strong financial stability and moderate volatility. Palantir’s key risks stem from regulatory sensitivity and higher stock volatility despite minimal leverage. The most impactful risk for Microsoft is regulatory pressure, while Palantir’s is elevated market volatility. Microsoft’s robust Altman Z-Score (9.7) and conservative debt profile confirm a better risk-adjusted position. Palantir’s soaring P/E (368x) flags high valuation risk, justifying caution despite its strong operating niche.
Final Verdict: Which stock to choose?
Microsoft’s superpower lies in its unmatched ability to generate consistent economic value with a robust moat. Its scale and diverse ecosystem fuel steady cash flows. A point of vigilance remains its premium valuation multiples, which could limit upside. It suits investors targeting resilient, large-cap growth with moderate risk tolerance.
Palantir’s strength is its strategic moat built on specialized data analytics and high-margin recurring contracts. It offers a more aggressive growth profile with expanding margins and a rapidly improving ROIC trend. Relative to Microsoft, it carries higher execution risk but greater upside potential. It fits growth-at-a-reasonable-price (GARP) or thematic growth portfolios.
If you prioritize stable value creation and proven scale, Microsoft is the compelling choice due to its durable economic moat and consistent free cash flow. However, if you seek rapid growth with an improving capital efficiency trajectory, Palantir offers superior upside potential despite higher volatility. Both reflect distinct investor profiles and risk appetites.
Disclaimer: Investment carries a risk of loss of initial capital. The past performance is not a reliable indicator of future results. Be sure to understand risks before making an investment decision.
Go Further
I encourage you to read the complete analyses of Microsoft Corporation and Palantir Technologies Inc. to enhance your investment decisions: