Home > Comparison > Technology > MSFT vs ORCL
The strategic rivalry between Microsoft Corporation and Oracle Corporation defines the current trajectory of the software infrastructure sector. Microsoft operates as a diversified technology powerhouse with expansive cloud, productivity, and hardware segments. Oracle focuses on enterprise software and cloud applications with a specialized infrastructure emphasis. This analysis will explore which company’s operational model and capital allocation strategy offer a superior risk-adjusted return for a diversified portfolio in today’s competitive landscape.
Table of contents
Companies Overview
Microsoft Corporation and Oracle Corporation stand as titans in the global software infrastructure market, shaping enterprise technology.
Microsoft Corporation: Cloud and Productivity Powerhouse
Microsoft dominates with its diversified software ecosystem spanning Productivity and Business Processes, Intelligent Cloud, and More Personal Computing segments. Its revenue engine thrives on cloud services like Azure, Office 365 subscriptions, and enterprise software licensing. In 2026, Microsoft sharpens its focus on expanding cloud infrastructure and AI integration to bolster its competitive edge.
Oracle Corporation: Enterprise Cloud and Database Specialist
Oracle excels as a leader in enterprise IT with a stronghold in cloud software applications and database technologies. Its core revenue derives from Oracle Fusion cloud ERP, autonomous databases, and infrastructure technologies. In 2026, Oracle intensifies its strategic push into cloud-based industry solutions and autonomous database offerings to capture enterprise digital transformation demand.
Strategic Collision: Similarities & Divergences
Both firms compete fiercely in cloud infrastructure but adopt distinct philosophies. Microsoft pursues a broad platform strategy emphasizing integration across productivity and cloud, while Oracle focuses on specialized enterprise applications and database automation. The primary battleground is enterprise cloud adoption. Their investment profiles diverge: Microsoft offers diversified growth across multiple segments; Oracle presents a concentrated play on cloud enterprise software innovation.
Income Statement Comparison
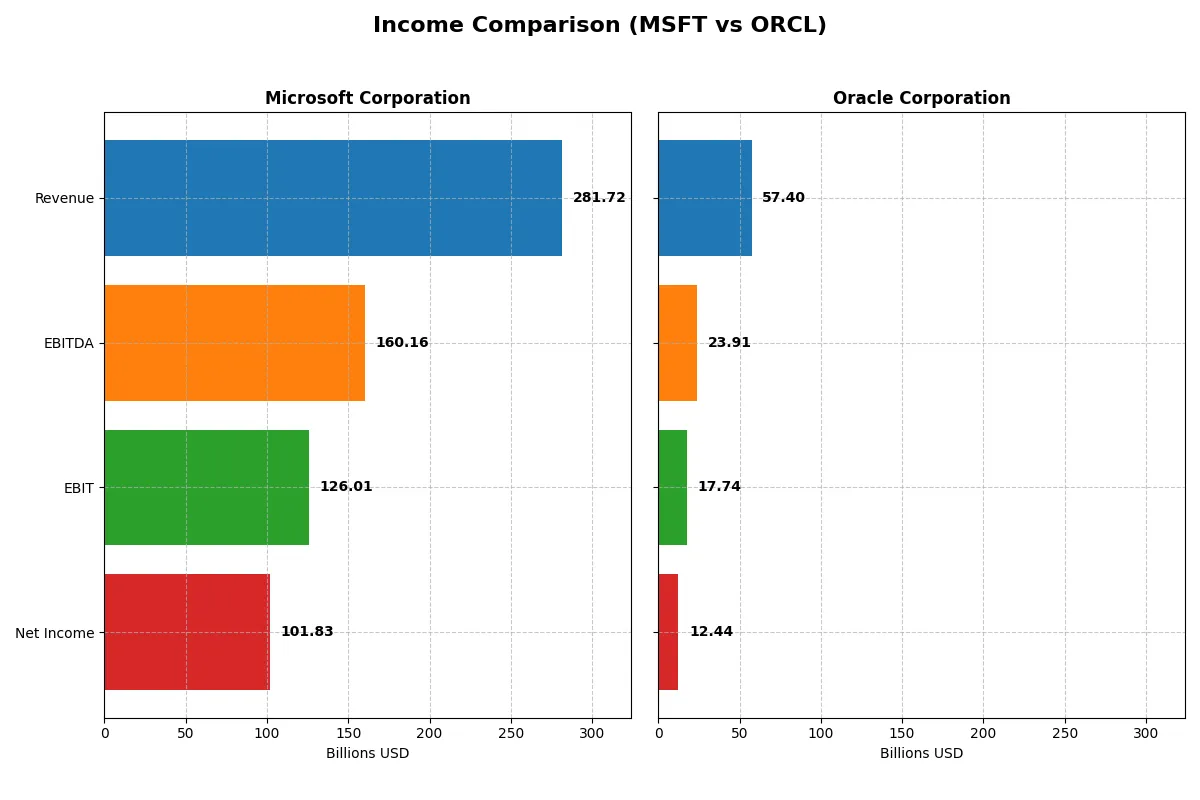
The following data dissects the core profitability and scalability of both corporate engines to reveal who dominates the bottom line:
| Metric | Microsoft Corporation (MSFT) | Oracle Corporation (ORCL) |
|---|---|---|
| Revenue | 282B | 57.4B |
| Cost of Revenue | 87.8B | 16.9B |
| Operating Expenses | 65.4B | 22.8B |
| Gross Profit | 194B | 40.5B |
| EBITDA | 160.2B | 23.9B |
| EBIT | 126B | 17.7B |
| Interest Expense | 2.39B | 3.58B |
| Net Income | 101.8B | 12.4B |
| EPS | 13.7 | 4.46 |
| Fiscal Year | 2025 | 2025 |
Income Statement Analysis: The Bottom-Line Duel
The income statement comparison reveals how each company converts revenue into profit, exposing their operational efficiency and growth momentum.
Microsoft Corporation Analysis
Microsoft’s revenue surged from $168B in 2021 to $282B in 2025, with net income rising from $61B to $102B. Its gross margin remains robust at 68.8%, while net margin holds a strong 36.1%. The 2025 fiscal year shows solid momentum, with a 14.9% revenue jump and a healthy 13.8% EBIT growth, reflecting operational efficiency.
Oracle Corporation Analysis
Oracle’s revenue climbed steadily from $40B in 2021 to $57B in 2025, while net income fluctuated, declining to $12.4B in 2025 from $13.7B in 2021. The company boasts a higher gross margin at 70.5%, but net margin at 21.7% trails Microsoft’s. Oracle’s 2025 results show 8.4% revenue growth and a stronger 16.3% EBIT increase, signaling improving operating leverage.
Margin Power vs. Revenue Scale
Microsoft dominates with superior net margins and consistent double-digit revenue and profit growth, driving substantial bottom-line expansion. Oracle offers higher gross margins but struggles with net income growth, showing mixed margin trends. For investors, Microsoft’s blend of scale and efficiency presents a more compelling income statement profile.
Financial Ratios Comparison
These vital ratios act as a diagnostic tool to expose the underlying fiscal health, valuation premiums, and capital efficiency of the companies compared below:
| Ratios | Microsoft Corporation (MSFT) | Oracle Corporation (ORCL) |
|---|---|---|
| ROE | 29.65% | 60.84% |
| ROIC | 22.02% | 10.86% |
| P/E | 36.31 | 37.10 |
| P/B | 10.76 | 22.57 |
| Current Ratio | 1.35 | 0.75 |
| Quick Ratio | 1.35 | 0.75 |
| D/E | 0.18 | 5.09 |
| Debt-to-Assets | 9.79% | 61.83% |
| Interest Coverage | 53.89 | 4.94 |
| Asset Turnover | 0.46 | 0.34 |
| Fixed Asset Turnover | 1.23 | 1.32 |
| Payout Ratio | 23.65% | 38.12% |
| Dividend Yield | 0.65% | 1.03% |
| Fiscal Year | 2025 | 2025 |
Efficiency & Valuation Duel: The Vital Signs
Financial ratios serve as a company’s DNA, exposing hidden risks and revealing operational strength and valuation nuances.
Microsoft Corporation
Microsoft delivers robust profitability with a 29.65% ROE and a strong 36.15% net margin, signaling operational excellence. Its valuation appears stretched, trading at a 36.3 P/E and 10.8 P/B, above typical sector norms. Shareholders see modest 0.65% dividend yield, reflecting a preference for reinvestment into R&D and growth initiatives.
Oracle Corporation
Oracle shows an impressive 60.8% ROE but a lower 21.7% net margin, indicating concentrated profitability. The stock trades expensive with a 37.1 P/E and a very high 22.6 P/B, burdened by heavy leverage and a low current ratio of 0.75. Oracle offers a 1.03% dividend yield, balancing shareholder returns with debt servicing challenges.
Premium Valuation vs. Operational Safety
Microsoft offers a balanced profile with favorable profitability, disciplined leverage, and reinvestment focus, despite elevated valuation metrics. Oracle’s high ROE contrasts with risky leverage and liquidity concerns, making it less stable. Investors prioritizing operational safety and growth may lean toward Microsoft’s profile over Oracle’s riskier debt-driven returns.
Which one offers the Superior Shareholder Reward?
I observe Microsoft offers a modest dividend yield near 0.65% with a sustainable payout ratio around 24%. Its buyback program is robust, supported by strong free cash flow of 9.6B in 2025. Oracle yields higher at 1.03%, but its payout ratio exceeds 38%, with negative free cash flow in 2025 and heavy debt leverage. Microsoft’s balanced dividend and aggressive buybacks suggest superior, sustainable total shareholder returns versus Oracle’s riskier, debt-laden distribution strategy. I therefore favor Microsoft for long-term investors in 2026.
Comparative Score Analysis: The Strategic Profile
The radar chart reveals the fundamental DNA and trade-offs of Microsoft Corporation and Oracle Corporation, highlighting their core financial strengths and vulnerabilities:
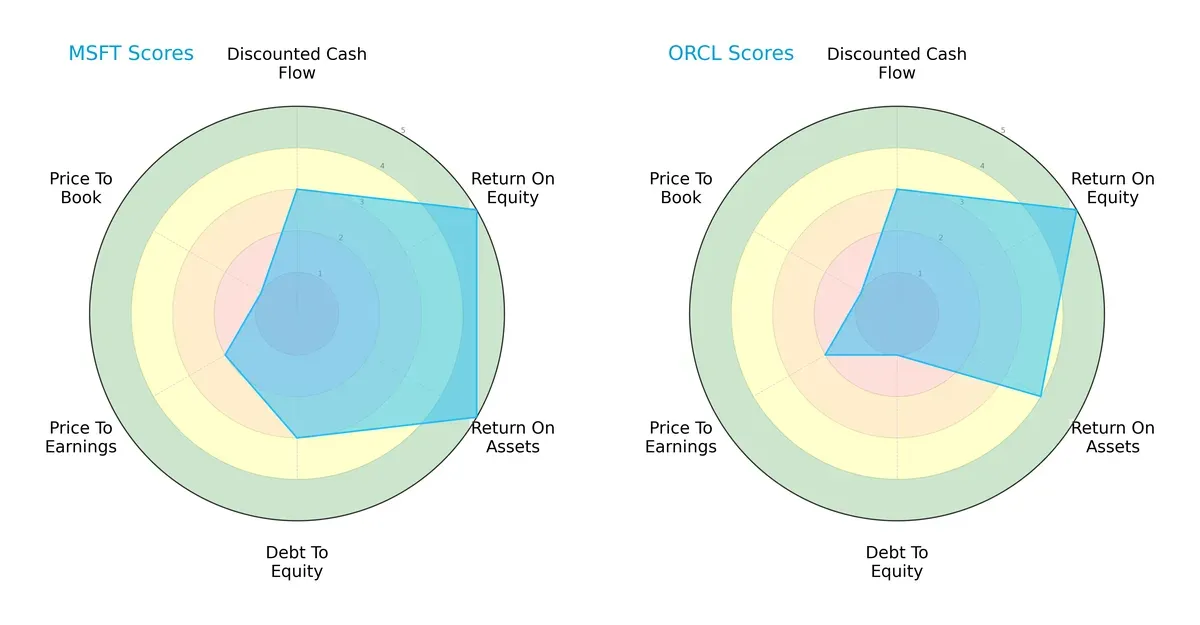
Microsoft and Oracle show comparable overall scores, but Microsoft exhibits a more balanced profile with very favorable ROE and ROA scores (5 each), indicating superior efficiency in generating profits and utilizing assets. Oracle matches Microsoft in ROE but falls short on ROA (4) and suffers a weak debt-to-equity score (1), signaling higher financial risk. Both firms share moderate DCF and P/E scores, but neither impresses on price-to-book valuation, reflecting potential overvaluation concerns. Microsoft’s moderate debt management contrasts Oracle’s riskier leverage, making Microsoft the more stable choice.
Bankruptcy Risk: Solvency Showdown
Microsoft’s Altman Z-Score of 9.7 firmly places it in the safe zone, whereas Oracle’s 2.3 lands in the grey zone, signaling moderate bankruptcy risk in this economic cycle:
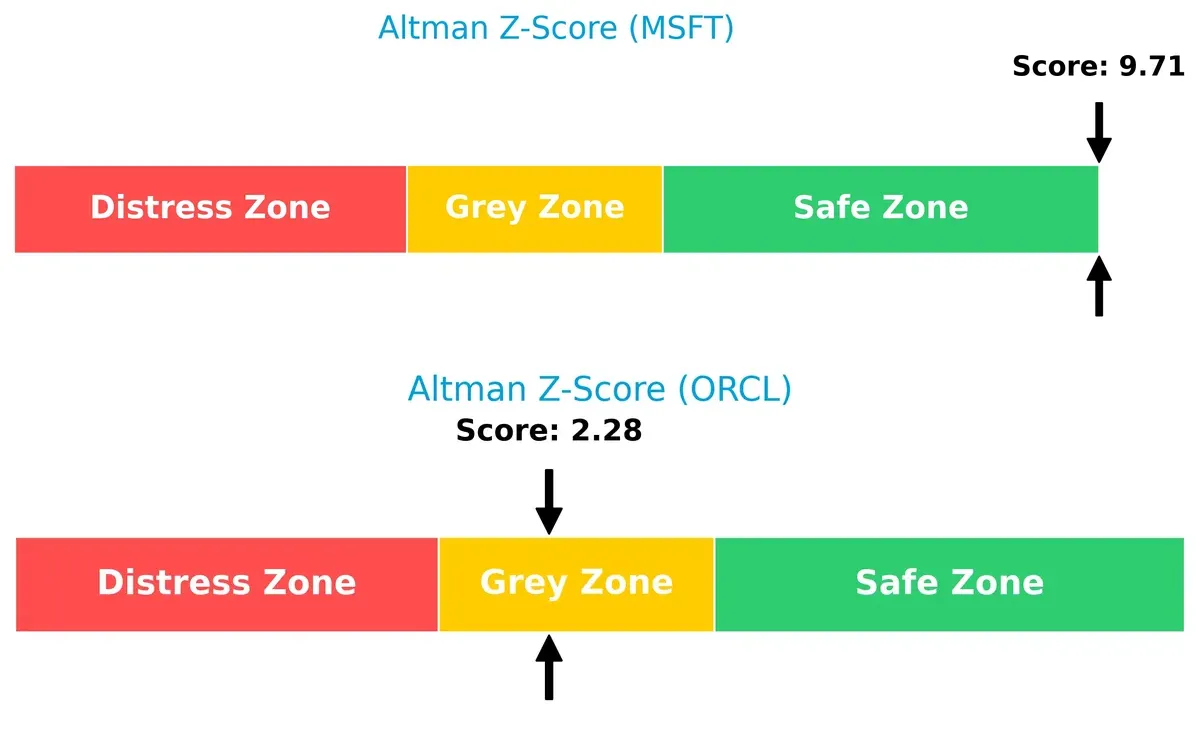
Microsoft’s robust solvency suggests strong resilience against downturns. Oracle’s borderline score warns investors to watch its financial stability carefully, especially given its higher leverage.
Financial Health: Quality of Operations
Microsoft’s Piotroski F-Score of 7 indicates strong financial health, while Oracle’s 5 suggests average operational quality with some internal red flags:
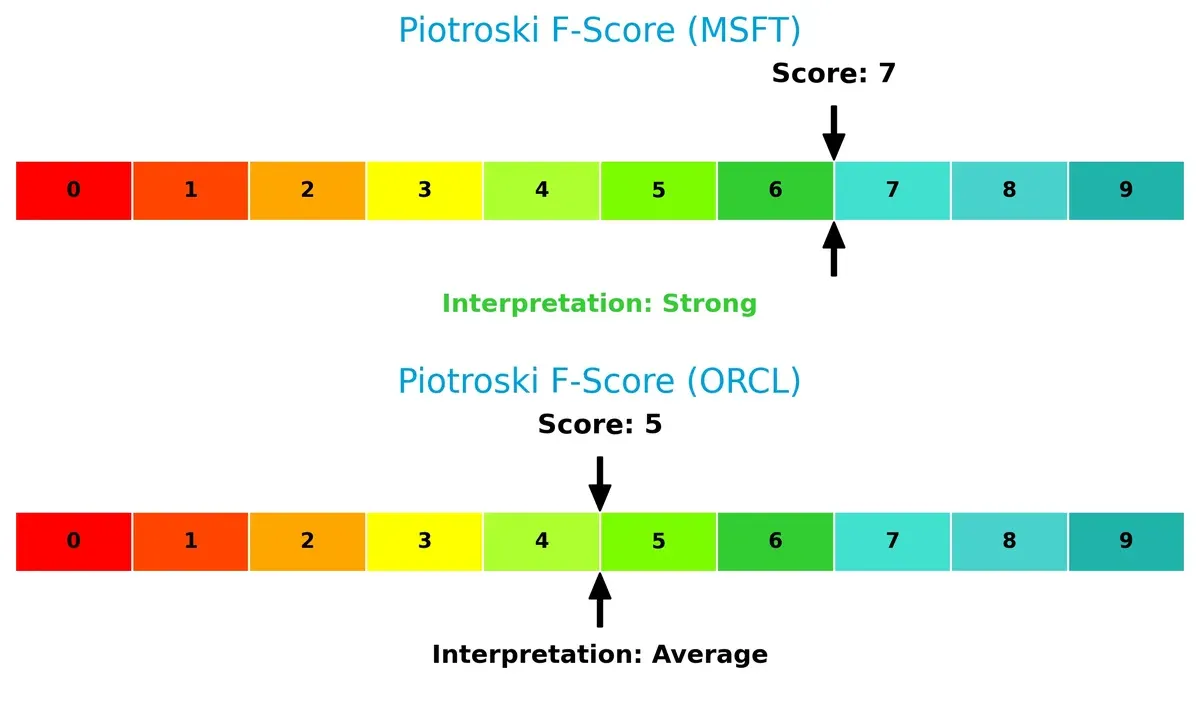
Microsoft demonstrates superior operational efficiency and profitability metrics. Oracle’s middling score flags caution, highlighting areas needing improvement to match sector leaders. Investors should favor firms with higher Piotroski scores to avoid hidden financial weaknesses.
How are the two companies positioned?
This section dissects Microsoft and Oracle’s operational DNA by comparing revenue distribution and internal strengths and weaknesses. The goal is to confront their economic moats and identify which model offers the most resilient competitive advantage today.
Revenue Segmentation: The Strategic Mix
This comparison dissects how Microsoft and Oracle diversify income streams and reveals where each places its primary sector bets:
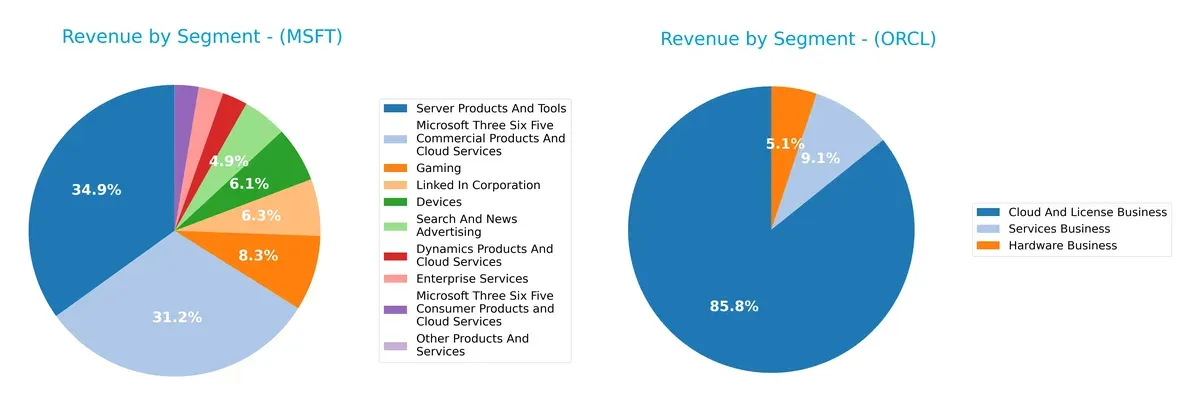
Microsoft’s revenue spans diverse segments, with Server Products and Tools anchoring at $98B and Microsoft 365 Commercial pulling $87.8B. Oracle’s revenue pivots heavily on its Cloud and License Business at $49.2B, dwarfing its Hardware ($2.9B) and Services ($5.2B) lines. Microsoft’s broad ecosystem reduces concentration risk and strengthens infrastructure dominance. Oracle’s reliance on a dominant cloud-license segment signals strategic focus but exposes it to greater single-segment risk.
Strengths and Weaknesses Comparison
This table compares the Strengths and Weaknesses of Microsoft Corporation and Oracle Corporation:
Microsoft Strengths
- Diverse revenue streams across cloud, gaming, devices, and enterprise products
- Strong global presence with nearly equal US and Non-US revenues
- Favorable profitability metrics including 36% net margin and 22% ROIC
Oracle Strengths
- Solid cloud and licensing business generating 49B USD
- High ROE at 61% indicates efficient equity use
- Presence across Americas, EMEA, and Asia Pacific regions
Microsoft Weaknesses
- Elevated price-to-book ratio at 10.76 suggests expensive valuation
- Unfavorable asset turnover of 0.46 indicates less efficient asset use
- Dividend yield low at 0.65%
Oracle Weaknesses
- Weak liquidity with current ratio at 0.75 and quick ratio also 0.75
- High debt-to-assets ratio of 62% poses financial risk
- Unfavorable weighted average cost of capital at 10%, above ROIC
Microsoft’s diversified product base and balanced geographic exposure support stable growth, despite valuation and efficiency concerns. Oracle’s strong equity returns contrast with liquidity and leverage challenges, signaling potential financial constraints affecting its strategy.
The Moat Duel: Analyzing Competitive Defensibility
A structural moat is the only true shield protecting long-term profits from relentless competitive erosion. Let’s dissect where Microsoft and Oracle stand:
Microsoft Corporation: Ecosystem Lock-in Powered by Network Effects
Microsoft’s moat stems from vast network effects across cloud, productivity, and OS platforms. This manifests in 44.7% EBIT margins and steady revenue growth near 15% in 2025. The expanding Azure cloud and integrated services deepen this moat, though declining ROIC signals rising competitive pressures.
Oracle Corporation: Cost and Intangible Assets Moat with Legacy Strength
Oracle relies on cost advantages and entrenched enterprise software licenses, reflected in a 70.5% gross margin and solid EBIT margin near 31%. However, its ROIC lags below WACC, indicating value erosion. Oracle’s cloud pivot offers growth potential but faces fierce cloud incumbents.
Verdict: Ecosystem Lock-in vs. Cost Advantage in the Cloud Era
Microsoft holds a wider moat, leveraging network effects that drive higher profitability and durable competitive advantages. Oracle’s moat is narrower and under pressure, making Microsoft better equipped to defend and grow market share in 2026.
Which stock offers better returns?
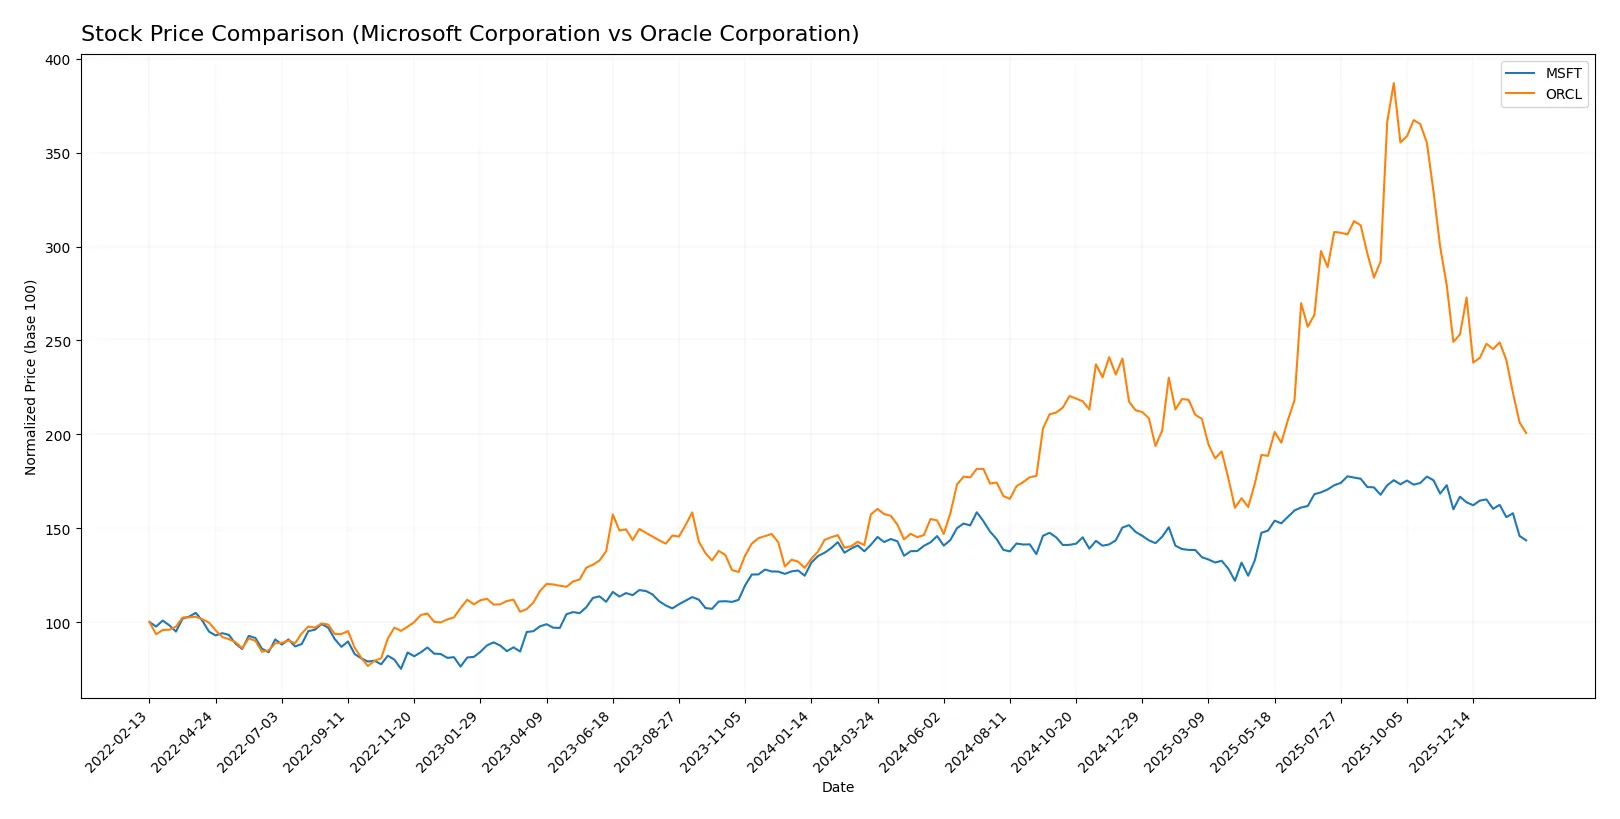
The past year shows divergent price moves for Microsoft and Oracle, with both stocks experiencing recent sell-offs after strong gains earlier in the period.
Trend Comparison
Microsoft’s stock rose 1.67% over the past 12 months, indicating a neutral-to-bullish trend with decelerating momentum. It peaked at 524.11 and troughed at 359.84.
Oracle’s stock climbed 27.5% over the last year, signaling a clear bullish trend despite deceleration. Its price ranged from 114.88 to a high of 308.66.
Oracle outperformed Microsoft in market returns over the past year, delivering substantially higher gains despite both showing decelerating upward trends.
Target Prices
Analysts project strong upside potential for both Microsoft Corporation and Oracle Corporation.
| Company | Target Low | Target High | Consensus |
|---|---|---|---|
| Microsoft Corporation | 450 | 675 | 600.04 |
| Oracle Corporation | 175 | 400 | 308.48 |
Microsoft’s consensus target at 600 implies roughly 42% upside from its current 423. Oracle’s target consensus near 308 suggests nearly 92% potential gains from the 160 price point.

Don’t Let Luck Decide Your Entry Point
Optimize your entry points with our advanced ProRealTime indicators. You’ll get efficient buy signals with precise price targets for maximum performance. Start outperforming now!
How do institutions grade them?
Microsoft Corporation Grades
The following table summarizes recent institutional grades for Microsoft Corporation:
| Grading Company | Action | New Grade | Date |
|---|---|---|---|
| Citigroup | Maintain | Buy | 2026-01-30 |
| Wedbush | Maintain | Outperform | 2026-01-29 |
| Cantor Fitzgerald | Maintain | Overweight | 2026-01-29 |
| RBC Capital | Maintain | Outperform | 2026-01-29 |
| Stifel | Maintain | Buy | 2026-01-29 |
| DA Davidson | Maintain | Buy | 2026-01-29 |
| Keybanc | Maintain | Overweight | 2026-01-29 |
| Piper Sandler | Maintain | Overweight | 2026-01-29 |
| Evercore ISI Group | Maintain | Outperform | 2026-01-29 |
| Wells Fargo | Maintain | Overweight | 2026-01-29 |
Oracle Corporation Grades
This table presents the latest institutional grades for Oracle Corporation:
| Grading Company | Action | New Grade | Date |
|---|---|---|---|
| Morgan Stanley | Maintain | Equal Weight | 2026-01-23 |
| UBS | Maintain | Buy | 2026-01-05 |
| RBC Capital | Maintain | Sector Perform | 2026-01-05 |
| Jefferies | Maintain | Buy | 2026-01-05 |
| Goldman Sachs | Maintain | Neutral | 2025-12-12 |
| BMO Capital | Maintain | Outperform | 2025-12-11 |
| RBC Capital | Maintain | Sector Perform | 2025-12-11 |
| Guggenheim | Maintain | Buy | 2025-12-11 |
| Piper Sandler | Maintain | Overweight | 2025-12-11 |
| Keybanc | Maintain | Overweight | 2025-12-11 |
Which company has the best grades?
Microsoft consistently holds strong buy and outperform ratings across multiple top-tier firms. Oracle’s grades are more mixed, with several sector perform and neutral assessments. This difference may affect investor confidence and perceived momentum.
Risks specific to each company
The following categories identify the critical pressure points and systemic threats facing both firms in the 2026 market environment:
1. Market & Competition
Microsoft Corporation
- Dominates cloud and productivity software with strong innovation and ecosystem lock-in.
Oracle Corporation
- Faces intense competition in cloud and database markets, struggling to expand cloud share rapidly.
2. Capital Structure & Debt
Microsoft Corporation
- Maintains low debt-to-equity (0.18), strong interest coverage (52.84), signaling solid financial stability.
Oracle Corporation
- High debt-to-equity (5.09) and debt-to-assets (61.83%) ratios increase financial risk and reduce flexibility.
3. Stock Volatility
Microsoft Corporation
- Beta of 1.08 indicates moderate volatility, aligning with tech sector norms.
Oracle Corporation
- Higher beta at 1.63 reflects elevated stock price swings and market sensitivity.
4. Regulatory & Legal
Microsoft Corporation
- Subject to antitrust scrutiny but benefits from diversified global operations reducing regulatory dependency.
Oracle Corporation
- Faces regulatory challenges in cloud and data privacy, with hardware business adding complexity.
5. Supply Chain & Operations
Microsoft Corporation
- Extensive global supply chain supporting devices and cloud infrastructure, resilient but exposed to tech hardware cycles.
Oracle Corporation
- Supply chain risks heightened by hardware and software integration demands amid evolving enterprise needs.
6. ESG & Climate Transition
Microsoft Corporation
- Strong ESG commitments and climate initiatives enhance brand and reduce regulatory risk.
Oracle Corporation
- ESG efforts lag behind peers, potentially impacting investor perception and compliance costs.
7. Geopolitical Exposure
Microsoft Corporation
- Global footprint exposes it to US-China tensions but diversified revenue mitigates risk.
Oracle Corporation
- Concentrated enterprise customer base in US and select markets increases vulnerability to geopolitical shifts.
Which company shows a better risk-adjusted profile?
Microsoft faces its greatest risk from antitrust and regulatory pressures but benefits from a fortress-like balance sheet and moderate volatility. Oracle’s largest risk is its heavy debt load, which strains financial flexibility amid competitive and operational challenges. Microsoft’s Altman Z-score (9.7) confirms a strong safety margin versus Oracle’s borderline grey zone (2.3). This, combined with Microsoft’s superior interest coverage and lower stock volatility, underscores a more favorable risk-adjusted profile. Oracle’s debt-to-assets ratio above 60% in 2026 signals a red flag, justifying caution despite solid profitability metrics.
Final Verdict: Which stock to choose?
Microsoft’s superpower lies in its unmatched ability to generate consistent value through efficient capital allocation and strong profitability. Its declining ROIC trend is a point of vigilance but does not overshadow its robust income quality and moderate financial risk. It fits well in an Aggressive Growth portfolio seeking durable innovation leaders.
Oracle commands a strategic moat with its recurring revenue model and high return on equity despite financial leverage concerns. Its safety profile lags Microsoft’s, given its stretched balance sheet and weaker liquidity metrics. Oracle suits a GARP (Growth at a Reasonable Price) portfolio aiming for income with some growth exposure.
If you prioritize durable value creation and financial strength, Microsoft is the compelling choice due to its superior capital efficiency and income stability. However, if you seek a combination of growth and yield with a tolerance for higher financial risk, Oracle offers an attractive analytical scenario with a strong moat in software services.
Disclaimer: Investment carries a risk of loss of initial capital. The past performance is not a reliable indicator of future results. Be sure to understand risks before making an investment decision.
Go Further
I encourage you to read the complete analyses of Microsoft Corporation and Oracle Corporation to enhance your investment decisions: