Home > Comparison > Technology > MSFT vs OKTA
The strategic rivalry between Microsoft Corporation and Okta, Inc. shapes the technology sector’s software infrastructure landscape. Microsoft operates as a diversified tech giant with cloud, productivity, and consumer hardware businesses. Okta, by contrast, focuses narrowly on identity and access management solutions with a cloud-native model. This head-to-head pits broad ecosystem dominance against specialized innovation. This analysis aims to identify which corporate trajectory offers superior risk-adjusted returns for a diversified portfolio in 2026.
Table of contents
Companies Overview
Microsoft Corporation and Okta, Inc. are pivotal players in the software infrastructure market, shaping enterprise technology worldwide.
Microsoft Corporation: Global Software Infrastructure Titan
Microsoft dominates as a diversified software and cloud services leader. Its revenue streams span productivity software like Office 365, cloud computing through Azure, and consumer devices including Xbox. In 2026, Microsoft sharpens its focus on intelligent cloud solutions and AI-powered enterprise services, reinforcing its broad ecosystem and deep integration across platforms.
Okta, Inc.: Identity and Access Management Specialist
Okta stands out as a specialist in identity security and access management. Its core revenue derives from the Okta Identity Cloud, delivering secure authentication and lifecycle management for enterprises and public sector clients. In 2026, Okta advances its strategy around adaptive multi-factor authentication and seamless user experiences, emphasizing security innovation in a cloud-first world.
Strategic Collision: Similarities & Divergences
Both companies operate in software infrastructure but diverge sharply in scope and business philosophy. Microsoft builds a closed ecosystem with vast product integration, while Okta champions an open, cloud-first identity platform. They compete primarily in enterprise cloud services, particularly around secure access and productivity. Microsoft’s vast scale contrasts with Okta’s niche focus, defining distinct risk and growth profiles for investors.
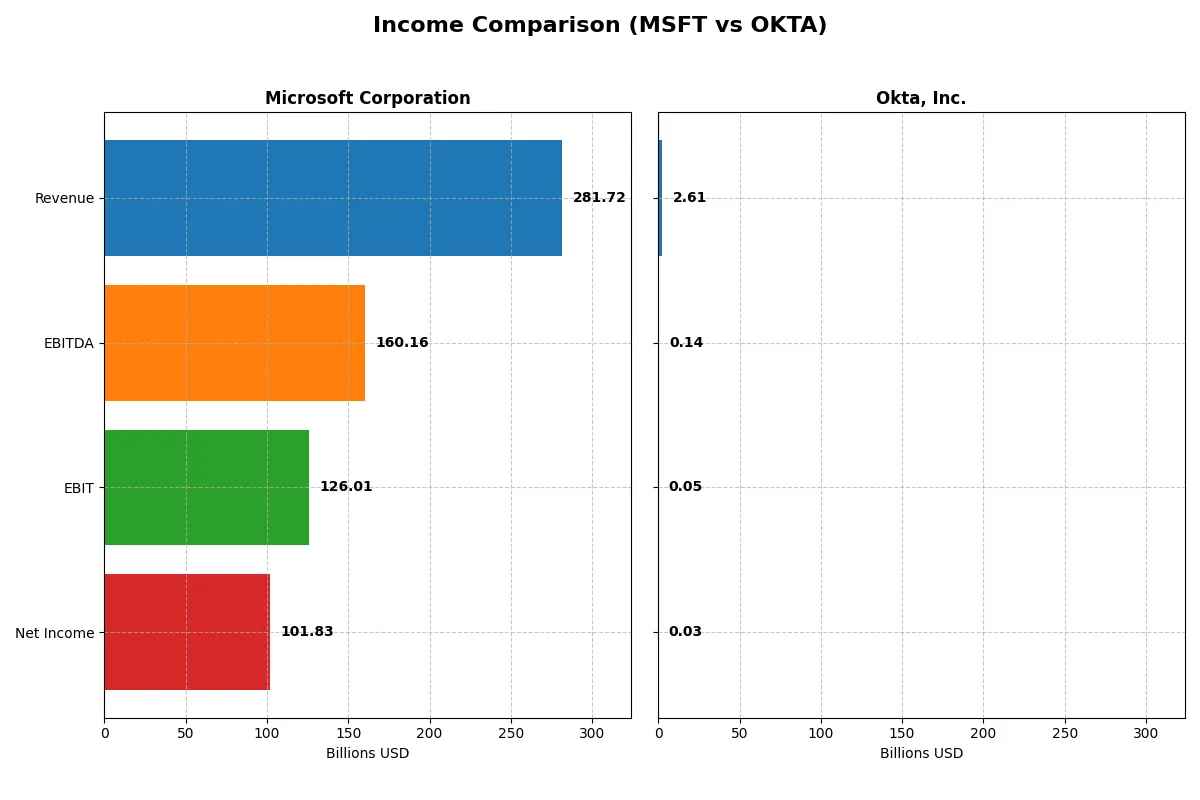
Income Statement Comparison
This data dissects the core profitability and scalability of both corporate engines to reveal who dominates the bottom line:
| Metric | Microsoft Corporation (MSFT) | Okta, Inc. (OKTA) |
|---|---|---|
| Revenue | 282B | 2.61B |
| Cost of Revenue | 87.8B | 618M |
| Operating Expenses | 65.4B | 2.07B |
| Gross Profit | 193.9B | 1.99B |
| EBITDA | 160.2B | 139M |
| EBIT | 126B | 51M |
| Interest Expense | 2.39B | 5M |
| Net Income | 101.8B | 28M |
| EPS | 13.7 | 0.17 |
| Fiscal Year | 2025 | 2025 |
Income Statement Analysis: The Bottom-Line Duel
This income statement comparison reveals the operational efficiency and profitability momentum fueling each company’s growth engine.
Microsoft Corporation Analysis
Microsoft’s revenue surged from $168B in 2021 to $282B in 2025, reflecting robust expansion. Net income climbed from $61B to $102B, signaling strong bottom-line growth. The company sustains healthy margins with a gross margin near 69% and a net margin above 36%, underscoring excellent cost control and operational leverage in 2025.
Okta, Inc. Analysis
Okta’s revenue accelerated from $835M in 2021 to $2.61B in 2025, showcasing rapid scale-up. Despite significant growth, net income remained slim, turning positive to $28M in 2025 after years of losses. Gross margin stands high at 76%, but net margin hovers just above 1%, highlighting ongoing profitability challenges amid aggressive investment.
Verdict: Scale Dominance vs. Growth Breakthrough
Microsoft dominates with massive scale and consistent profitability, boasting margins well above industry averages. Okta impresses with explosive revenue growth and margin improvement but remains at an early profitability stage. Investors seeking stable, high-margin cash flow may prefer Microsoft, while those targeting high-growth potential might watch Okta’s evolving efficiency closely.
Financial Ratios Comparison
These vital ratios act as a diagnostic tool to expose underlying fiscal health, valuation premiums, and capital efficiency for the companies compared below:
| Ratios | Microsoft Corporation (MSFT) | Okta, Inc. (OKTA) |
|---|---|---|
| ROE | 29.6% | 0.44% |
| ROIC | 22.0% | -0.61% |
| P/E | 36.3 | 570.6 |
| P/B | 10.8 | 2.49 |
| Current Ratio | 1.35 | 1.35 |
| Quick Ratio | 1.35 | 1.35 |
| D/E | 0.18 | 0.15 |
| Debt-to-Assets | 9.8% | 10.1% |
| Interest Coverage | 53.9 | -14.8 |
| Asset Turnover | 0.46 | 0.28 |
| Fixed Asset Turnover | 1.23 | 22.3 |
| Payout ratio | 23.6% | 0% |
| Dividend yield | 0.65% | 0% |
| Fiscal Year | 2025 | 2025 |
Efficiency & Valuation Duel: The Vital Signs
Ratios act as the company’s DNA, unveiling hidden risks and operational excellence beneath headline figures.
Microsoft Corporation
Microsoft delivers strong profitability with a 29.65% ROE and a healthy 36.15% net margin, signaling operational efficiency. Its P/E ratio at 36.3 appears stretched compared to sector averages. Shareholders receive modest dividends (0.65% yield), reflecting a balanced approach between returns and reinvestment in innovation.
Okta, Inc.
Okta struggles with profitability, showing a mere 0.44% ROE and a slim 1.07% net margin, indicating operational challenges. Its P/E ratio soars to 570.6, marking it as highly expensive. Okta pays no dividends, instead prioritizing growth through heavy R&D investment, typical for a growth-stage tech firm.
Premium Valuation vs. Operational Safety
Microsoft offers a robust balance of profitability and moderate valuation risks, while Okta’s sky-high multiples clash with weak profitability. Investors seeking operational safety may prefer Microsoft, whereas those chasing aggressive growth must accept Okta’s higher risk profile.
Which one offers the Superior Shareholder Reward?
I compare Microsoft and Okta’s shareholder reward through dividends, payout ratios, and buybacks. Microsoft pays a modest 0.65% dividend yield, with a sustainable 24% payout ratio supported by strong free cash flow of 9.6B. Its buyback program is robust, enhancing total return. Okta pays no dividend but reinvests heavily in growth and R&D, with free cash flow of 4.3B and no buyback activity. However, Okta’s profitability is marginal (1.1% net margin) and cash conversion weak, raising sustainability concerns. I conclude Microsoft offers a more attractive, balanced total return profile in 2026, blending income and capital return with superior financial resilience.
Comparative Score Analysis: The Strategic Profile
The radar chart reveals the fundamental DNA and trade-offs of Microsoft Corporation and Okta, Inc., highlighting their distinct strategic strengths and weaknesses:
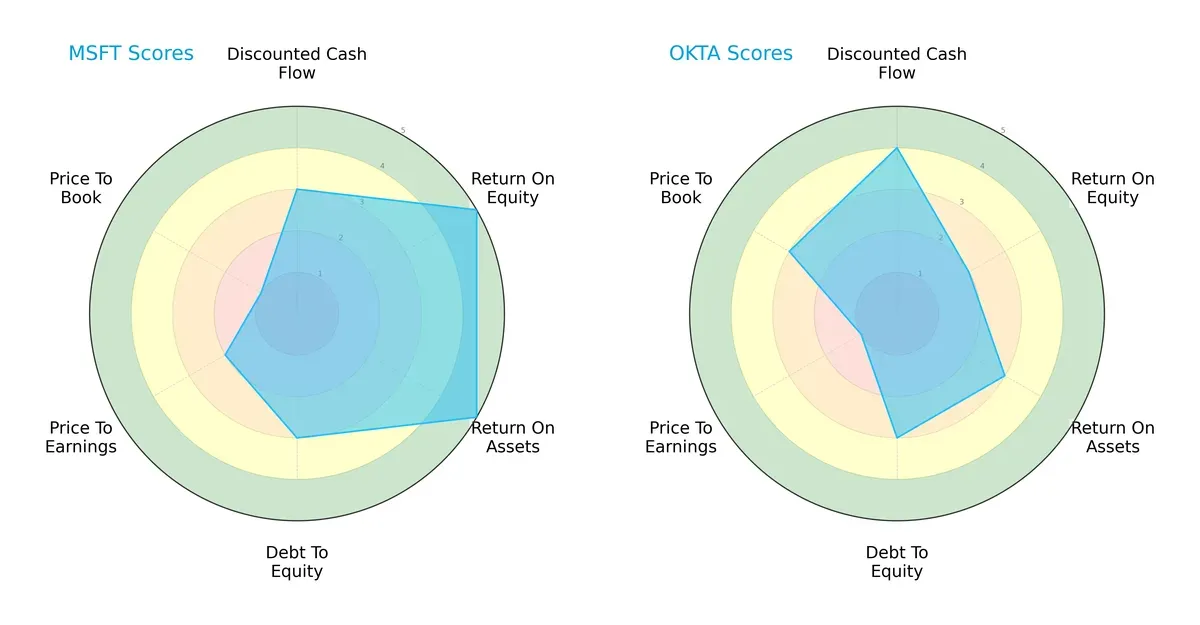
Microsoft shows strength in profitability metrics, with top scores in ROE (5) and ROA (5), indicating superior capital efficiency. Okta leads in discounted cash flow (4), suggesting better valuation prospects. Both share moderate debt-to-equity scores (3), but Microsoft’s valuation metrics lag, with weaker P/E (2) and P/B (1) scores. Overall, Microsoft presents a balanced profile centered on operational excellence, while Okta relies on growth and valuation appeal.
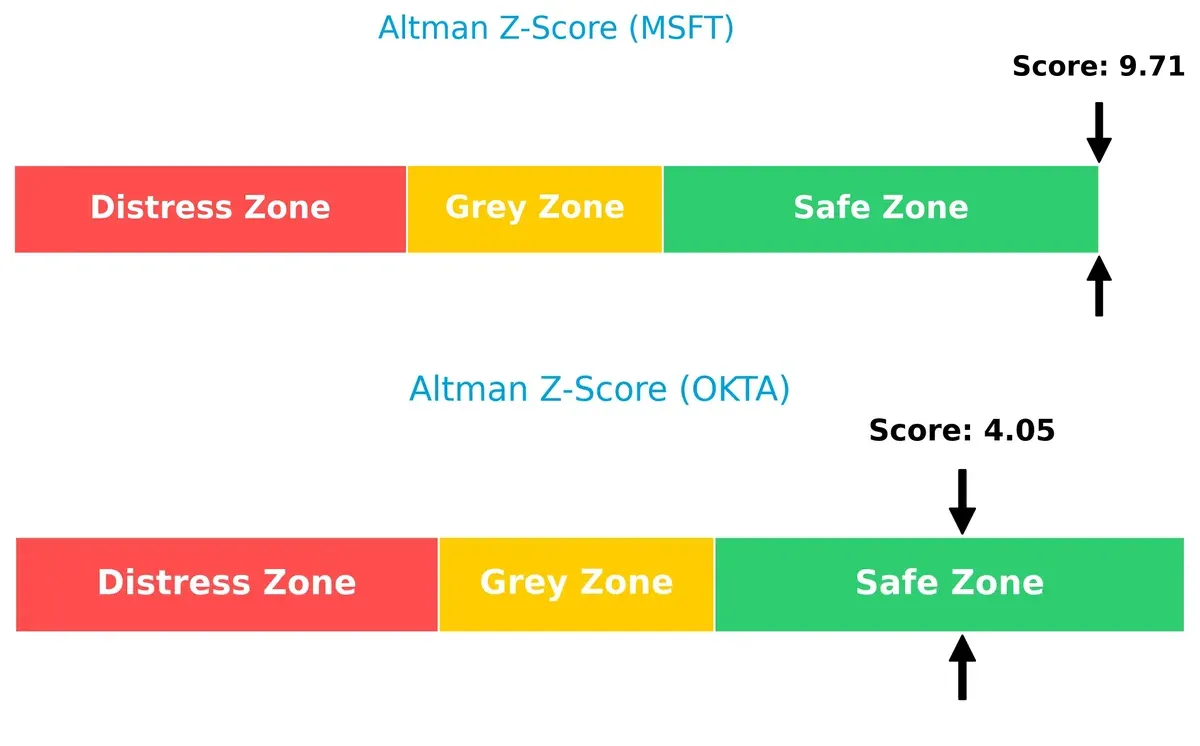
Bankruptcy Risk: Solvency Showdown
Microsoft’s Altman Z-Score of 9.7 vastly exceeds Okta’s 4.0, signaling far stronger solvency and a more secure long-term survival outlook in this cycle:
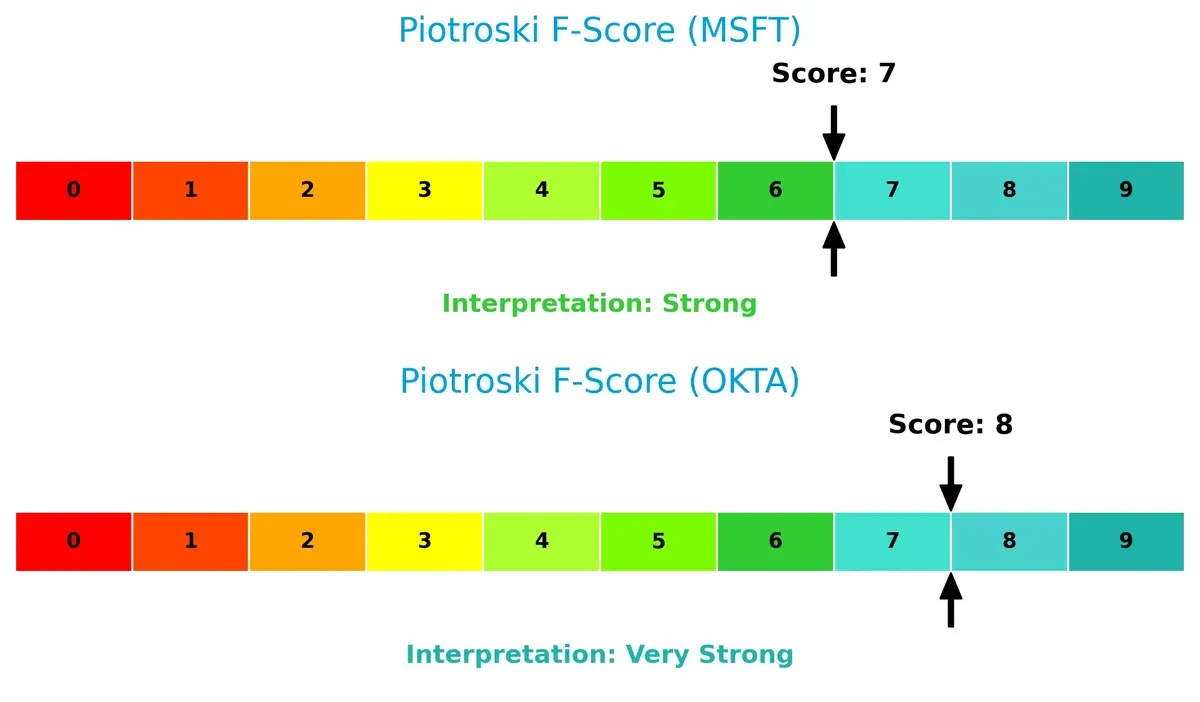
Financial Health: Quality of Operations
Okta’s Piotroski F-Score of 8 edges out Microsoft’s 7, indicating slightly stronger internal financial health and fewer red flags across profitability, leverage, and efficiency metrics:
How are the two companies positioned?
This section dissects the operational DNA of Microsoft and Okta by comparing their revenue distribution and internal dynamics. The goal is to confront their economic moats and identify which model offers the most resilient, sustainable competitive advantage today.
Revenue Segmentation: The Strategic Mix
This visual comparison dissects how Microsoft Corporation and Okta, Inc. diversify their income streams and reveals their primary sector bets for 2025:
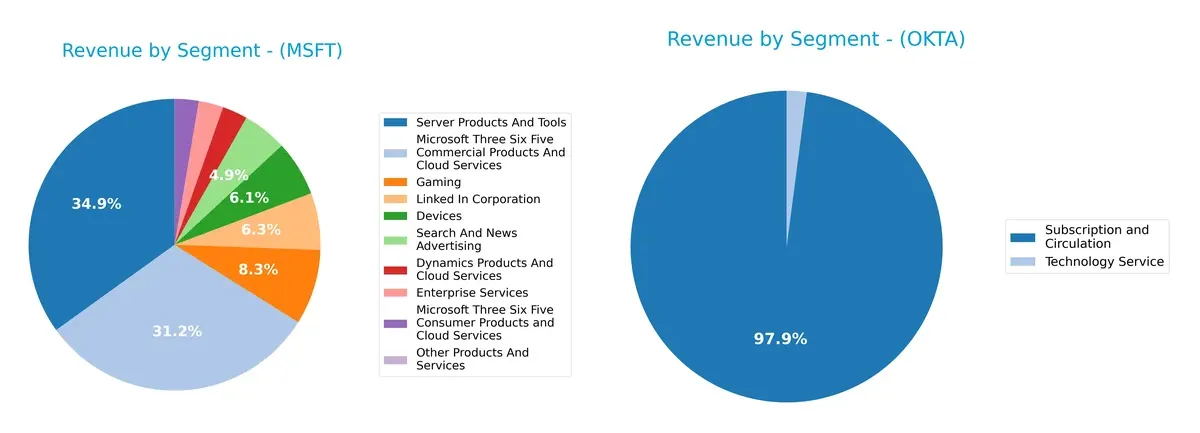
Microsoft dwarfs Okta with a broad revenue base, spanning Server Products and Tools at $98.4B and Microsoft 365 Commercial at $87.8B. Okta leans heavily on Subscription and Circulation, generating $2.56B, showing far less diversification. Microsoft’s mix anchors on infrastructure dominance and ecosystem lock-in, reducing concentration risk. Okta’s reliance on a single segment signals vulnerability to market shifts and competitive pressures in identity management.
Strengths and Weaknesses Comparison
This table compares the strengths and weaknesses of Microsoft Corporation and Okta, Inc.:
Microsoft Corporation Strengths
- Diverse product segments including cloud, gaming, enterprise services
- Strong global presence with nearly equal US and non-US revenues
- High profitability with 36.15% net margin and 29.65% ROE
- Low debt levels and strong interest coverage
- Consistent innovation across multiple technology domains
Okta, Inc. Strengths
- Favorable weighted average cost of capital at 7.22%
- Strong quick ratio and manageable debt levels
- High fixed asset turnover indicating efficient asset use
- Focused subscription revenue stream showing steady growth
- Solid interest coverage ratio supporting financial stability
Microsoft Corporation Weaknesses
- High price-to-book (10.76) and price-to-earnings (36.31) ratios may limit valuation upside
- Asset turnover ratio low at 0.46, indicating less efficient asset utilization
- Dividend yield low at 0.65%, less attractive for income investors
Okta, Inc. Weaknesses
- Low profitability with net margin at 1.07% and negative ROIC (-0.61%)
- Extremely high price-to-earnings ratio (570.6) signals overvaluation risk
- Lower asset turnover of 0.28 suggests less efficient asset use
- No dividend payments, limiting income generation
Both companies show financial prudence with low leverage and solid liquidity. Microsoft’s strengths lie in diversified revenues and high profitability, while Okta benefits from a focused, efficient asset base and favorable capital costs. However, each faces valuation and efficiency challenges that could shape their strategic priorities going forward.
The Moat Duel: Analyzing Competitive Defensibility
A structural moat is the only thing protecting long-term profits from the erosion of competition. Let’s dissect how these two firms defend their turf:
Microsoft Corporation: Ecosystem Lock-in
Microsoft’s moat stems from its vast ecosystem and switching costs embedded in cloud, productivity, and OS platforms. This manifests in a high ROIC (+13%) and stable margins near 44%. In 2026, Azure’s expansion and AI integration could deepen this moat, though declining ROIC signals pressure.
Okta, Inc.: Rapidly Growing Innovation Edge
Okta’s moat relies on identity management innovation and adaptive security solutions, contrasting Microsoft’s broad ecosystem. Though currently shedding value (negative ROIC vs. WACC), Okta’s ROIC growth of 92% indicates improving profitability. Opportunities lie in expanding cloud adoption and API security markets.
Ecosystem Lock-in vs. Innovation Growth: Who Holds the Moat Edge?
Microsoft possesses a wider, more entrenched moat anchored in its diversified platform dominance and consistent value creation. Okta’s faster ROIC growth shows promise but its moat remains narrower and less proven. Microsoft is better equipped to defend market share amid intensifying competition.
Which stock offers better returns?
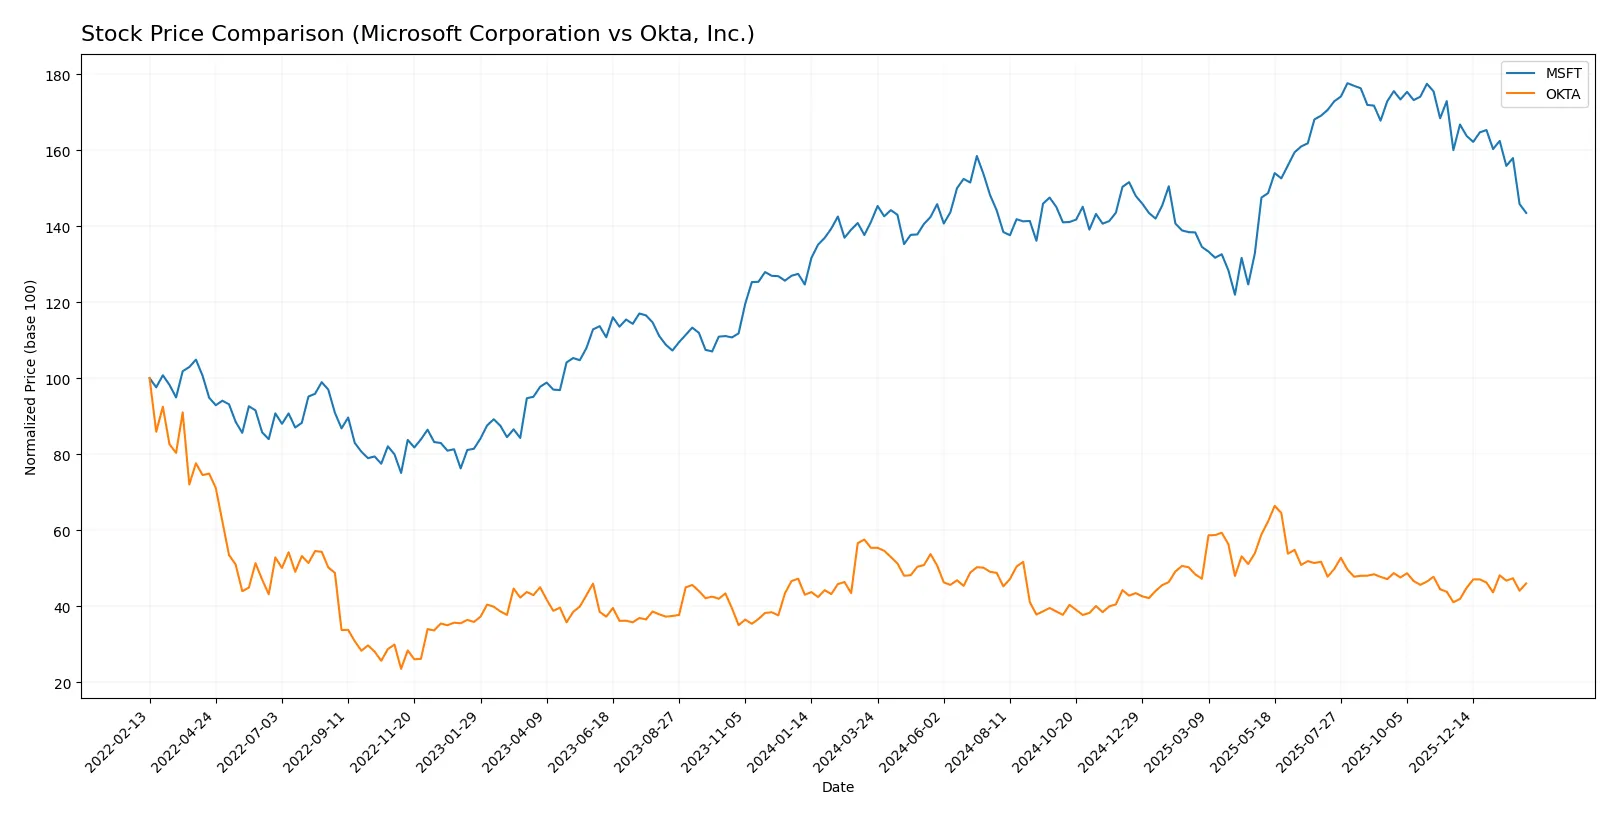
Over the past 12 months, Microsoft showed modest gains with a slowing upward trend, while Okta experienced a sharper overall decline despite recent positive momentum.
Trend Comparison
Microsoft’s stock price rose 1.67% over the past year, indicating a bullish trend with deceleration. It hit a high of 524.11 and a low of 359.84, showing notable price range.
Okta’s stock price fell 16.94%, reflecting a bearish trend with accelerating decline. Its price ranged between 72.24 and 127.3, though recent months showed a 12.01% recovery.
Comparing both, Microsoft delivered the highest market performance with a slight positive return, outperforming Okta’s significant overall loss despite Okta’s recent rebound.
Target Prices
Analysts project solid upside potential for both Microsoft Corporation and Okta, Inc., based on current consensus targets.
| Company | Target Low | Target High | Consensus |
|---|---|---|---|
| Microsoft Corporation | 450 | 675 | 600.04 |
| Okta, Inc. | 60 | 140 | 110.67 |
Microsoft’s target consensus sits about 42% above its current price of 423.37, signaling strong growth expectations. Okta’s consensus target exceeds its current 88.13 price by roughly 25%, reflecting bullish sentiment but with wider valuation variance.

Don’t Let Luck Decide Your Entry Point
Optimize your entry points with our advanced ProRealTime indicators. You’ll get efficient buy signals with precise price targets for maximum performance. Start outperforming now!
How do institutions grade them?
Microsoft Corporation Grades
The following table summarizes recent institutional grades for Microsoft Corporation:
| Grading Company | Action | New Grade | Date |
|---|---|---|---|
| Citigroup | Maintain | Buy | 2026-01-30 |
| Wedbush | Maintain | Outperform | 2026-01-29 |
| Cantor Fitzgerald | Maintain | Overweight | 2026-01-29 |
| RBC Capital | Maintain | Outperform | 2026-01-29 |
| Stifel | Maintain | Buy | 2026-01-29 |
| DA Davidson | Maintain | Buy | 2026-01-29 |
| Keybanc | Maintain | Overweight | 2026-01-29 |
| Piper Sandler | Maintain | Overweight | 2026-01-29 |
| Evercore ISI Group | Maintain | Outperform | 2026-01-29 |
| Wells Fargo | Maintain | Overweight | 2026-01-29 |
Okta, Inc. Grades
The table below lists recent institutional grades for Okta, Inc.:
| Grading Company | Action | New Grade | Date |
|---|---|---|---|
| Stephens & Co. | Upgrade | Overweight | 2026-01-14 |
| Piper Sandler | Maintain | Neutral | 2026-01-05 |
| RBC Capital | Maintain | Outperform | 2026-01-05 |
| Jefferies | Upgrade | Buy | 2025-12-16 |
| Needham | Maintain | Buy | 2025-12-12 |
| BTIG | Maintain | Buy | 2025-12-04 |
| Goldman Sachs | Maintain | Buy | 2025-12-03 |
| Citigroup | Maintain | Neutral | 2025-12-03 |
| Guggenheim | Maintain | Buy | 2025-12-03 |
| Piper Sandler | Maintain | Neutral | 2025-12-03 |
Which company has the best grades?
Microsoft consistently receives high grades—Buy, Outperform, Overweight—from top-tier firms, indicating broad institutional confidence. Okta shows a mix of Buy and Neutral ratings, with some recent upgrades. Investors might see Microsoft as the more uniformly favored stock by analysts.
Risks specific to each company
The following categories identify the critical pressure points and systemic threats facing both firms in the 2026 market environment:
1. Market & Competition
Microsoft Corporation
- Dominates diverse software segments with strong cloud presence but faces intense competition from AWS and Google Cloud.
Okta, Inc.
- Specializes in identity solutions, facing fierce competition from larger cloud security providers and rapid innovation demands.
2. Capital Structure & Debt
Microsoft Corporation
- Maintains conservative leverage (D/E 0.18), strong interest coverage (52.8x), supporting financial stability.
Okta, Inc.
- Low leverage (D/E 0.15) with solid interest coverage (10.2x), though smaller scale may limit borrowing flexibility.
3. Stock Volatility
Microsoft Corporation
- Beta at 1.08 indicates moderate volatility aligned with tech sector norms.
Okta, Inc.
- Lower beta 0.77 suggests less price fluctuation, but higher P/E ratio inflates valuation risk.
4. Regulatory & Legal
Microsoft Corporation
- Large global footprint increases exposure to antitrust scrutiny and data privacy regulations.
Okta, Inc.
- Focus on identity security subjects it to evolving cybersecurity laws and compliance risks.
5. Supply Chain & Operations
Microsoft Corporation
- Complex hardware and software supply chains vulnerable to global disruptions but highly diversified.
Okta, Inc.
- Primarily cloud-based with fewer physical dependencies, yet reliant on stable internet infrastructure and third-party data centers.
6. ESG & Climate Transition
Microsoft Corporation
- Invests heavily in sustainability initiatives and carbon neutrality, enhancing long-term resilience.
Okta, Inc.
- Smaller scale ESG programs with growing focus on data security and privacy as social governance pillars.
7. Geopolitical Exposure
Microsoft Corporation
- Global operations expose it to geopolitical tensions, trade restrictions, and foreign policy shifts.
Okta, Inc.
- Primarily US-focused but expanding internationally, facing risks from geopolitical tech restrictions and data sovereignty laws.
Which company shows a better risk-adjusted profile?
Microsoft’s dominant market position and robust financial stability mitigate many risks, despite regulatory and geopolitical challenges. Okta’s niche focus and lower leverage reduce some financial risk but expose it to higher competitive and valuation pressures. Microsoft’s Altman Z-Score (9.7) and strong profitability contrast with Okta’s thinner margins and higher valuation multiples. Overall, Microsoft offers a more balanced risk-adjusted profile, supported by scale and diversified operations.
Final Verdict: Which stock to choose?
Microsoft Corporation’s superpower lies in its robust economic moat, driven by consistently high returns on invested capital and a diversified revenue base. Its slight decline in profitability calls for vigilance. It suits portfolios aiming for long-term resilience and steady growth.
Okta, Inc. commands a strategic moat through its cloud-native identity solutions, offering recurring revenue potential and a strong growth trajectory. Despite weaker profitability and higher risk, it presents a compelling case for investors favoring innovation and rapid expansion with a tolerance for volatility.
If you prioritize stable value creation and proven profitability, Microsoft outshines as the compelling choice due to its strong cash generation and capital efficiency. However, if you seek aggressive growth with exposure to emerging cloud security trends, Okta offers better upside potential amidst higher risk.
Disclaimer: Investment carries a risk of loss of initial capital. The past performance is not a reliable indicator of future results. Be sure to understand risks before making an investment decision.
Go Further
I encourage you to read the complete analyses of Microsoft Corporation and Okta, Inc. to enhance your investment decisions: