Home > Comparison > Technology > MSFT vs ODD
The strategic rivalry between Microsoft Corporation and Oddity Tech Ltd. shapes the evolving technology landscape. Microsoft, a capital-intensive software infrastructure titan, contrasts Oddity’s agile, digitally native consumer-tech model. This face-off highlights a broader battle between established scale and innovative disruption within the software sector. This analysis will clarify which trajectory delivers superior risk-adjusted returns, guiding diversified portfolios through a complex and dynamic market environment.
Table of contents
Companies Overview
Microsoft Corporation and Oddity Tech Ltd. both compete in the technology sector but serve vastly different markets and scales.
Microsoft Corporation: Global Software Infrastructure Powerhouse
Microsoft dominates the software infrastructure market with a diverse revenue mix spanning cloud computing, productivity software, and personal computing devices. Its strategic focus in 2026 remains on expanding Azure’s cloud capabilities while integrating AI-driven services across its Productivity and Business Processes segment, driving enterprise adoption globally.
Oddity Tech Ltd.: Digital Disruptor in Beauty and Wellness
Oddity Tech innovates in consumer tech by leveraging PowerMatch technology to build digital-first beauty and wellness brands like IL MAKIAGE. Its strategy centers on disrupting traditional offline markets through scalable digital platforms, focusing on skincare and cosmetics product lines to capture shifting consumer preferences.
Strategic Collision: Similarities & Divergences
Both companies prioritize technology as a growth driver but differ fundamentally: Microsoft builds a closed ecosystem of enterprise and consumer products, while Oddity pursues an open, digital-first brand approach in consumer markets. Their primary battleground lies in digital innovation, yet their distinct market footprints create separate investment profiles, with Microsoft offering scale and stability, and Oddity embodying high-growth potential and volatility.
Income Statement Comparison
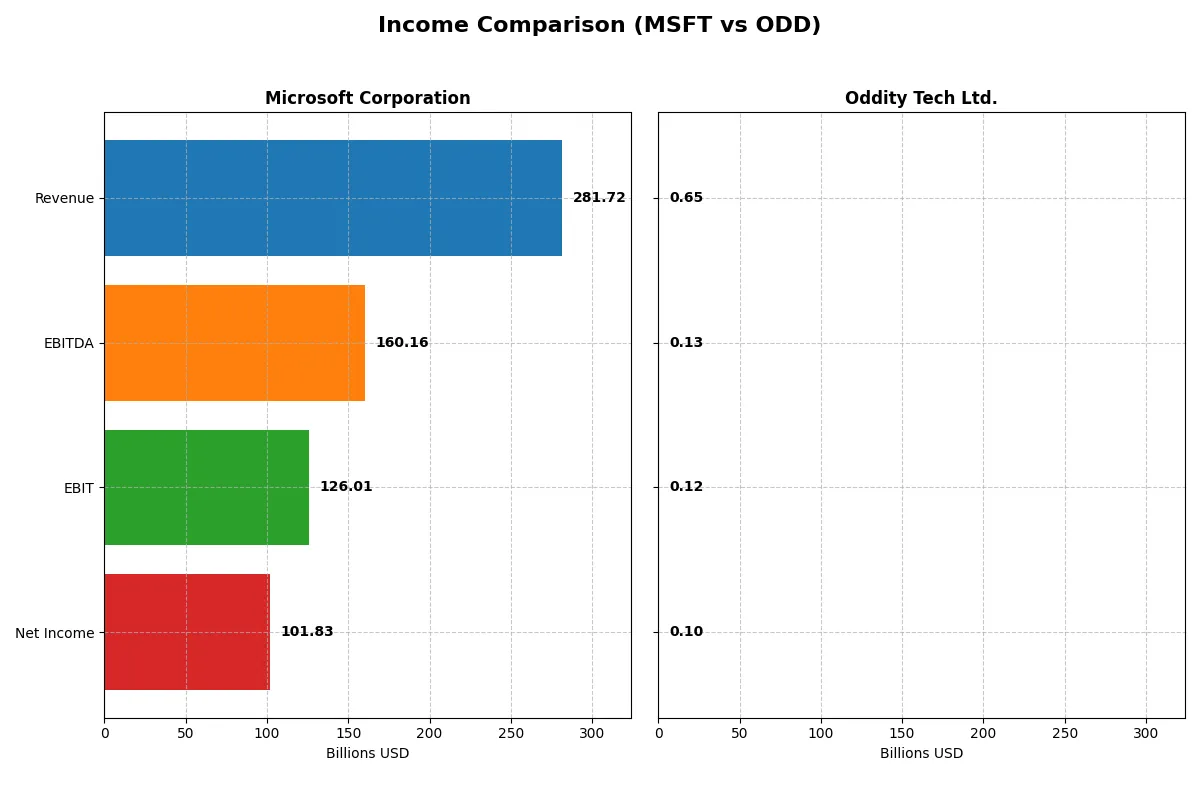
This data dissects the core profitability and scalability of both corporate engines to reveal who dominates the bottom line:
| Metric | Microsoft Corporation (MSFT) | Oddity Tech Ltd. (ODD) |
|---|---|---|
| Revenue | 282B | 647M |
| Cost of Revenue | 88B | 179M |
| Operating Expenses | 65B | 353M |
| Gross Profit | 194B | 468M |
| EBITDA | 160B | 125M |
| EBIT | 126B | 116M |
| Interest Expense | 2.39B | 76K |
| Net Income | 102B | 101M |
| EPS | 13.7 | 1.78 |
| Fiscal Year | 2025 | 2024 |
Income Statement Analysis: The Bottom-Line Duel
This income statement comparison reveals the true efficiency and growth dynamics powering each company’s financial engine over recent years.
Microsoft Corporation Analysis
Microsoft’s revenue climbed steadily from $168B in 2021 to $282B in 2025, with net income rising from $61B to $102B. Its gross margin remains robust at roughly 69%, while net margin holds a strong 36%. The 2025 figures highlight Microsoft’s ability to scale efficiently, sustaining high profitability alongside rapid revenue growth.
Oddity Tech Ltd. Analysis
Oddity Tech’s revenue surged from $111M in 2020 to $647M in 2024, with net income expanding even faster from $12M to $101M. Its gross margin outpaces Microsoft at 72%, but net margin is lower at 16%. The recent year shows remarkable momentum with sharp EBIT and net income growth, reflecting a young company rapidly improving operational leverage.
Scale Dominance vs. High Growth Momentum
Microsoft dominates in scale and margin strength, delivering consistent profitability with a $102B net income in 2025. Oddity Tech, while smaller, exhibits explosive growth and margin improvement, multiplying net income over six years. For investors, Microsoft offers steady, proven efficiency; Oddity Tech presents a high-growth profile with rising profitability potential.
Financial Ratios Comparison
These vital ratios act as a diagnostic tool to expose the underlying fiscal health, valuation premiums, and capital efficiency of the companies compared below:
| Ratios | Microsoft Corporation (MSFT) | Oddity Tech Ltd. (ODD) |
|---|---|---|
| ROE | 29.6% | 35.9% |
| ROIC | 22.0% | 28.6% |
| P/E | 36.3 | 23.7 |
| P/B | 10.8 | 8.5 |
| Current Ratio | 1.35 | 1.79 |
| Quick Ratio | 1.35 | 0.99 |
| D/E | 0.18 | 0.08 |
| Debt-to-Assets | 9.8% | 5.2% |
| Interest Coverage | 53.9 | 1521 |
| Asset Turnover | 0.46 | 1.47 |
| Fixed Asset Turnover | 1.23 | 19.4 |
| Payout ratio | 23.6% | 0 |
| Dividend yield | 0.65% | 0 |
| Fiscal Year | 2025 | 2024 |
Efficiency & Valuation Duel: The Vital Signs
Financial ratios act as a company’s DNA, revealing hidden risks and operational excellence that shape investor decisions.
Microsoft Corporation
Microsoft delivers strong profitability with a 29.65% ROE and a robust 36.15% net margin, showcasing operational efficiency. However, its valuation appears stretched, with a high P/E of 36.31 and P/B of 10.76, suggesting a premium price. Shareholders see modest dividends (0.65% yield), reflecting a balance between returns and reinvestment in growth and R&D.
Oddity Tech Ltd.
Oddity Tech stands out with a higher ROE of 35.95% and a solid 15.69% net margin, indicating efficient capital use. Its valuation is more reasonable, with a P/E of 23.75 and P/B of 8.54, offering a middle ground between value and growth. It pays no dividends, opting to reinvest cash flow aggressively to fuel expansion and innovation.
Premium Valuation vs. Operational Safety
Microsoft’s premium valuation reflects confidence in steady, high-margin returns despite a lower dividend yield. Oddity Tech offers better capital efficiency and growth potential at a more moderate price, though without shareholder payouts. Risk-tolerant investors seeking growth may favor Oddity Tech, while those prioritizing stability might lean toward Microsoft.
Which one offers the Superior Shareholder Reward?
I compare Microsoft Corporation (MSFT) and Oddity Tech Ltd. (ODD) on their shareholder return strategies. MSFT pays dividends with a yield near 0.65%, supported by a sustainable payout ratio (~24%) and strong free cash flow coverage (1.54x dividend plus capex). MSFT also executes a robust buyback program, enhancing total returns. Conversely, ODD pays no dividends, reinvesting heavily in growth and capital expenditures, supported by solid free cash flow and negligible debt. ODD’s high asset turnover (1.47x) and expanding margins hint at accelerating growth but lack immediate income. Historically, dividend plus buyback distributions offer steadier compounding in tech. I conclude MSFT provides the superior total shareholder reward in 2026, balancing income reliability and buybacks versus ODD’s growth gamble with no yield.
Comparative Score Analysis: The Strategic Profile
The radar chart reveals the fundamental DNA and trade-offs of Microsoft Corporation and Oddity Tech Ltd., highlighting their core financial strengths and vulnerabilities:
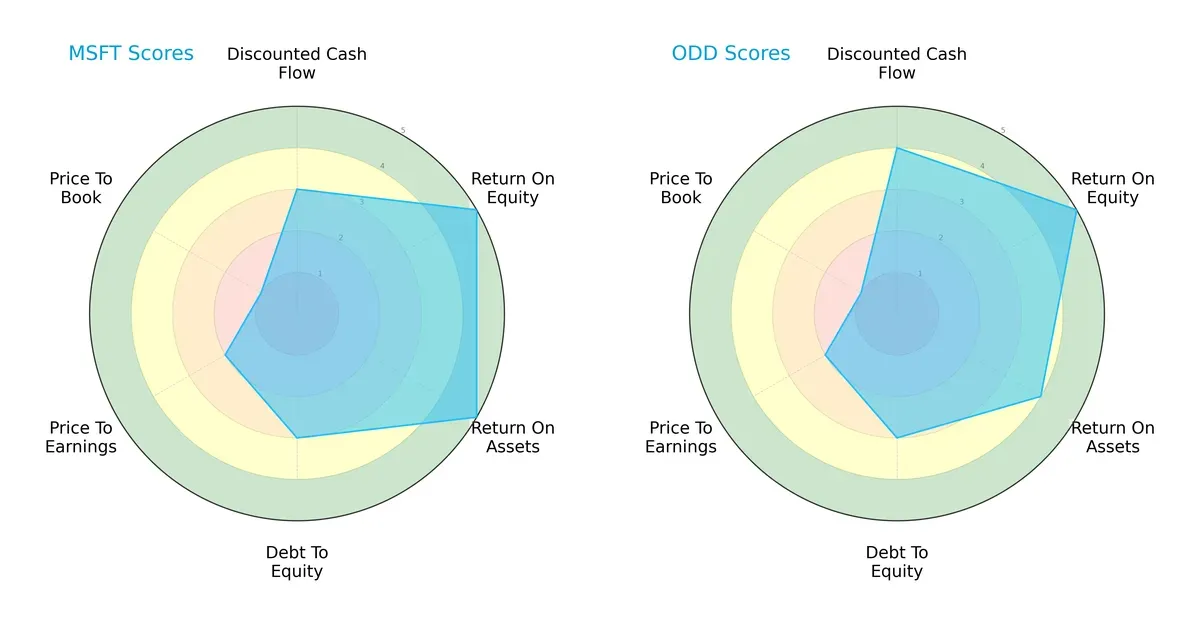
Microsoft and Oddity Tech share a similar overall score of 3, reflecting moderate financial standing. Oddity Tech edges ahead in discounted cash flow with a score of 4 versus Microsoft’s 3, indicating better valuation of future cash flows. Both boast top-tier return on equity at 5, but Microsoft leads slightly in return on assets with a perfect 5 compared to Oddity’s 4. Their debt-to-equity scores match at 3, showing comparable financial leverage. Valuation metrics reveal challenges; both score low on price-to-earnings (2) and price-to-book (1), signaling potential overvaluation risks. Microsoft’s profile appears more balanced across profitability and asset efficiency, while Oddity leans on cash flow strength.
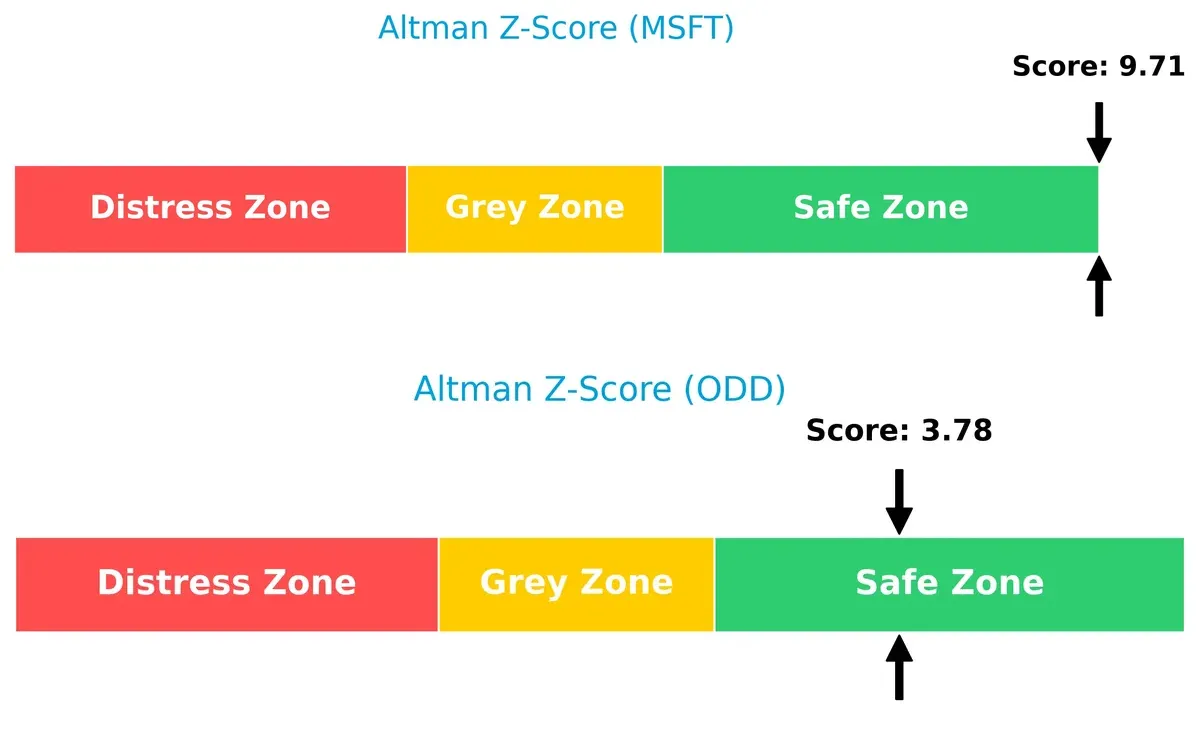
Bankruptcy Risk: Solvency Showdown
Microsoft’s Altman Z-Score at 9.7 far surpasses Oddity Tech’s 3.8. Both reside safely above the bankruptcy risk threshold, but Microsoft’s superior score underscores exceptional resilience and financial stability in this late-cycle environment:
Financial Health: Quality of Operations
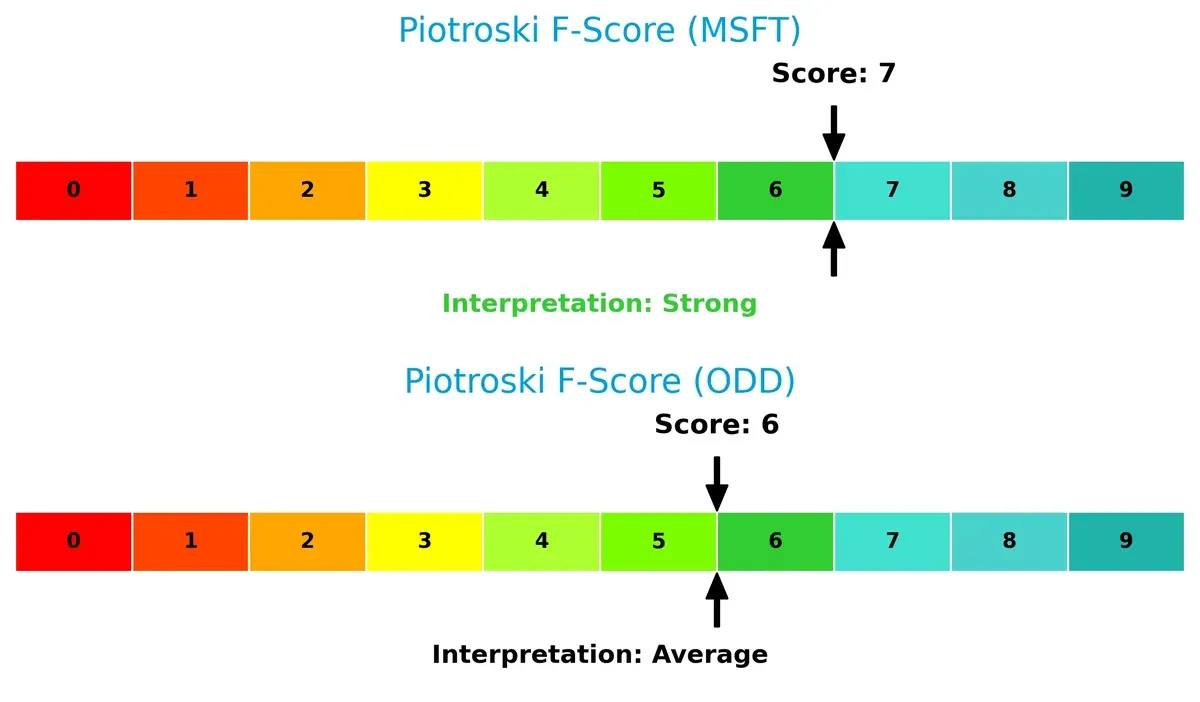
Microsoft’s Piotroski F-Score of 7 demonstrates strong financial health and operational quality, outperforming Oddity Tech’s more modest 6 score. While both are healthy, Oddity’s slightly lower score suggests minor red flags in internal metrics to monitor closely:
How are the two companies positioned?
This section dissects the operational DNA of Microsoft and Oddity Tech by comparing their revenue distribution and internal dynamics. The goal is to confront their economic moats to reveal which model offers the most resilient, sustainable advantage today.
Revenue Segmentation: The Strategic Mix
This visual comparison dissects how Microsoft Corporation and Oddity Tech Ltd. diversify their income streams and where their primary sector bets lie:
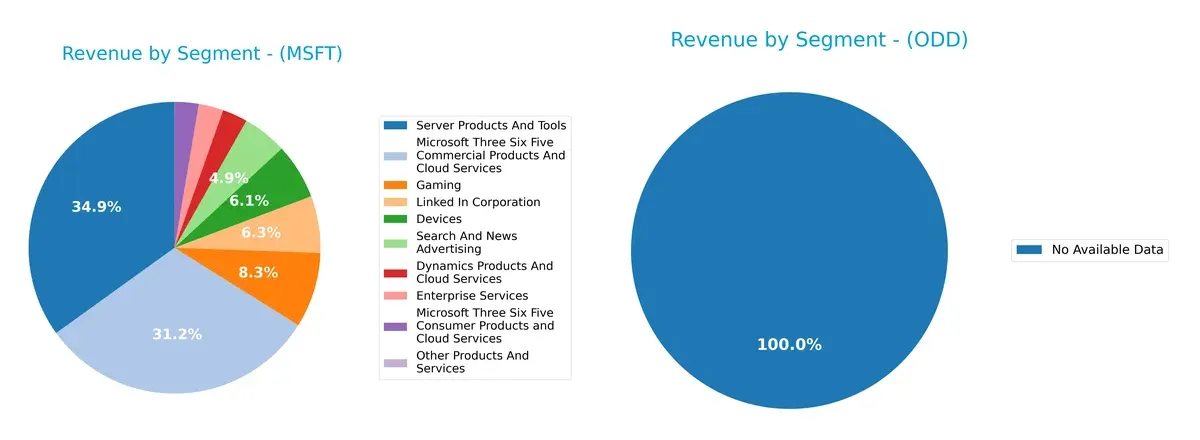
Microsoft boasts a broad revenue base, with Server Products and Tools anchoring at $98.4B, followed by Microsoft 365 Commercial at $87.8B, and LinkedIn at $17.8B. Oddity Tech lacks available data, so I cannot assess its diversification. Microsoft’s mix pivots on cloud infrastructure and productivity software, reducing concentration risk and reinforcing ecosystem lock-in. This strategy contrasts with firms reliant on a single segment, which face higher volatility and dependency risks.
Strengths and Weaknesses Comparison
This table compares the strengths and weaknesses of Microsoft Corporation and Oddity Tech Ltd.:
Microsoft Corporation Strengths
- Highly diversified revenue streams across multiple products and services
- Strong global presence with nearly equal US and Non-US revenue
- Favorable profitability with 36.15% net margin and 22.02% ROIC
- Low debt-to-assets ratio at 9.79% and excellent interest coverage ratio
Oddity Tech Ltd. Strengths
- Favorable profitability ratios, including 35.95% ROE and 28.56% ROIC
- Very strong asset turnover and fixed asset turnover ratios
- Low debt-to-assets ratio at 5.17% and extremely high interest coverage
- Favorable current ratio at 1.79 indicates good liquidity
Microsoft Corporation Weaknesses
- Unfavorable valuation metrics with PE at 36.31 and PB at 10.76
- Subpar asset turnover at 0.46 limits capital efficiency
- Dividend yield low at 0.65%, less attractive for income investors
- Neutral current ratio at 1.35 signals moderate liquidity risk
Oddity Tech Ltd. Weaknesses
- Unfavorable high WACC of 18.68% increases capital costs
- Unfavorable PB ratio at 8.54 suggests overvaluation concerns
- Quick ratio at 0.99 signals potential short-term liquidity constraints
- No dividend yield reduces appeal for income-focused investors
Both companies show strong profitability and low leverage, critical for sustaining competitive moats. Microsoft’s global scale and diversification contrast with Oddity Tech’s capital efficiency and liquidity strengths. However, valuation and liquidity risks caution investors to monitor capital allocation and market conditions closely.
The Moat Duel: Analyzing Competitive Defensibility
A structural moat is the only reliable barrier protecting long-term profits from relentless competitive erosion. Let’s dissect two distinct moats:
Microsoft Corporation: Ecosystem and Switching Costs Fortress
Microsoft’s moat stems from deep ecosystem integration and high switching costs. This manifests in a strong 44.7% EBIT margin and consistent revenue growth near 15% in 2025. While ROIC exceeds WACC by 13%, the slight declining trend signals emerging competitive pressures. Expansion in cloud and AI products could reinforce this moat but demands vigilance.
Oddity Tech Ltd.: Innovation-Driven Growth Engine
Oddity’s moat derives from proprietary PowerMatch technology and rapid brand scaling in beauty and wellness. Its 72.4% gross margin and 27% revenue growth underscore operational efficiency and market traction. ROIC surpasses WACC by nearly 10% with a robust upward trend, reflecting durable competitive advantage. Continued innovation and digital disruption should widen its moat further in 2026.
Ecosystem Depth vs. Innovation Agility: The Moat Showdown
Microsoft’s wider moat benefits from entrenched ecosystem lock-in and massive scale, but its profitability shows early signs of compression. Oddity’s narrower yet rapidly deepening moat rides on innovation and brand disruption with accelerating returns. I see Oddity better positioned to expand its competitive edge, while Microsoft must defend a mature fortress against evolving threats.
Which stock offers better returns?
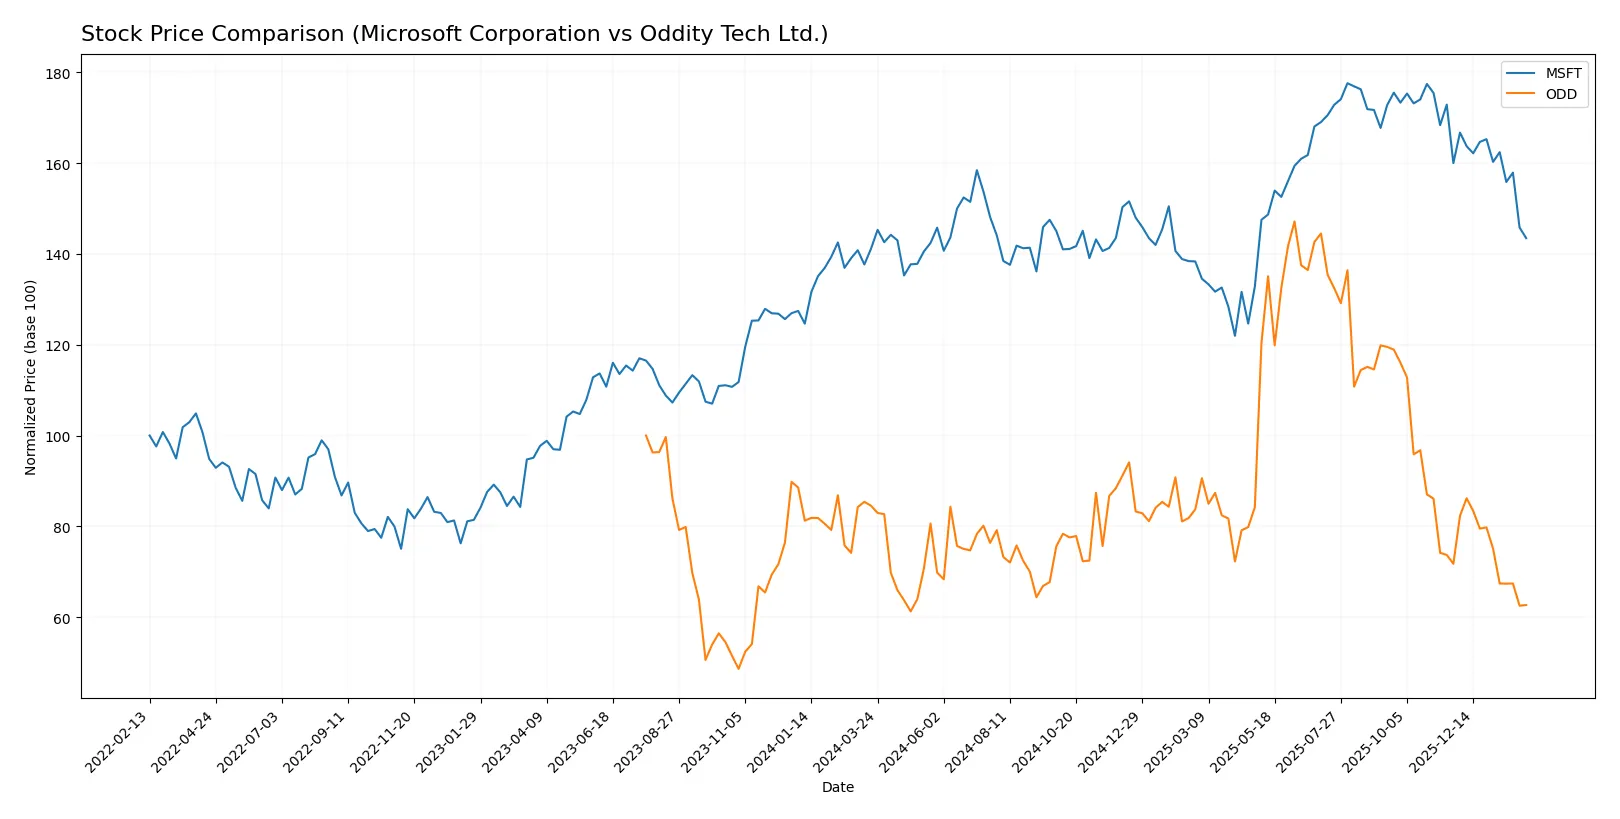
The past year shows Microsoft’s price rising modestly with decelerating momentum, while Oddity Tech’s shares declined sharply amid steady volume increases.
Trend Comparison
Microsoft’s stock gained 1.67% over 12 months, indicating a neutral to slightly bullish trend with decelerating momentum and a high volatility of 41.8. The recent quarter saw a sharp 10.33% drop with seller dominance.
Oddity Tech’s shares fell 25.88% in the last year, signaling a clear bearish trend with decelerating losses and lower volatility at 11.95. Recent months continued downward pressure with a 12.65% decline and seller dominance.
Microsoft outperformed Oddity Tech, delivering positive overall returns versus a significant decline for Oddity Tech over the past year.
Target Prices
Analysts show a bullish consensus for both Microsoft Corporation and Oddity Tech Ltd., with upside potential well above current prices.
| Company | Target Low | Target High | Consensus |
|---|---|---|---|
| Microsoft Corporation | 450 | 675 | 600.04 |
| Oddity Tech Ltd. | 40 | 80 | 66.33 |
Microsoft’s consensus target at 600.04 suggests a 42% upside from its current 423.37 price, signaling strong growth expectations. Oddity Tech’s target consensus of 66.33 implies more than 100% appreciation potential from 32.93, reflecting high investor optimism despite its smaller size.

Don’t Let Luck Decide Your Entry Point
Optimize your entry points with our advanced ProRealTime indicators. You’ll get efficient buy signals with precise price targets for maximum performance. Start outperforming now!
How do institutions grade them?
This section presents the latest institutional grades for Microsoft Corporation and Oddity Tech Ltd.:
Microsoft Corporation Grades
Below are recent grades from reputable financial institutions for Microsoft Corporation.
| Grading Company | Action | New Grade | Date |
|---|---|---|---|
| Citigroup | Maintain | Buy | 2026-01-30 |
| Wedbush | Maintain | Outperform | 2026-01-29 |
| Cantor Fitzgerald | Maintain | Overweight | 2026-01-29 |
| RBC Capital | Maintain | Outperform | 2026-01-29 |
| Stifel | Maintain | Buy | 2026-01-29 |
| DA Davidson | Maintain | Buy | 2026-01-29 |
| Keybanc | Maintain | Overweight | 2026-01-29 |
| Piper Sandler | Maintain | Overweight | 2026-01-29 |
| Evercore ISI Group | Maintain | Outperform | 2026-01-29 |
| Wells Fargo | Maintain | Overweight | 2026-01-29 |
Oddity Tech Ltd. Grades
Recent grades from established financial firms for Oddity Tech Ltd. are summarized here.
| Grading Company | Action | New Grade | Date |
|---|---|---|---|
| Keybanc | Maintain | Overweight | 2026-01-08 |
| JP Morgan | Maintain | Overweight | 2025-12-12 |
| Barclays | Maintain | Equal Weight | 2025-11-21 |
| JP Morgan | Maintain | Overweight | 2025-11-21 |
| Morgan Stanley | Maintain | Equal Weight | 2025-11-21 |
| Needham | Maintain | Buy | 2025-11-20 |
| Keybanc | Maintain | Overweight | 2025-10-08 |
| JMP Securities | Maintain | Market Outperform | 2025-09-23 |
| Morgan Stanley | Maintain | Equal Weight | 2025-08-06 |
| JMP Securities | Maintain | Market Outperform | 2025-08-05 |
Which company has the best grades?
Microsoft Corporation consistently receives stronger grades, predominantly Buy and Outperform, from major institutions. Oddity Tech Ltd. shows mixed ratings, mostly Overweight and Equal Weight. Investors might view Microsoft’s grades as reflecting higher confidence and stability.
Risks specific to each company
The following categories identify the critical pressure points and systemic threats facing both firms in the 2026 market environment:
1. Market & Competition
Microsoft Corporation
- Dominates with a vast product ecosystem and steady cloud growth but faces intense tech sector rivalry.
Oddity Tech Ltd.
- Disrupts beauty and wellness with digital-first brands but battles a niche, competitive consumer market.
2. Capital Structure & Debt
Microsoft Corporation
- Maintains low debt-to-equity (0.18) and strong interest coverage (53x), reflecting conservative leverage.
Oddity Tech Ltd.
- Even lower leverage (0.08 debt-to-equity) and exceptional interest coverage (1,521x), highlighting financial flexibility.
3. Stock Volatility
Microsoft Corporation
- Beta near market average (1.08) suggests moderate sensitivity to market swings.
Oddity Tech Ltd.
- High beta (3.18) indicates elevated stock price volatility and investor risk.
4. Regulatory & Legal
Microsoft Corporation
- Faces ongoing scrutiny on antitrust and privacy fronts due to size and global reach.
Oddity Tech Ltd.
- Smaller scale reduces regulatory exposure but international operations may invite compliance complexity.
5. Supply Chain & Operations
Microsoft Corporation
- Global supply chains are complex but benefit from scale and diversification.
Oddity Tech Ltd.
- Reliant on niche product supply chains, which may be more vulnerable to disruptions.
6. ESG & Climate Transition
Microsoft Corporation
- Committed to carbon neutrality with established ESG programs, enhancing stakeholder trust.
Oddity Tech Ltd.
- Emerging ESG initiatives but faces challenges adapting consumer-tech to climate standards.
7. Geopolitical Exposure
Microsoft Corporation
- US-based global operations exposed to trade tensions and regulatory risks in major markets.
Oddity Tech Ltd.
- Israel-based with expanding global footprint, facing geopolitical risks in Middle East and export controls.
Which company shows a better risk-adjusted profile?
Microsoft’s dominant market position and conservative capital structure reduce its systemic risks despite regulatory pressures. Oddity Tech’s higher beta and narrower market expose it to greater volatility but its strong financial ratios signal resilience. The most impactful risk for Microsoft is regulatory scrutiny threatening its business model. For Oddity Tech, stock volatility driven by market sentiment poses the greatest risk. Microsoft’s stable Altman Z-score (~9.7) and strong Piotroski score (7) underscore its safer profile. Oddity Tech’s higher beta (3.18) and lower Piotroski score (6) confirm a riskier stance despite favorable leverage. Recent data shows Microsoft’s price-to-book ratio remains elevated, suggesting valuation risk amid regulatory uncertainty.
Final Verdict: Which stock to choose?
Microsoft’s superpower lies in its unparalleled efficiency and robust cash generation. It sustains value creation despite a slight decline in profitability. The main point of vigilance is its premium valuation, which may pressure returns. It suits portfolios seeking steady, large-cap growth exposure.
Oddity Tech boasts a durable competitive moat with rapidly growing profitability and efficient capital use. Its lower valuation and strong operational metrics offer a compelling risk-adjusted profile compared to Microsoft. This stock fits well in a Growth at a Reasonable Price (GARP) portfolio seeking emerging leaders.
If you prioritize stability and proven scale, Microsoft outshines with consistent cash flow and fortress-like financial health. However, if you seek higher growth potential with increasing returns on capital, Oddity Tech offers better upside albeit with more volatility. Both represent distinct analytical scenarios for different investor risk appetites.
Disclaimer: Investment carries a risk of loss of initial capital. The past performance is not a reliable indicator of future results. Be sure to understand risks before making an investment decision.
Go Further
I encourage you to read the complete analyses of Microsoft Corporation and Oddity Tech Ltd. to enhance your investment decisions: