Home > Comparison > Technology > MSFT vs NTNX
The strategic rivalry between Microsoft Corporation and Nutanix, Inc. shapes the trajectory of the technology sector’s software infrastructure industry. Microsoft operates as a diversified technology powerhouse with extensive cloud, productivity, and personal computing segments. Nutanix focuses on delivering specialized enterprise cloud platforms and hybrid cloud orchestration. This analysis pits Microsoft’s scale and breadth against Nutanix’s niche innovation to determine which offers superior risk-adjusted potential for a balanced investment portfolio.
Table of contents
Companies Overview
Microsoft and Nutanix hold pivotal roles in the global software infrastructure market, shaping enterprise cloud solutions and virtualization.
Microsoft Corporation: Global Software Infrastructure Powerhouse
Microsoft dominates software infrastructure by generating revenue through its Productivity and Business Processes, Intelligent Cloud, and More Personal Computing segments. Its Azure cloud platform and Office 365 suite anchor its recurring revenue. In 2026, Microsoft sharpens its focus on expanding cloud services and AI integration, reinforcing its competitive edge across enterprise and consumer technology landscapes.
Nutanix, Inc.: Hybrid Cloud Innovator
Nutanix specializes in enterprise cloud platforms, driving revenue via its Acropolis virtualization, cloud governance, and hybrid cloud orchestration products. Its hybrid cloud solutions simplify complex IT environments for diverse industries worldwide. In 2026, Nutanix prioritizes Kubernetes automation and multi-cloud management to capture demand for scalable, flexible infrastructure in a competitive software market.
Strategic Collision: Similarities & Divergences
Both companies target enterprise software infrastructure but diverge in scope and scale. Microsoft embraces a broad ecosystem integrating cloud, productivity, and personal computing, while Nutanix concentrates on hybrid cloud orchestration and virtualization. The main battleground lies in cloud adoption and management services. Microsoft’s vast market presence contrasts with Nutanix’s niche innovation, defining distinct risk and growth profiles for investors.
Income Statement Comparison
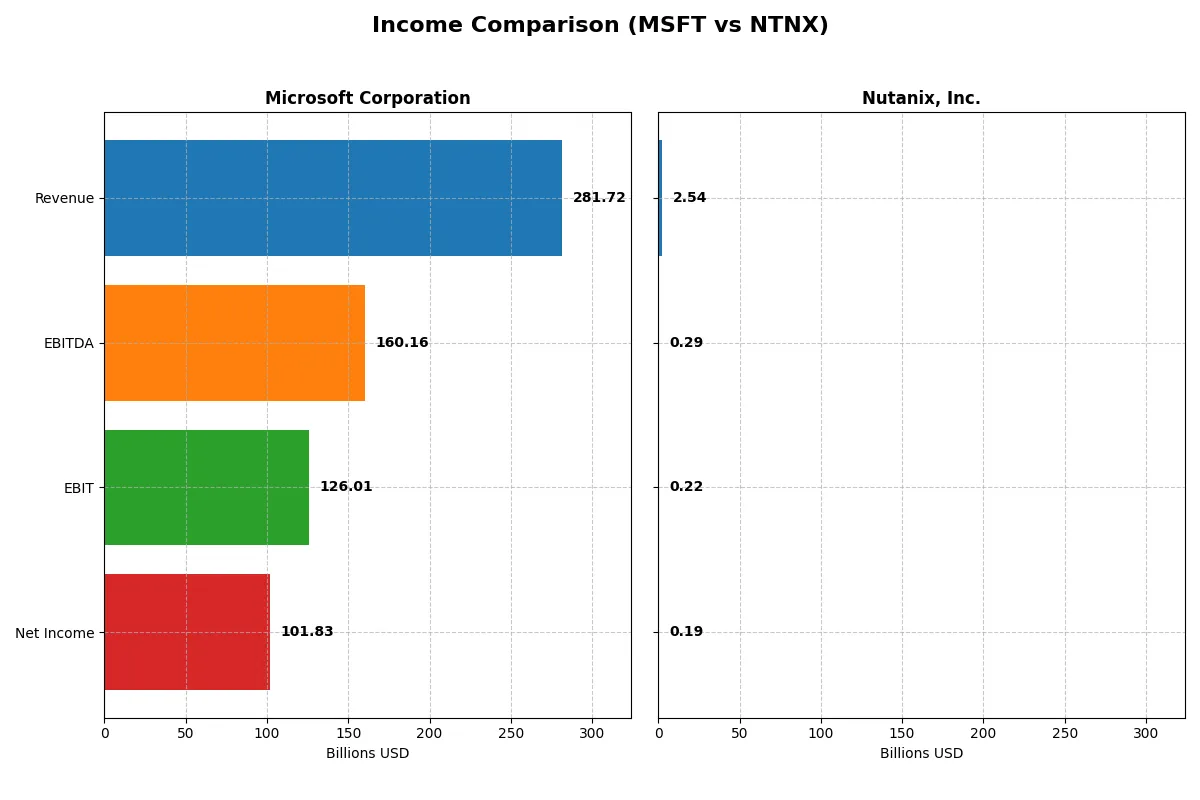
This data dissects the core profitability and scalability of both corporate engines to reveal who dominates the bottom line:
| Metric | Microsoft Corporation (MSFT) | Nutanix, Inc. (NTNX) |
|---|---|---|
| Revenue | 282B | 2.54B |
| Cost of Revenue | 88B | 335M |
| Operating Expenses | 65.4B | 2.03B |
| Gross Profit | 194B | 2.20B |
| EBITDA | 160.2B | 293M |
| EBIT | 126B | 220M |
| Interest Expense | 2.39B | 19.7M |
| Net Income | 101.8B | 188M |
| EPS | 13.7 | 0.7 |
| Fiscal Year | 2025 | 2025 |
Income Statement Analysis: The Bottom-Line Duel
This income statement comparison reveals the true efficiency and profitability dynamics powering each company’s financial engine.
Microsoft Corporation Analysis
Microsoft’s revenue surged from 168B in 2021 to 282B in 2025, with net income climbing from 61B to 102B. Its gross margin remains strong near 69%, reflecting robust cost control. The net margin at 36% signals high profitability. In 2025, Microsoft sustained momentum with a 15% revenue rise and a solid 14% EBIT growth, confirming operational efficiency.
Nutanix, Inc. Analysis
Nutanix’s revenue expanded from 1.4B in 2021 to 2.5B in 2025, with net income swinging from a -1B loss to a 188M profit. The company boasts an impressive 87% gross margin, but EBIT margin at 8.7% remains modest. In 2025, Nutanix achieved strong momentum, with over 18% revenue growth and a dramatic EBIT increase of 223%, marking a sharp turnaround in profitability.
Profitability Strength vs. Growth Turnaround
Microsoft dominates with vastly higher absolute profits and stable, high-margin operations. Nutanix impresses with rapid growth and margin improvement but on a much smaller scale. For investors prioritizing consistent, large-scale profitability, Microsoft’s profile is more attractive. Nutanix suits those focused on high-growth potential despite lower current profits.
Financial Ratios Comparison
These vital ratios act as a diagnostic tool to expose the underlying fiscal health, valuation premiums, and capital efficiency of the companies compared below:
| Ratios | Microsoft Corporation (MSFT) | Nutanix, Inc. (NTNX) |
|---|---|---|
| ROE | 29.6% | -27.1% |
| ROIC | 22.0% | 8.1% |
| P/E | 36.3 | 106.7 |
| P/B | 10.8 | -28.9 |
| Current Ratio | 1.35 | 1.72 |
| Quick Ratio | 1.35 | 1.72 |
| D/E (Debt-to-Equity) | 0.18 | -2.14 |
| Debt-to-Assets | 9.8% | 45.2% |
| Interest Coverage | 53.9 | 8.7 |
| Asset Turnover | 0.46 | 0.77 |
| Fixed Asset Turnover | 1.23 | 9.15 |
| Payout Ratio | 23.6% | 0 |
| Dividend Yield | 0.65% | 0 |
| Fiscal Year | 2025 | 2025 |
Efficiency & Valuation Duel: The Vital Signs
Financial ratios act as a company’s DNA, revealing hidden risks and operational excellence that shape investment decisions.
Microsoft Corporation
Microsoft exhibits strong profitability with a 29.65% ROE and a 36.15% net margin, signaling operational efficiency. However, its valuation appears stretched with a 36.31 P/E and 10.76 P/B, above sector norms. Dividend yield is modest at 0.65%, reflecting a balanced approach of shareholder returns and reinvestment in R&D and growth.
Nutanix, Inc.
Nutanix shows weaker profitability, with a negative 27.12% ROE and a slimmer 7.42% net margin, reflecting operational challenges. Its valuation stands very high with a 106.74 P/E, indicating market expectations are elevated. The company pays no dividend, aggressively reinvesting in R&D to fuel growth amid uneven returns.
Valuation Stretch vs. Profitability Strength
Microsoft offers superior profitability and operational discipline but trades at a premium valuation. Nutanix presents higher growth potential with heavy reinvestment but bears significant profitability risks. Investors seeking stability may favor Microsoft, while those with higher risk tolerance might consider Nutanix’s growth profile.
Which one offers the Superior Shareholder Reward?
I contrast Microsoft and Nutanix’s approaches to shareholder reward. Microsoft yields a modest 0.65% dividend with a conservative 24% payout, supported by strong free cash flow coverage (1.54x). Its robust buybacks amplify total returns. Nutanix pays no dividend, reinvesting cash into growth and acquisitions. Its free cash flow is positive but small (2.8/share), and buyback activity is minimal or unreported. Historically, Microsoft’s distribution is sustainable, balancing income and capital return. Nutanix’s model bets on capital appreciation but carries higher risk given its weaker profitability and leverage. I find Microsoft offers a superior total return profile for 2026 investors seeking a blend of income, buybacks, and financial strength.
Comparative Score Analysis: The Strategic Profile
The radar chart reveals the fundamental DNA and trade-offs of Microsoft Corporation and Nutanix, Inc., showcasing their distinct financial strengths and vulnerabilities:
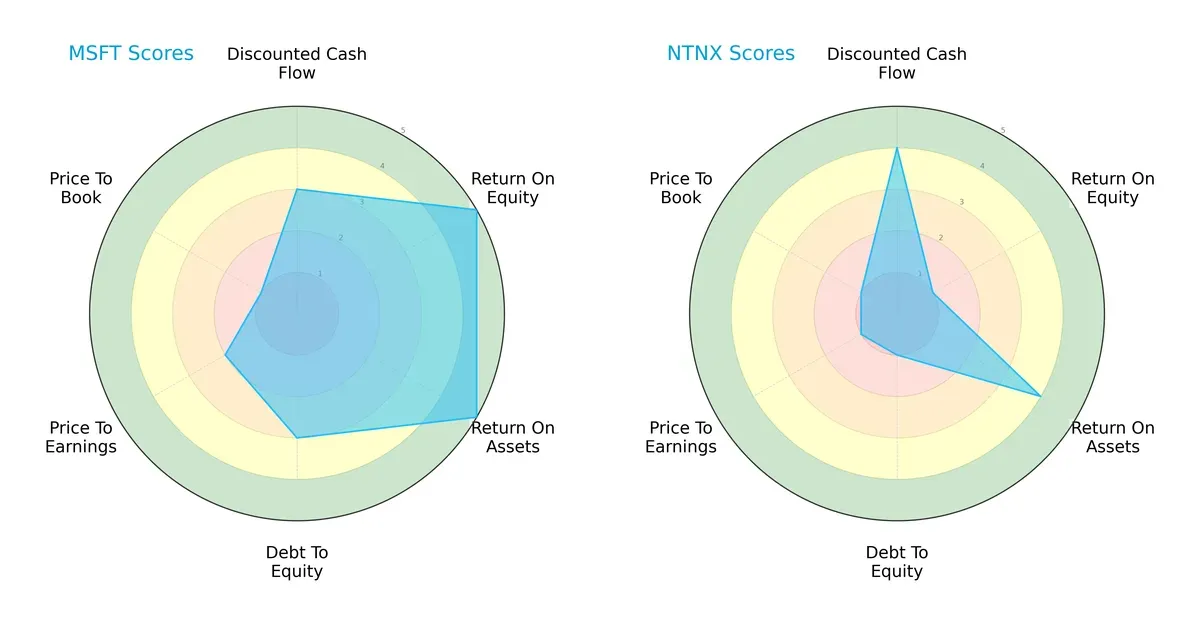
Microsoft displays a more balanced profile with strong ROE (5) and ROA (5) scores, reflecting operational efficiency. Nutanix leverages a higher DCF score (4), suggesting better cash flow projections but suffers from weak ROE (1) and poor debt-to-equity (1), exposing financial risk. Microsoft’s valuation metrics (P/E 2, P/B 1) appear less favorable, but its overall stability outshines Nutanix’s uneven financial footing.
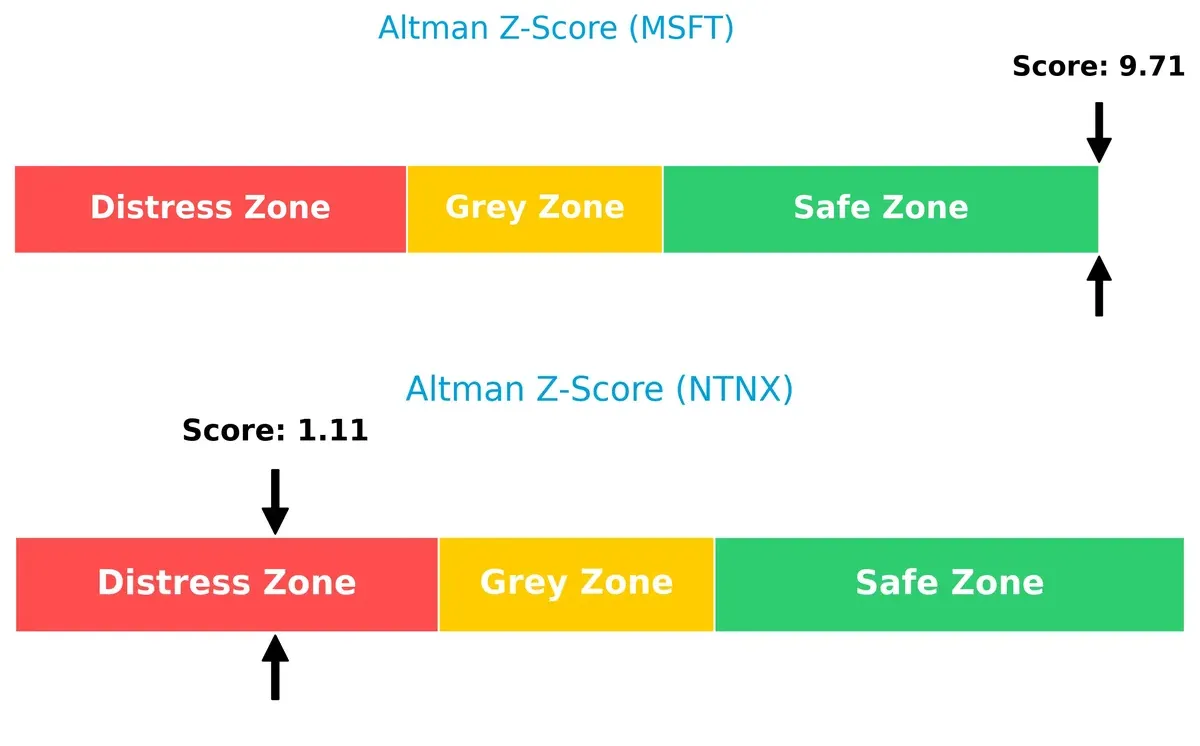
Bankruptcy Risk: Solvency Showdown
Microsoft’s Altman Z-Score of 9.7 places it firmly in the safe zone, signaling robust long-term survival prospects. Nutanix’s 1.1 score signals distress, highlighting significant bankruptcy risk in this cycle:
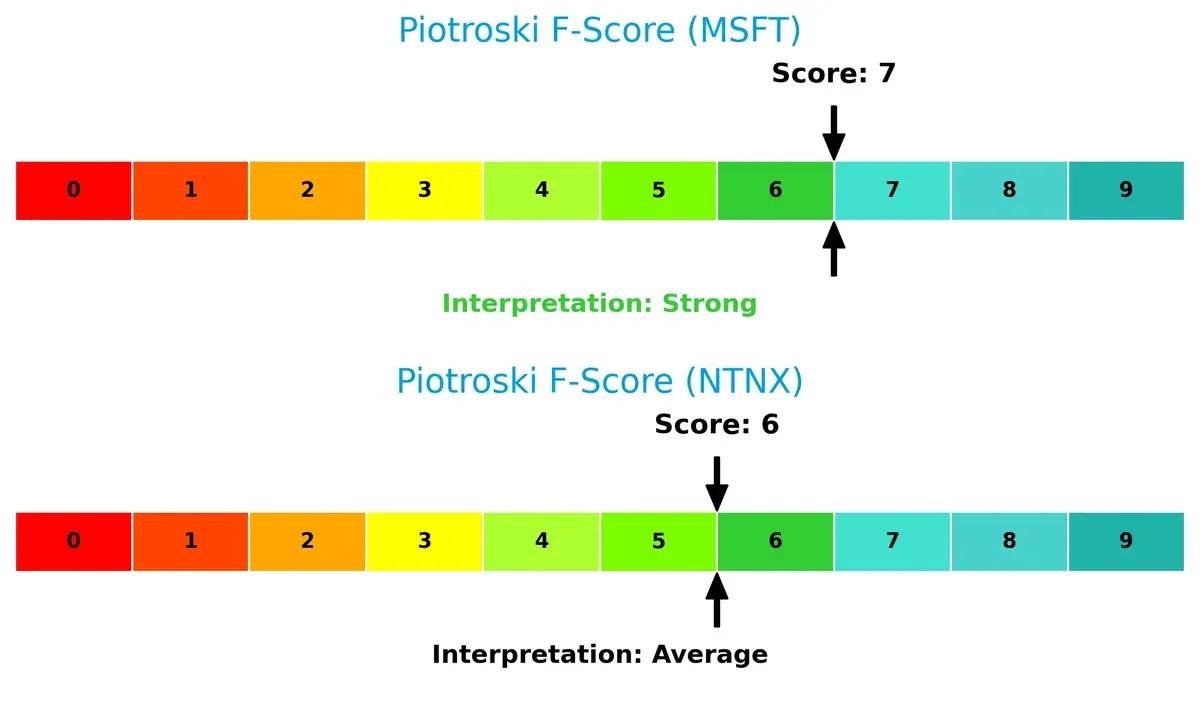
Financial Health: Quality of Operations
Microsoft’s Piotroski F-Score of 7 confirms strong operational quality and financial health. Nutanix’s 6 is average, raising caution about internal metrics and potential red flags:
How are the two companies positioned?
This section dissects Microsoft and Nutanix’s operational DNA by comparing revenue distribution and internal dynamics, including strengths and weaknesses. The goal is to confront their economic moats to identify which model delivers the most resilient, sustainable competitive advantage today.
Revenue Segmentation: The Strategic Mix
This visual comparison dissects how Microsoft Corporation and Nutanix, Inc. diversify their income streams and where their primary sector bets lie:
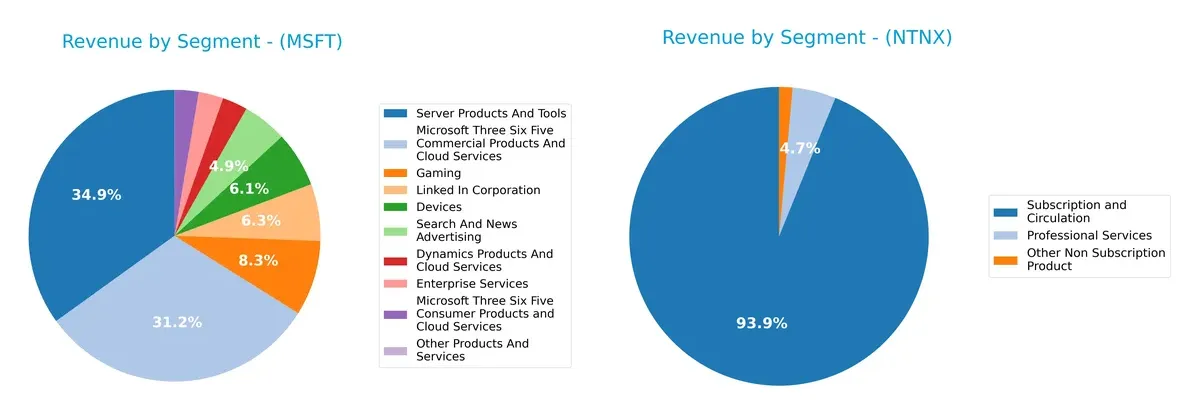
Microsoft anchors its revenue in Server Products and Tools ($98.4B) and Microsoft 365 Commercial Products and Cloud Services ($87.8B), showcasing a broad ecosystem. Nutanix relies heavily on Subscription and Circulation ($2.0B) in 2024, with smaller contributions from Professional Services ($101M) and Other Non Subscription Product ($31M). Microsoft’s diverse segments reduce concentration risk, while Nutanix’s focus exposes it to subscription market fluctuations.
Strengths and Weaknesses Comparison
This table compares the strengths and weaknesses of Microsoft Corporation and Nutanix, Inc.:
Microsoft Corporation Strengths
- Highly diversified revenue streams across multiple product lines
- Strong profitability with 36.15% net margin and 29.65% ROE
- Solid financial health with low debt ratios and high interest coverage
- Extensive global presence with over $137B non-US revenue
- Leading market share in cloud services and enterprise software
Nutanix, Inc. Strengths
- Favorable cost of capital with 5.83% WACC
- Good liquidity ratios with current and quick ratios at 1.72
- Positive asset turnover and fixed asset efficiency
- Favorable debt to equity indicating low reliance on debt
- Growing subscription revenues signaling recurring business model
Microsoft Corporation Weaknesses
- High valuation multiples with PE of 36.31 and PB of 10.76
- Asset turnover relatively low at 0.46 indicating lower efficiency
- Dividend yield low at 0.65%, less attractive for income investors
- Neutral current ratio suggests moderate short-term liquidity
- Some segments with slower growth potential
Nutanix, Inc. Weaknesses
- Negative ROE at -27.12% indicating unprofitable equity use
- High PE of 106.74 suggests overvaluation risk
- Negative PB at -28.95 points to accounting or valuation issues
- No dividend yield, limiting income appeal
- Higher debt to assets at 45.16%, moderately leveraged
Microsoft’s strengths show commanding market presence and profitability, offset by valuation concerns and moderate efficiency. Nutanix demonstrates financial prudence and a growing subscription base but faces profitability and valuation challenges. These factors influence each company’s strategic focus on growth versus financial stability.
The Moat Duel: Analyzing Competitive Defensibility
A structural moat is the only reliable shield protecting long-term profits from relentless competitive erosion. Let’s dissect the key moats of two software infrastructure players:
Microsoft Corporation: Ecosystem Lock-in through Intangible Assets
Microsoft’s moat stems from its entrenched ecosystem of software and cloud services. This manifests in a high ROIC of 13.2%, well above WACC, reflecting efficient capital use and margin stability. However, its ROIC is slightly declining, signaling pressure from evolving cloud competition. Expansion in AI and hybrid cloud offers potential moat reinforcement in 2026.
Nutanix, Inc.: Cost Advantage and Innovation-Driven Growth
Nutanix leverages a cost advantage through its hyper-converged infrastructure and automation tools, contrasting Microsoft’s broad ecosystem. Its ROIC is lower but growing rapidly by 117%, indicating improving profitability and competitive positioning. Nutanix’s focus on hybrid cloud orchestration opens new markets, suggesting a deepening moat in 2026.
Ecosystem Lock-in vs. Cost Innovation: The Moat Faceoff
Microsoft’s wider moat benefits from decades of intangible asset accumulation and a vast global footprint. Nutanix’s narrower but rapidly expanding moat relies on innovation and cost efficiency. I see Microsoft better equipped to defend its market share long-term, while Nutanix’s moat is promising but less entrenched.
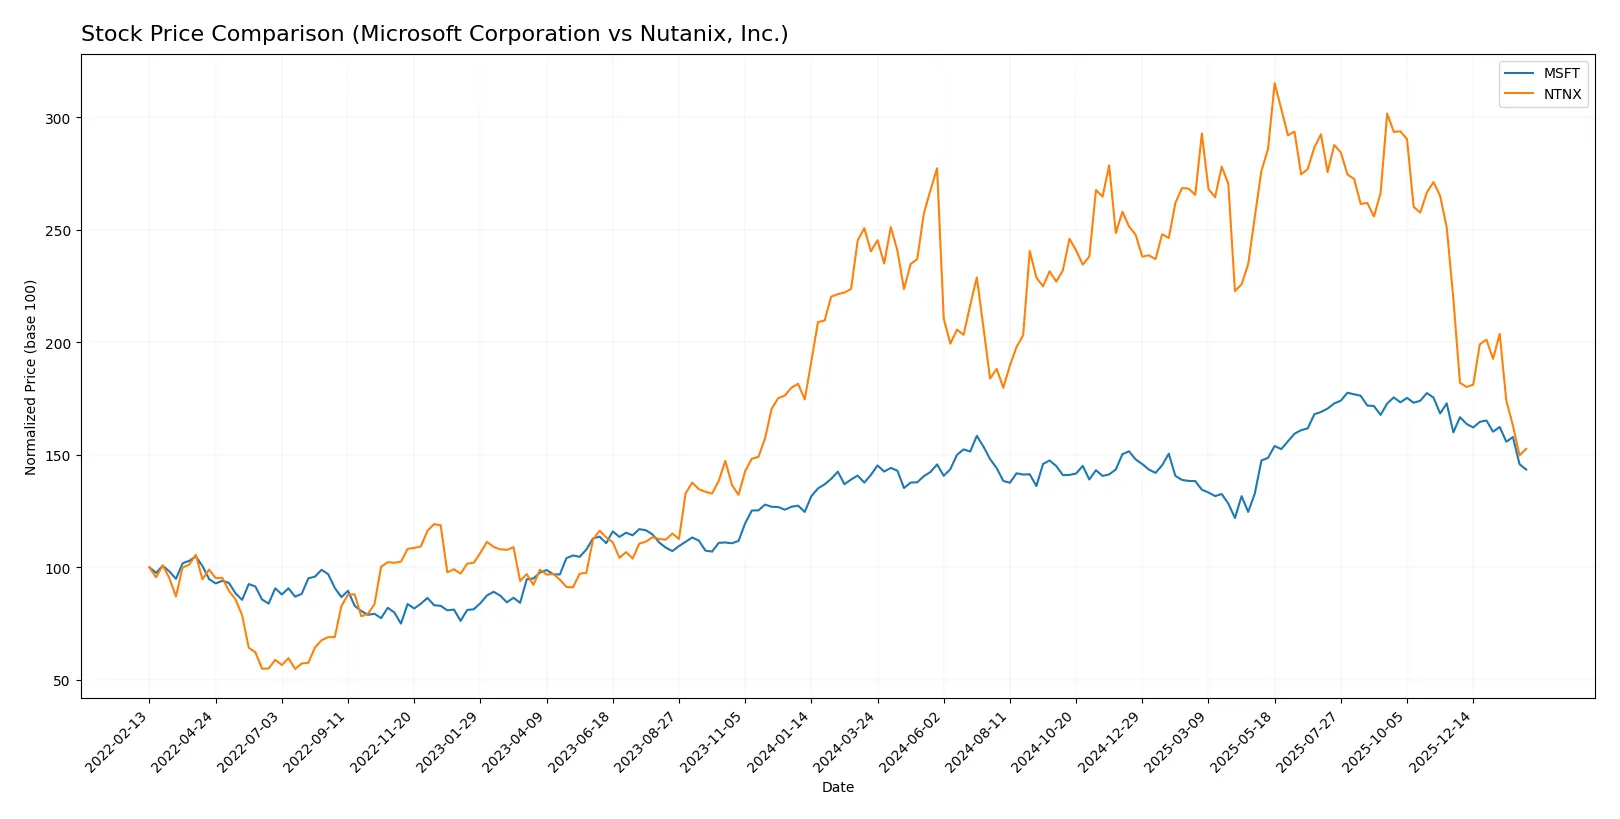
Which stock offers better returns?
Over the past 12 months, Microsoft’s stock showed modest gains with notable price peaks, while Nutanix faced significant declines, reflecting contrasting trading dynamics and investor sentiment.
Trend Comparison
Microsoft’s stock rose 1.67% over the past year, indicating a neutral-to-bullish trend with decelerating momentum. The price fluctuated between $359.84 and $524.11 amid high volatility.
Nutanix’s stock dropped 36.49%, confirming a bearish trend with decelerating declines. The price ranged from $39.33 to $82.77, showing lower volatility than Microsoft’s shares.
Microsoft outperformed Nutanix in market returns, delivering a stable trend versus Nutanix’s steep losses over the last 12 months.
Target Prices
Analysts present a strong upside consensus for both Microsoft Corporation and Nutanix, Inc., signaling robust growth expectations.
| Company | Target Low | Target High | Consensus |
|---|---|---|---|
| Microsoft Corporation | 450 | 675 | 600.04 |
| Nutanix, Inc. | 53 | 90 | 64.67 |
Microsoft’s consensus target of 600.04 implies a 42% premium to the current price of 423.37, reflecting confidence in its cloud and software moat. Nutanix’s 64.67 target suggests a 61% upside from 40.1, indicating optimism despite its smaller scale and market volatility.

Don’t Let Luck Decide Your Entry Point
Optimize your entry points with our advanced ProRealTime indicators. You’ll get efficient buy signals with precise price targets for maximum performance. Start outperforming now!
How do institutions grade them?
Here are the recent institutional grades for Microsoft Corporation and Nutanix, Inc.:
Microsoft Corporation Grades
The table below shows the latest grades from major financial institutions.
| Grading Company | Action | New Grade | Date |
|---|---|---|---|
| Citigroup | Maintain | Buy | 2026-01-30 |
| Wedbush | Maintain | Outperform | 2026-01-29 |
| Cantor Fitzgerald | Maintain | Overweight | 2026-01-29 |
| RBC Capital | Maintain | Outperform | 2026-01-29 |
| Stifel | Maintain | Buy | 2026-01-29 |
| DA Davidson | Maintain | Buy | 2026-01-29 |
| Keybanc | Maintain | Overweight | 2026-01-29 |
| Piper Sandler | Maintain | Overweight | 2026-01-29 |
| Evercore ISI Group | Maintain | Outperform | 2026-01-29 |
| Wells Fargo | Maintain | Overweight | 2026-01-29 |
Nutanix, Inc. Grades
The table below shows recent grades from notable financial institutions.
| Grading Company | Action | New Grade | Date |
|---|---|---|---|
| Barclays | Downgrade | Equal Weight | 2026-01-15 |
| Morgan Stanley | Downgrade | Equal Weight | 2026-01-12 |
| RBC Capital | Maintain | Outperform | 2026-01-05 |
| Goldman Sachs | Maintain | Buy | 2025-11-28 |
| JP Morgan | Maintain | Overweight | 2025-11-26 |
| Morgan Stanley | Maintain | Overweight | 2025-11-26 |
| B of A Securities | Maintain | Buy | 2025-11-26 |
| Northland Capital Markets | Maintain | Market Perform | 2025-11-26 |
| Keybanc | Maintain | Overweight | 2025-11-26 |
| Piper Sandler | Maintain | Overweight | 2025-11-26 |
Which company has the best grades?
Microsoft consistently receives strong buy and outperform ratings from multiple leading firms. Nutanix shows mixed signals with recent downgrades to equal weight from key institutions. This divergence may influence investor sentiment and portfolio weighting decisions.
Risks specific to each company
The following categories identify the critical pressure points and systemic threats facing both firms in the 2026 market environment:
1. Market & Competition
Microsoft Corporation
- Dominates with vast cloud and software ecosystem, but faces intense competition from AWS and Google Cloud.
Nutanix, Inc.
- Competes in niche enterprise cloud platform market, challenged by larger players with broader offerings.
2. Capital Structure & Debt
Microsoft Corporation
- Maintains low debt-to-equity (0.18), strong interest coverage (52.8x), signaling solid financial stability.
Nutanix, Inc.
- Higher debt-to-assets (45.2%) and weaker debt metrics increase financial risk despite favorable interest coverage (11.1x).
3. Stock Volatility
Microsoft Corporation
- Beta of 1.08 indicates market-level volatility, typical for tech giants.
Nutanix, Inc.
- Low beta (0.48) suggests less sensitivity to market swings but possibly lower liquidity and investor interest.
4. Regulatory & Legal
Microsoft Corporation
- Faces global antitrust scrutiny due to scale and market dominance, heightening regulatory risk.
Nutanix, Inc.
- Smaller scale reduces regulatory exposure, but evolving cloud regulations could impact operations.
5. Supply Chain & Operations
Microsoft Corporation
- Complex global supply chain for hardware and software services, mitigated by diversified sourcing.
Nutanix, Inc.
- Relies on third-party cloud infrastructure, making it vulnerable to partner disruptions.
6. ESG & Climate Transition
Microsoft Corporation
- Aggressive sustainability goals and investments enhance long-term resilience and investor appeal.
Nutanix, Inc.
- Emerging ESG initiatives but smaller scale limits impact and resources for climate transition.
7. Geopolitical Exposure
Microsoft Corporation
- Significant global footprint exposes it to trade tensions and geopolitical risks, especially US-China relations.
Nutanix, Inc.
- Primarily North America-focused, reducing geopolitical risk but limiting growth opportunities abroad.
Which company shows a better risk-adjusted profile?
Microsoft’s dominant market position and strong balance sheet offer a more resilient risk-adjusted profile. Nutanix faces higher financial and competitive risks despite potential growth in hybrid cloud solutions. Microsoft’s Altman Z-score (9.7) confirms financial safety versus Nutanix’s distress zone score (1.1). The greatest risk for Microsoft is regulatory pressure, while Nutanix’s financial distress risk stands out. This contrast justifies my caution favoring Microsoft for risk-conscious investors.
Final Verdict: Which stock to choose?
Microsoft’s superpower lies in its formidable cash generation and durable market presence. Its ability to consistently create value despite a slight ROIC decline shows resilience. A point of vigilance remains its lofty valuation multiples, which could pressure returns if growth slows. It suits portfolios targeting steady, long-term growth with moderate risk tolerance.
Nutanix’s strategic moat is its rapidly improving ROIC, signaling a strengthening competitive edge. It benefits from a focused cloud infrastructure niche and improving profitability metrics. Compared to Microsoft, Nutanix offers a more speculative profile with higher volatility but better growth acceleration potential. It fits growth-at-a-reasonable-price (GARP) investors willing to accept higher risk for upside.
If you prioritize stable, proven cash flow and broad market leadership, Microsoft is the compelling choice due to its strong income quality and financial safety. However, if you seek dynamic growth with a rising moat and can tolerate elevated risk, Nutanix offers better upside potential despite current financial fragilities. Both represent analytical scenarios tailored to distinct investor profiles.
Disclaimer: Investment carries a risk of loss of initial capital. The past performance is not a reliable indicator of future results. Be sure to understand risks before making an investment decision.
Go Further
I encourage you to read the complete analyses of Microsoft Corporation and Nutanix, Inc. to enhance your investment decisions: