Home > Comparison > Technology > MSFT vs MDB
The strategic rivalry between Microsoft Corporation and MongoDB, Inc. shapes the evolution of the software infrastructure sector. Microsoft, a diversified technology giant, integrates cloud, productivity, and personal computing, while MongoDB specializes in scalable, cloud-native database platforms. This analysis contrasts Microsoft’s broad enterprise footprint with MongoDB’s focused innovation to identify which trajectory offers superior risk-adjusted returns for a diversified portfolio in 2026.
Table of contents
Companies Overview
Microsoft and MongoDB stand as pivotal forces in the software infrastructure sector, shaping cloud and database landscapes.
Microsoft Corporation: Global Software Infrastructure Giant
Microsoft dominates the software infrastructure market with a diverse revenue engine spanning cloud services, productivity software, and personal computing devices. Its 2026 strategy centers on expanding Azure cloud capabilities while integrating AI-driven solutions across enterprise and consumer segments. Microsoft leverages its extensive ecosystem to sustain competitive advantage and scale revenues across multiple verticals.
MongoDB, Inc.: Cloud-Native Database Innovator
MongoDB focuses on delivering a general purpose database platform with strong cloud-native credentials through MongoDB Atlas. Its revenue hinges on subscriptions to enterprise and cloud-hosted database services. In 2026, MongoDB targets growth via multi-cloud flexibility and hybrid deployment, emphasizing developer-friendly tools and professional services to capture expanding demand for scalable data management.
Strategic Collision: Similarities & Divergences
Both companies pursue cloud-based infrastructure but diverge in scope and scale. Microsoft’s integrated ecosystem contrasts with MongoDB’s open, developer-centric platform. Their primary battleground lies in cloud services, where Microsoft’s breadth meets MongoDB’s specialization in database management. Investors face distinct profiles: Microsoft offers broad diversification and scale, while MongoDB presents focused growth in a niche but rapidly evolving market.
Income Statement Comparison
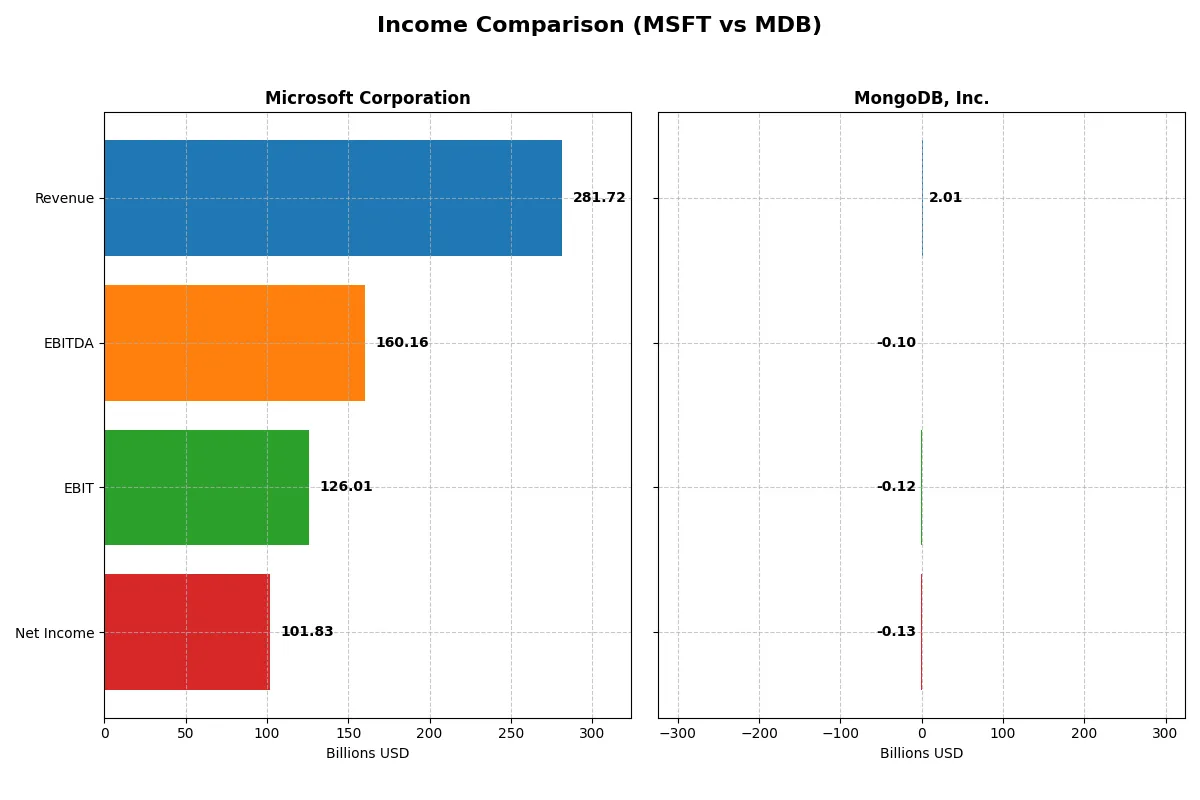
This data dissects the core profitability and scalability of both corporate engines to reveal who dominates the bottom line:
| Metric | Microsoft Corporation (MSFT) | MongoDB, Inc. (MDB) |
|---|---|---|
| Revenue | 282B | 2.01B |
| Cost of Revenue | 87.8B | 535M |
| Operating Expenses | 65.4B | 1.69B |
| Gross Profit | 194B | 1.47B |
| EBITDA | 160B | -97M |
| EBIT | 126B | -124M |
| Interest Expense | 2.39B | 8.1M |
| Net Income | 102B | -129M |
| EPS | 13.7 | -1.73 |
| Fiscal Year | 2025 | 2025 |
Income Statement Analysis: The Bottom-Line Duel
This income statement comparison unveils how efficiently Microsoft and MongoDB convert revenue into profit, revealing their corporate engines’ true strength.
Microsoft Corporation Analysis
Microsoft’s revenue grew steadily from $168B in 2021 to $282B in 2025, while net income rose from $61B to $102B. Gross margin remains robust at 68.8%, with a net margin of 36.1%, underscoring strong cost control and profitability. The 2025 fiscal year highlights solid momentum with a 14.9% revenue jump and a 15.6% EPS increase, confirming operational efficiency.
MongoDB, Inc. Analysis
MongoDB’s revenue surged from $590M in 2021 to $2B in 2025, reflecting rapid growth. However, the company still posts net losses, though the deficit narrowed from -$267M to -$129M. Its gross margin is favorable at 73.3%, but a negative net margin of -6.4% signals ongoing challenges in profitability. The latest year shows promising momentum with a 19.2% revenue increase and a 30.2% EPS improvement despite losses.
Profitability Giants vs. Growth Challenger
Microsoft dominates with scale and consistent profitability, boasting a strong net margin and expanding earnings. MongoDB impresses with faster revenue growth and improving margins but remains unprofitable. For investors, Microsoft offers a proven, efficient profit machine, while MongoDB presents a high-growth story still seeking sustainable profitability.
Financial Ratios Comparison
These vital ratios act as a diagnostic tool to expose the underlying fiscal health, valuation premiums, and capital efficiency of each company:
| Ratios | Microsoft Corporation (MSFT) | MongoDB, Inc. (MDB) |
|---|---|---|
| ROE | 29.6% | -4.6% |
| ROIC | 22.0% | -7.4% |
| P/E | 36.3 | -157.9 |
| P/B | 10.8 | 7.3 |
| Current Ratio | 1.35 | 5.20 |
| Quick Ratio | 1.35 | 5.20 |
| D/E (Debt-to-Equity) | 0.18 | 0.01 |
| Debt-to-Assets | 9.8% | 1.1% |
| Interest Coverage | 53.9 | -26.7 |
| Asset Turnover | 0.46 | 0.58 |
| Fixed Asset Turnover | 1.23 | 24.8 |
| Payout ratio | 23.6% | 0 |
| Dividend yield | 0.65% | 0 |
| Fiscal Year | 2025 | 2025 |
Efficiency & Valuation Duel: The Vital Signs
Financial ratios act as a company’s DNA, exposing hidden risks and operational strengths crucial for investment decisions.
Microsoft Corporation
Microsoft demonstrates robust profitability with a 29.65% ROE and a strong 36.15% net margin, reflecting operational excellence. Its valuation appears stretched, with a P/E of 36.31 and P/B of 10.76, above typical benchmarks. Microsoft returns value through modest dividends and reinvests heavily in R&D, fueling sustainable growth.
MongoDB, Inc.
MongoDB shows negative profitability metrics: a -4.64% ROE and -6.43% net margin signal ongoing losses. The P/E ratio is negative, reflecting these losses, but the P/B ratio of 7.32 suggests a premium on book value. The company refrains from dividends, focusing on aggressive R&D investment to drive future expansion.
Profitability Strength vs. Growth Gambit
Microsoft offers a solid balance of profitability and reasonable risk despite a premium valuation. MongoDB’s profile suits investors prioritizing growth over immediate returns, accepting operational losses and higher uncertainty. Conservative investors likely favor Microsoft’s proven efficiency and shareholder returns.
Which one offers the Superior Shareholder Reward?
I see Microsoft offers a consistent dividend yield near 0.65% with a sustainable payout ratio around 24%. Its buyback program is significant, enhancing total shareholder return. MongoDB pays no dividends, focusing on reinvesting cash into growth and R&D, with very limited free cash flow and no buybacks. Microsoft’s balanced distribution model delivers more reliable, long-term shareholder value in 2026.
Comparative Score Analysis: The Strategic Profile
The radar chart reveals the fundamental DNA and trade-offs of both firms, highlighting their financial strengths and valuation nuances:
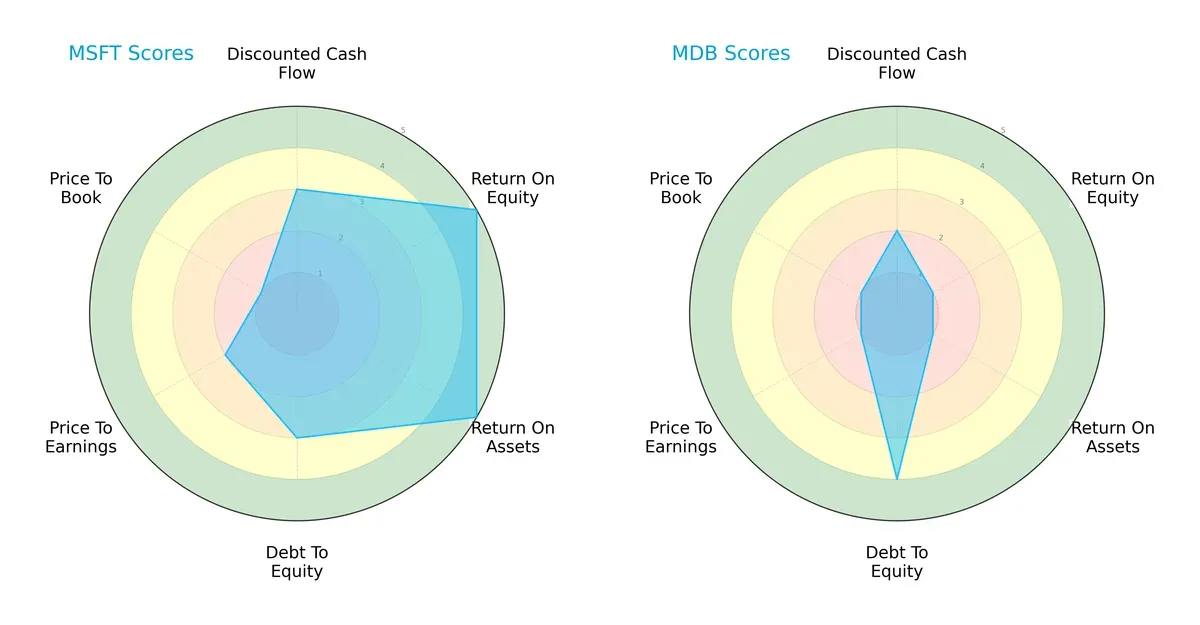
Microsoft dominates in profitability metrics with top ROE and ROA scores (5 each), reflecting efficient asset and equity utilization. MongoDB leans on a stronger debt-to-equity position (score 4), signaling conservative leverage management. However, Microsoft shows a more balanced profile across DCF (3), leverage (3), and valuations, while MongoDB relies heavily on financial stability rather than earnings efficiency. MongoDB’s low valuation scores (PE and PB both 1) suggest market skepticism or undervaluation, but this comes with risk.
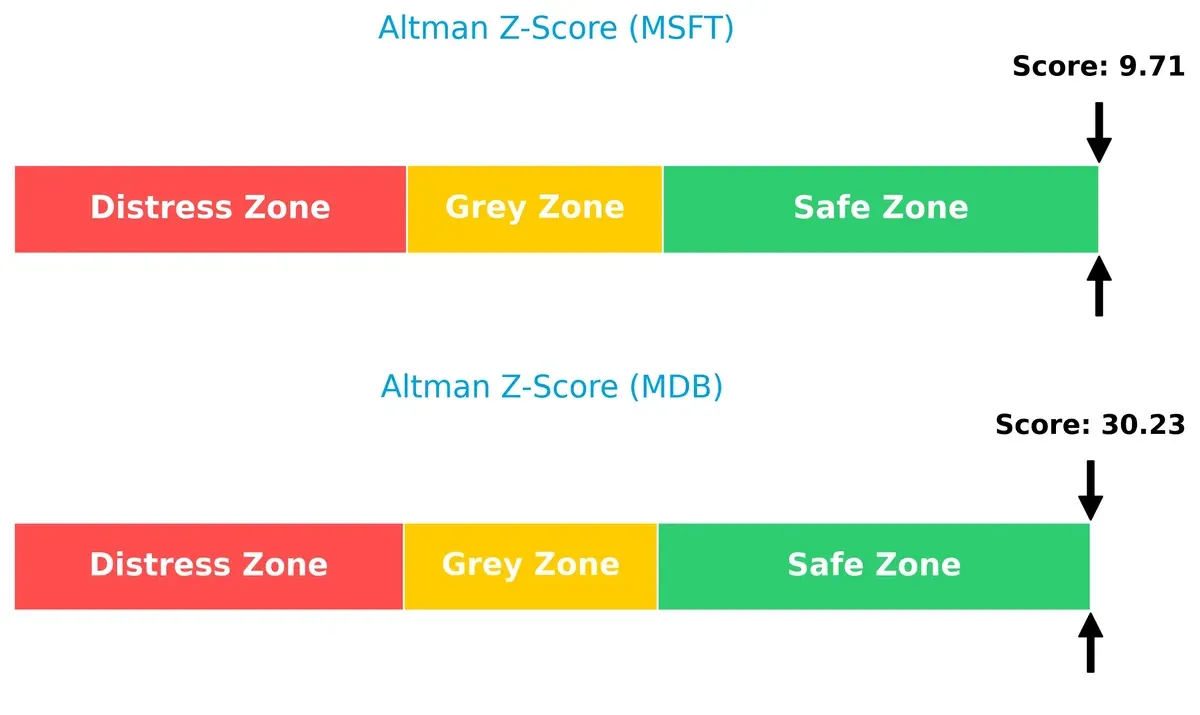
Bankruptcy Risk: Solvency Showdown
Microsoft’s Altman Z-Score of 9.7 versus MongoDB’s 30.2 indicates both firms are in the safe zone, but MongoDB’s score suggests an exceptionally robust solvency buffer in this cycle:
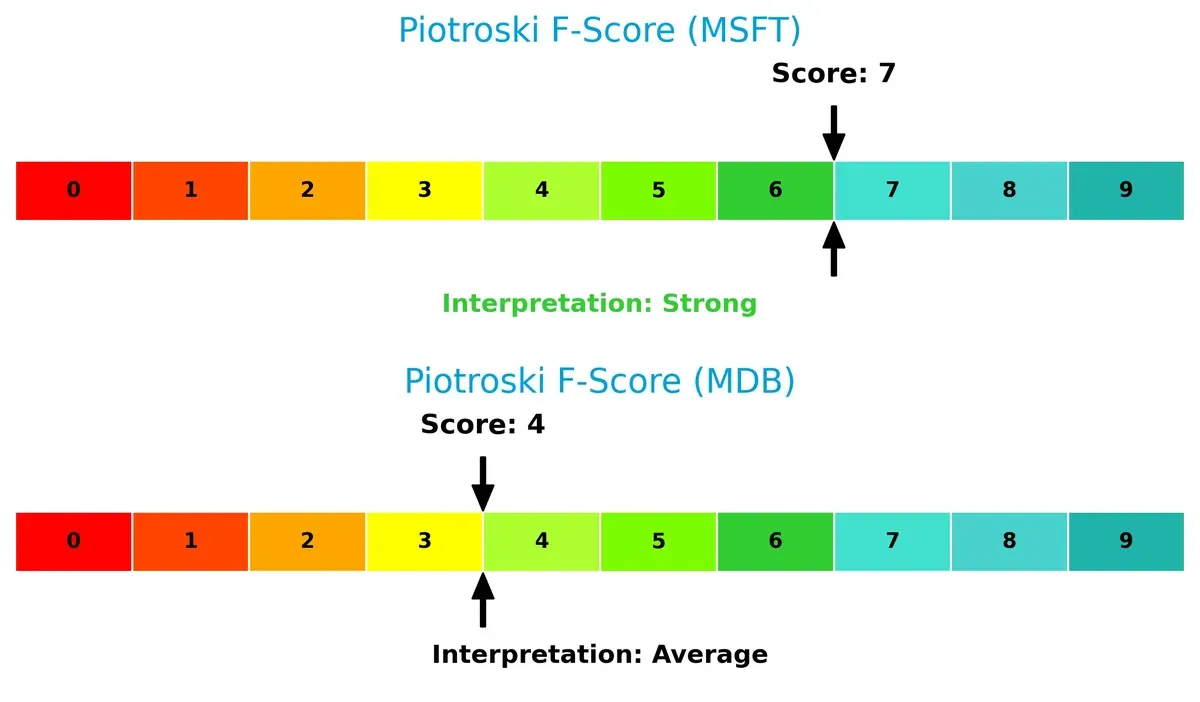
Financial Health: Quality of Operations
Microsoft’s Piotroski F-Score of 7 signals strong financial health and operational quality, while MongoDB’s 4 reveals moderate strength but potential internal red flags in efficiency or profitability metrics:
How are the two companies positioned?
This section dissects the operational DNA of Microsoft and MongoDB by comparing their revenue distribution and internal dynamics. The goal is to confront their economic moats to reveal which business model delivers the most resilient and sustainable competitive advantage today.
Revenue Segmentation: The Strategic Mix
This visual comparison dissects how Microsoft Corporation and MongoDB, Inc. diversify their income streams and where their primary sector bets lie:
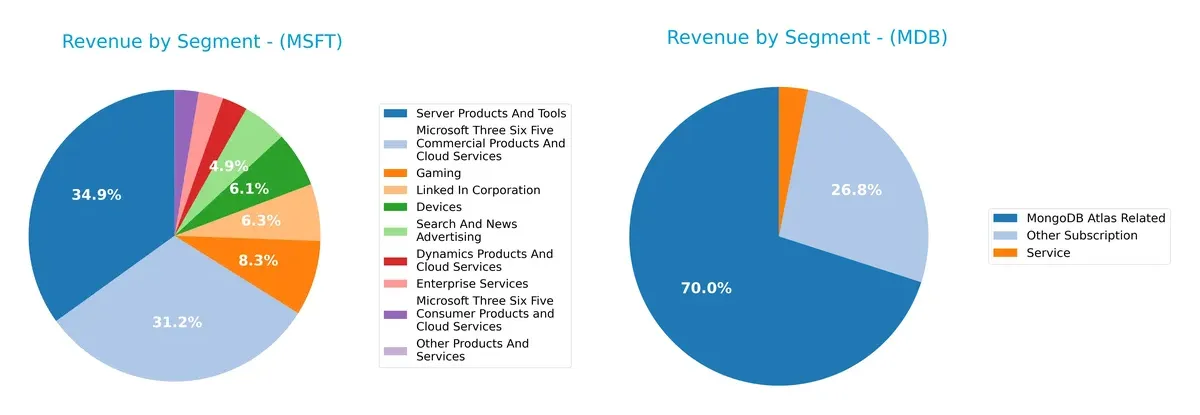
Microsoft dwarfs MongoDB in scale with a broad portfolio spanning Server Products ($98.4B), Microsoft 365 Commercial ($87.8B), and Gaming ($23.5B). MongoDB relies heavily on its MongoDB Atlas Related segment ($1.4B), anchoring most revenue. Microsoft’s diverse mix reduces concentration risk and signals ecosystem lock-in, while MongoDB’s focus on cloud database services highlights growth potential but with higher dependency and vulnerability to shifts in subscription demand.
Strengths and Weaknesses Comparison
This table compares the Strengths and Weaknesses of Microsoft Corporation and MongoDB, Inc.:
Microsoft Strengths
- Highly diversified revenue streams across cloud, gaming, enterprise services, and devices
- Strong global presence with substantial US and non-US revenues
- Favorable profitability ratios including 36.15% net margin and 29.65% ROE
- Solid financial health with low debt and strong interest coverage
- Innovation reflected in cloud services and Microsoft 365 dominance
MongoDB Strengths
- Focused subscription-based revenue growth with MongoDB Atlas as core product
- Favorable quick ratio indicating good short-term liquidity
- Very low debt levels supporting financial flexibility
- High fixed asset turnover suggests efficient use of fixed assets
- PE ratio indicates market expectations for growth
Microsoft Weaknesses
- Unfavorable valuation metrics with high PE (36.31) and PB (10.76) ratios
- Relatively low asset turnover (0.46) may limit operational efficiency
- Dividend yield is low at 0.65%, less attractive for income investors
- Neutral current ratio suggests moderate short-term liquidity risk
MongoDB Weaknesses
- Negative profitability metrics with -6.43% net margin and -4.64% ROE
- Unfavorable WACC of 10.36% indicating higher capital costs
- Current ratio very high at 5.2 but marked unfavorable, may signal inefficiency
- Negative interest coverage (-15.26) poses significant financial risk
- No dividend yield, limiting appeal to income-focused investors
Microsoft’s diversified business model and strong profitability underscore its market power despite valuation concerns. MongoDB’s focused growth and low leverage provide agility but profitability and financial risks remain critical challenges.
The Moat Duel: Analyzing Competitive Defensibility
A structural moat protects long-term profits from competitors’ erosion. Without it, market share and pricing power quickly dissolve:
Microsoft Corporation: Ecosystem Lock-in and Intangible Assets
Microsoft’s moat stems from a vast ecosystem integrating Office 365, Azure, and Windows, creating high switching costs. This drives stable margins and a 44.7% EBIT margin in 2025. However, its 7.5% declining ROIC trend signals pressure to innovate and defend cloud dominance in 2026.
MongoDB, Inc.: Innovation-Driven Growth with Emerging Network Effects
MongoDB leverages cutting-edge database technology and growing Atlas cloud adoption. Unlike Microsoft’s entrenched ecosystem, MongoDB’s moat is nascent, reflected in its negative ROIC vs. WACC but a steep 63% ROIC growth. This suggests rising profitability potential as it expands multi-cloud services in 2026.
Ecosystem Lock-in vs. Innovation Momentum
Microsoft’s ecosystem lock-in offers a wider moat with consistent value creation despite a slight profitability decline. MongoDB’s innovation momentum shows promise but remains a narrower moat, less able to fend off entrenched giants. Microsoft is better positioned to defend its market share long-term.
Which stock offers better returns?
The past 12 months reveal divergent dynamics: Microsoft edges a modest 1.67% gain with slowing momentum, while MongoDB surges 4.85%, accelerating sharply amid heightened buyer interest.
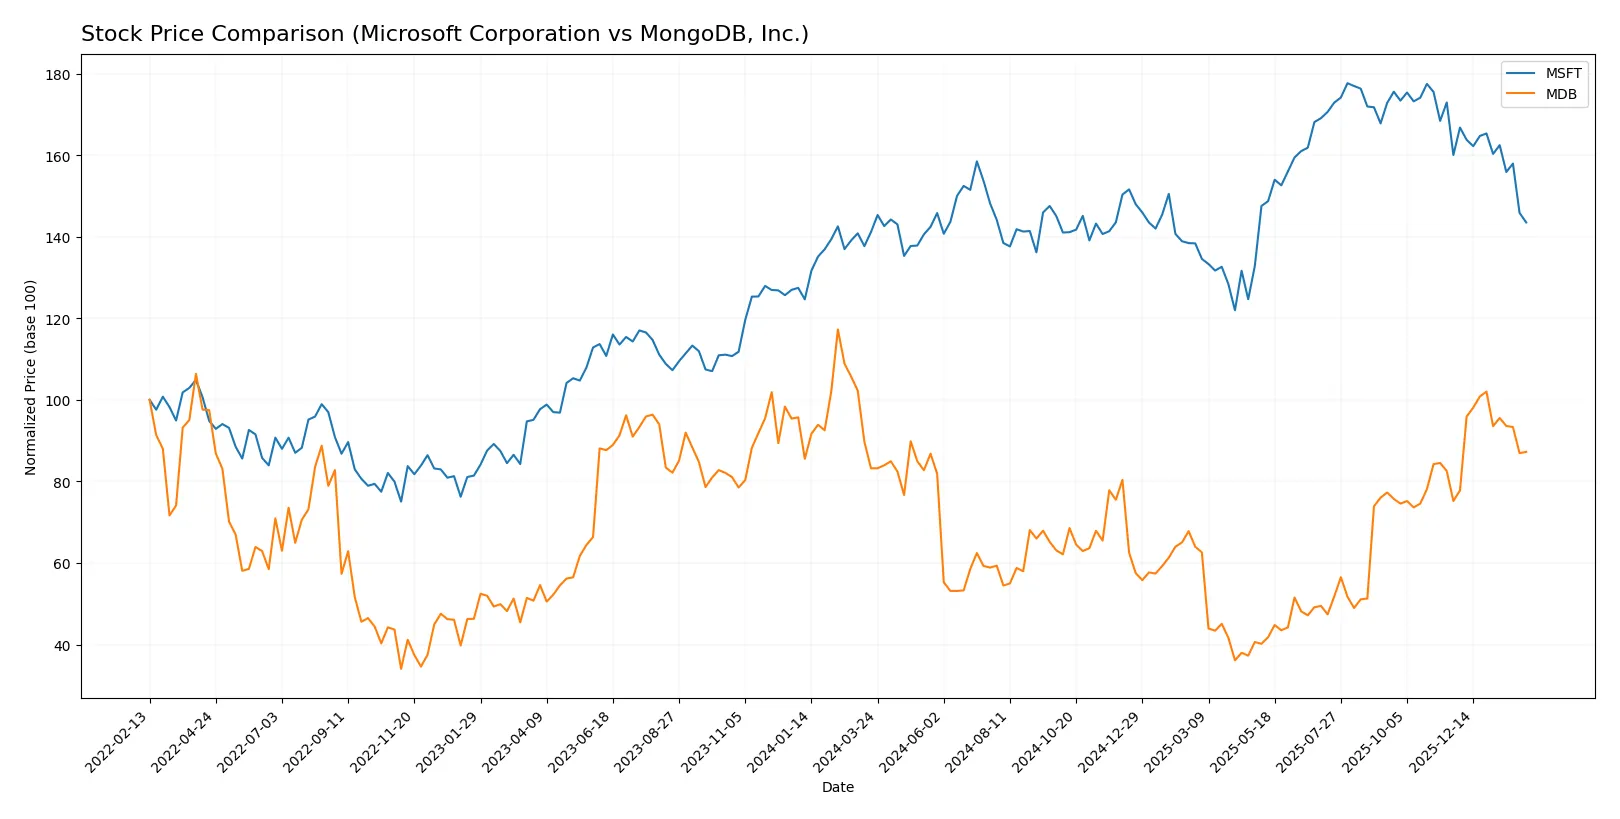
Trend Comparison
Microsoft’s stock rose 1.67% over the last year, signaling a bullish yet decelerating trend. It peaked at 524.11 and troughed at 359.84, showing moderate volatility (std dev 41.8).
MongoDB’s price climbed 4.85%, confirming a bullish trend with accelerating momentum. Its range spans 154.39 to 435.85, reflecting higher volatility (std dev 70.16) and stronger recent growth.
Comparing both, MongoDB outperformed Microsoft with a larger overall gain and accelerating trend, delivering the highest market returns over the past 12 months.
Target Prices
Analysts show a bullish outlook with notable upside potential for both Microsoft Corporation and MongoDB, Inc.
| Company | Target Low | Target High | Consensus |
|---|---|---|---|
| Microsoft Corporation | 450 | 675 | 600.04 |
| MongoDB, Inc. | 375 | 500 | 445.2 |
Microsoft trades at 423.37, well below the 600.04 consensus, signaling substantial upside. MongoDB’s current price of 372.68 also lies beneath its 445.2 consensus, suggesting room for growth.

Don’t Let Luck Decide Your Entry Point
Optimize your entry points with our advanced ProRealTime indicators. You’ll get efficient buy signals with precise price targets for maximum performance. Start outperforming now!
How do institutions grade them?
Microsoft Corporation Grades
The table below summarizes recent institutional grades for Microsoft Corporation.
| Grading Company | Action | New Grade | Date |
|---|---|---|---|
| Citigroup | Maintain | Buy | 2026-01-30 |
| Scotiabank | Maintain | Sector Outperform | 2026-01-29 |
| Wells Fargo | Maintain | Overweight | 2026-01-29 |
| RBC Capital | Maintain | Outperform | 2026-01-29 |
| Stifel | Maintain | Buy | 2026-01-29 |
| Evercore ISI Group | Maintain | Outperform | 2026-01-29 |
| Keybanc | Maintain | Overweight | 2026-01-29 |
| Piper Sandler | Maintain | Overweight | 2026-01-29 |
| DA Davidson | Maintain | Buy | 2026-01-29 |
| Cantor Fitzgerald | Maintain | Overweight | 2026-01-29 |
MongoDB, Inc. Grades
The following table displays institutional grades for MongoDB, Inc.
| Grading Company | Action | New Grade | Date |
|---|---|---|---|
| Needham | Maintain | Buy | 2026-01-20 |
| Needham | Maintain | Buy | 2026-01-12 |
| Barclays | Maintain | Overweight | 2026-01-12 |
| Truist Securities | Maintain | Buy | 2026-01-07 |
| Needham | Maintain | Buy | 2026-01-06 |
| RBC Capital | Maintain | Outperform | 2026-01-05 |
| Argus Research | Maintain | Buy | 2025-12-04 |
| Goldman Sachs | Maintain | Buy | 2025-12-03 |
| Citigroup | Maintain | Buy | 2025-12-03 |
| Mizuho | Maintain | Neutral | 2025-12-02 |
Which company has the best grades?
Microsoft receives consistently strong grades from multiple top-tier institutions, mostly “Buy,” “Outperform,” or “Overweight.” MongoDB also shows strong ratings but includes one “Neutral.” Microsoft’s broader institutional confidence may indicate greater market trust, potentially impacting investor perception and stability expectations.
Risks specific to each company
The following categories identify the critical pressure points and systemic threats facing both firms in the 2026 market environment:
1. Market & Competition
Microsoft Corporation
- Dominates with a $3.14T market cap and diversified software segments. Faces intense competition but benefits from scale and ecosystem moats.
MongoDB, Inc.
- Smaller $30.3B market cap with niche focus in database platforms, facing aggressive competition from larger cloud and software players.
2. Capital Structure & Debt
Microsoft Corporation
- Maintains low debt-to-equity (0.18) and strong interest coverage (52.8x), signaling prudent leverage management.
MongoDB, Inc.
- Almost debt-free (D/E 0.01) but negative interest coverage (-15.3x) reflects unprofitable operations and riskier capital structure.
3. Stock Volatility
Microsoft Corporation
- Beta of 1.07 indicates market-aligned volatility, providing relative stability within the tech sector.
MongoDB, Inc.
- Higher beta of 1.38 signals greater sensitivity to market swings, increasing risk for investors.
4. Regulatory & Legal
Microsoft Corporation
- Faces ongoing antitrust scrutiny globally but has strong legal defenses due to size and compliance infrastructure.
MongoDB, Inc.
- Regulatory risks include data privacy and cloud security compliance, with less legal resource depth than larger peers.
5. Supply Chain & Operations
Microsoft Corporation
- Benefits from established global supply chains and diversified product lines, mitigating operational disruptions.
MongoDB, Inc.
- Relies on cloud infrastructure providers; operational risks linked to third-party dependencies and scaling challenges.
6. ESG & Climate Transition
Microsoft Corporation
- Invests heavily in sustainability initiatives and carbon neutrality, enhancing stakeholder trust and regulatory compliance.
MongoDB, Inc.
- ESG efforts are emerging but less advanced, presenting potential reputational and regulatory risks as ESG standards tighten.
7. Geopolitical Exposure
Microsoft Corporation
- Global footprint exposes it to geopolitical tensions, but diversified markets reduce dependency risks.
MongoDB, Inc.
- Primarily US-based with growing international sales, vulnerable to trade policy shifts and geopolitical uncertainties.
Which company shows a better risk-adjusted profile?
Microsoft’s dominant market position, strong balance sheet, and diversified operations create a superior risk-adjusted profile. MongoDB’s elevated volatility, unprofitable status, and weaker ESG maturity heighten its risk profile. Microsoft’s Altman Z-score of 9.7 confirms financial safety, while MongoDB’s 30.2 score, though high, aligns with growth-stage volatility. Microsoft’s moderate valuation metrics contrast with MongoDB’s unfavorable ratios, underscoring prudent capital management. The critical risk for Microsoft lies in regulatory scrutiny, while MongoDB’s major challenge is sustained unprofitability amid competitive pressures.
Final Verdict: Which stock to choose?
Microsoft’s superpower lies in its unrivaled ability to generate consistent cash flows and deliver high returns on invested capital. Its slight margin pressure and rich valuation call for vigilance. This stock fits portfolios seeking steady, long-term growth with a proven economic moat.
MongoDB excels with a dynamic growth trajectory fueled by innovative technology and expanding market share. Its strategic moat is rooted in cloud database dominance and recurring revenue potential. It offers a higher risk profile but suits investors targeting aggressive growth with a tolerance for volatility.
If you prioritize durable value creation and stable returns, Microsoft is the compelling choice due to its strong cash generation and resilient moat. However, if you seek rapid expansion and can withstand earnings volatility, MongoDB offers superior growth potential and market agility, albeit with less financial certainty.
Disclaimer: Investment carries a risk of loss of initial capital. The past performance is not a reliable indicator of future results. Be sure to understand risks before making an investment decision.
Go Further
I encourage you to read the complete analyses of Microsoft Corporation and MongoDB, Inc. to enhance your investment decisions: