Micron Technology, Inc. (MU) and QUALCOMM Incorporated (QCOM) are two heavyweight players in the semiconductor industry, each driving innovation in memory solutions and wireless technologies. While Micron excels in memory and storage products, QUALCOMM leads in wireless communications and licensing. Their overlapping markets and cutting-edge strategies make them compelling choices for investors. In this article, I will help you decide which company offers the most promising investment opportunity.
Table of contents
Companies Overview
I will begin the comparison between Micron Technology and QUALCOMM by providing an overview of these two companies and their main differences.
Micron Technology Overview
Micron Technology, Inc. designs, manufactures, and sells memory and storage products worldwide. It serves diverse markets including cloud servers, enterprise, client devices, graphics, networking, smartphones, automotive, industrial, and consumer sectors. Founded in 1978 and headquartered in Boise, Idaho, Micron operates through four business units focused on DRAM, NAND, NOR, and other memory technologies, marketing products via direct sales and distribution channels.
QUALCOMM Overview
QUALCOMM Incorporated develops and commercializes foundational wireless technologies globally. Its three segments include Qualcomm CDMA Technologies (QCT), Technology Licensing (QTL), and Strategic Initiatives (QSI). The company focuses on integrated circuits and software for 3G/4G/5G communications, intellectual property licensing, and early-stage investments in emerging tech sectors. Established in 1985 and based in San Diego, California, QUALCOMM supports a broad wireless ecosystem.
Key similarities and differences
Both Micron and QUALCOMM operate in the semiconductor industry and are headquartered in the US with sizable workforces near 48-49K employees. Micron primarily focuses on memory and storage hardware components, while QUALCOMM specializes in wireless communication technologies and intellectual property licensing. Their business models differ significantly, with Micron producing physical memory solutions and QUALCOMM emphasizing technology development, licensing, and strategic investments.
Income Statement Comparison
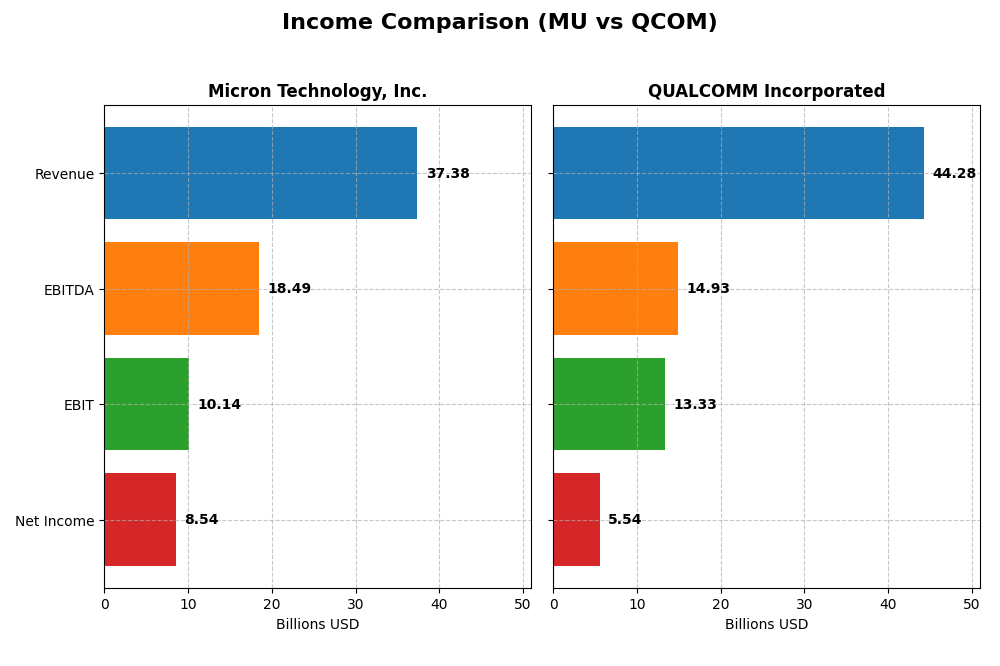
The table below compares the most recent fiscal year income statement metrics for Micron Technology, Inc. and QUALCOMM Incorporated, offering a snapshot of their financial performance.
| Metric | Micron Technology, Inc. | QUALCOMM Incorporated |
|---|---|---|
| Market Cap | 373B | 176B |
| Revenue | 37.38B | 44.28B |
| EBITDA | 18.49B | 14.93B |
| EBIT | 10.14B | 13.33B |
| Net Income | 8.54B | 5.54B |
| EPS | 7.65 | 5.06 |
| Fiscal Year | 2025 | 2025 |
Income Statement Interpretations
Micron Technology, Inc.
Micron Technology demonstrated strong revenue growth, rising from $27.7B in 2021 to $37.4B in 2025, with net income increasing from $5.9B to $8.5B. Margins improved consistently, with a gross margin near 40% and net margin reaching 22.8% in 2025. The latest year showed significant profitability gains and margin expansion, reflecting operational efficiency and favorable market conditions.
QUALCOMM Incorporated
QUALCOMM’s revenue grew steadily from $33.6B in 2021 to $44.3B in 2025, while net income declined from $9.0B to $5.5B over the same period. Despite stable gross and EBIT margins above 30%, net margin weakened to 12.5% in 2025. The most recent year saw revenue growth slow to 13.7%, with net income and EPS falling sharply, signaling margin pressure and rising expenses.
Which one has the stronger fundamentals?
Micron exhibits stronger fundamentals with consistent revenue and net income growth, improved margins, and favorable profitability trends. QUALCOMM, while maintaining solid gross and EBIT margins, faces declining net income and EPS, along with weaker net margin growth. Overall, Micron’s income statement shows more robust expansion and margin improvement, indicating comparatively stronger financial health.
Financial Ratios Comparison
The table below presents the most recent financial ratios for Micron Technology, Inc. (MU) and QUALCOMM Incorporated (QCOM) based on their fiscal year 2025 data, offering a clear comparison of key performance and financial health indicators.
| Ratios | Micron Technology, Inc. (MU) | QUALCOMM Incorporated (QCOM) |
|---|---|---|
| ROE | 15.8% | 26.1% |
| ROIC | 12.1% | 13.2% |
| P/E | 15.9 | 32.7 |
| P/B | 2.51 | 8.54 |
| Current Ratio | 2.52 | 2.82 |
| Quick Ratio | 1.79 | 2.10 |
| D/E (Debt-to-Equity) | 0.28 | 0.70 |
| Debt-to-Assets | 18.5% | 29.5% |
| Interest Coverage | 20.7 | 18.6 |
| Asset Turnover | 0.45 | 0.88 |
| Fixed Asset Turnover | 0.79 | 9.44 |
| Payout ratio | 6.1% | 68.7% |
| Dividend yield | 0.38% | 2.10% |
Interpretation of the Ratios
Micron Technology, Inc.
Micron shows strong profitability with a net margin of 22.84% and a favorable return on equity of 15.76%. Its liquidity is solid, evidenced by a current ratio of 2.52, while leverage remains low with a debt-to-equity ratio of 0.28. However, asset turnover ratios are weak, indicating less efficient use of assets. The dividend yield is low at 0.38%, suggesting modest shareholder returns.
QUALCOMM Incorporated
QUALCOMM’s ratios indicate robust profitability, including a 26.13% return on equity and a 12.51% net margin. Liquidity is strong with a current ratio of 2.82, and interest coverage remains high at 20.07. Its price multiples are high, with a P/E of 32.7 and P/B of 8.54, which may raise valuation concerns. The dividend yield is attractive at 2.1%, supporting shareholder income.
Which one has the best ratios?
Both companies present a favorable overall ratios evaluation, yet QUALCOMM edges slightly ahead with a higher proportion of favorable ratios (64.29% vs. 57.14%) and stronger returns on equity and capital employed. Micron’s lower asset efficiency and dividend yield contrast with QUALCOMM’s higher valuation multiples, creating a balanced trade-off between profitability, efficiency, and shareholder returns.
Strategic Positioning
This section compares the strategic positioning of Micron Technology, Inc. and QUALCOMM Incorporated, including Market position, Key segments, and disruption:
Micron Technology, Inc.
- Large market cap of 373B in semiconductors with high beta, facing competitive pressure in memory markets.
- Focused on memory and storage products: DRAM, NAND, NOR across compute, mobile, storage, and embedded segments.
- Exposure to technological disruption through memory innovation but less emphasis on licensing or early-stage tech investments.
QUALCOMM Incorporated
- Market cap of 176B in wireless semiconductor tech, moderate beta, competes in integrated circuits and licensing.
- Diversified wireless tech with segments in chipsets (QCT), IP licensing (QTL), and strategic investments (QSI).
- Faces disruption from evolving wireless standards; invests in 5G, AI, automotive, IoT via QSI segment.
Micron Technology, Inc. vs QUALCOMM Incorporated Positioning
Micron’s approach centers on diversified memory product lines serving various markets, while QUALCOMM integrates chipset sales with IP licensing and strategic investments. Micron benefits from product breadth; QUALCOMM leverages intellectual property and innovation investments.
Which has the best competitive advantage?
Both companies show a slightly favorable moat. QUALCOMM creates value with ROIC above WACC but faces declining profitability, while Micron’s ROIC growth is positive though it currently sheds value, indicating differing sustainability of competitive advantages.
Stock Comparison
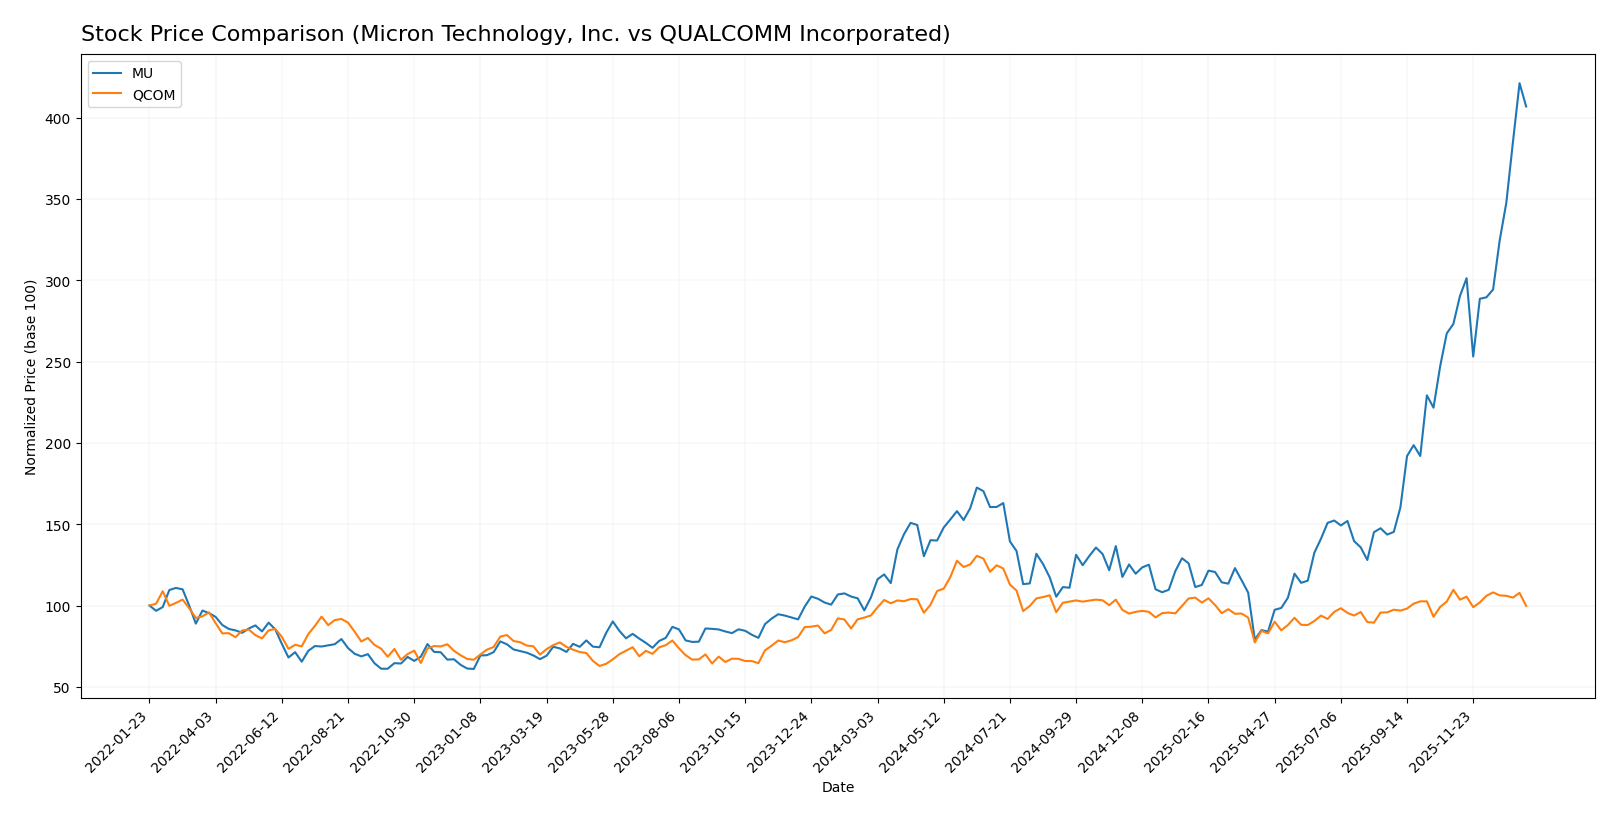
The stock prices of Micron Technology, Inc. (MU) and QUALCOMM Incorporated (QCOM) have exhibited distinct bullish trends over the past 12 months, with MU showing significant acceleration and greater volatility compared to QCOM.
Trend Analysis
Micron Technology, Inc. (MU) experienced a strong bullish trend over the past year, with a 287.62% price increase and accelerating momentum. The stock showed high volatility, with prices ranging from 64.72 to 345.09.
QUALCOMM Incorporated (QCOM) also followed a bullish trend with a 6.22% gain over the same period and acceleration present, but with lower volatility and a narrower price range between 127.46 and 215.33.
Comparing both stocks, MU delivered the highest market performance with significantly stronger price appreciation and buyer dominance, outperforming QCOM’s more moderate gains.
Target Prices
The current analyst consensus suggests moderate upside potential for both Micron Technology, Inc. and QUALCOMM Incorporated.
| Company | Target High | Target Low | Consensus |
|---|---|---|---|
| Micron Technology, Inc. | 450 | 190 | 328.22 |
| QUALCOMM Incorporated | 210 | 165 | 185.71 |
Analysts expect Micron’s price to be close to its current price of $333.35, indicating fair valuation, while QUALCOMM’s consensus target of $185.71 suggests upside from the current $164.54 market price.
Analyst Opinions Comparison
This section compares analysts’ ratings and scores for Micron Technology, Inc. (MU) and QUALCOMM Incorporated (QCOM):
Rating Comparison
MU Rating
- Rating: B, indicated as Very Favorable by analysts.
- Discounted Cash Flow Score: 1, considered Very Unfavorable for valuation.
- ROE Score: 4, indicating a Favorable return on equity performance.
- ROA Score: 5, indicating a Very Favorable asset utilization efficiency.
- Debt To Equity Score: 3, signaling a Moderate financial risk level.
- Overall Score: 3, reflecting a Moderate overall financial standing.
QCOM Rating
- Rating: B+, indicated as Very Favorable by analysts.
- Discounted Cash Flow Score: 4, considered Favorable for valuation.
- ROE Score: 5, indicating a Very Favorable return on equity performance.
- ROA Score: 5, indicating a Very Favorable asset utilization efficiency.
- Debt To Equity Score: 1, signaling a Very Unfavorable financial risk level.
- Overall Score: 3, reflecting a Moderate overall financial standing.
Which one is the best rated?
Based on the provided data, QCOM holds a slightly better rating (B+) compared to MU’s B. QCOM also scores higher in discounted cash flow and return on equity, while MU has a better debt-to-equity score. Both have equal overall scores.
Scores Comparison
The scores comparison between Micron Technology, Inc. and QUALCOMM Incorporated is as follows:
MU Scores
- Altman Z-Score: 10.5, indicating a safe zone with very low bankruptcy risk.
- Piotroski Score: 7, reflecting strong financial health and value potential.
QCOM Scores
- Altman Z-Score: 6.37, also in the safe zone with low bankruptcy risk.
- Piotroski Score: 7, reflecting strong financial health and value potential.
Which company has the best scores?
Both MU and QCOM are in the Altman Z-Score safe zone, with MU showing a higher score. Their Piotroski Scores are identical at 7, indicating equally strong financial health based on the provided data.
Grades Comparison
Here is a detailed comparison of the latest grades assigned to Micron Technology, Inc. and QUALCOMM Incorporated:
Micron Technology, Inc. Grades
The table below summarizes recent grades and actions from reliable grading companies for Micron Technology, Inc.:
| Grading Company | Action | New Grade | Date |
|---|---|---|---|
| Keybanc | Maintain | Overweight | 2026-01-13 |
| B of A Securities | Maintain | Buy | 2026-01-13 |
| Lynx Global | Maintain | Buy | 2026-01-12 |
| Mizuho | Maintain | Outperform | 2026-01-09 |
| UBS | Maintain | Buy | 2026-01-07 |
| Piper Sandler | Maintain | Overweight | 2026-01-07 |
| Piper Sandler | Maintain | Overweight | 2025-12-18 |
| Barclays | Maintain | Overweight | 2025-12-18 |
| Keybanc | Maintain | Overweight | 2025-12-18 |
| Wolfe Research | Maintain | Outperform | 2025-12-18 |
Micron Technology’s grades consistently lean towards positive ratings such as Buy, Overweight, and Outperform, with no recent downgrades.
QUALCOMM Incorporated Grades
The table below presents recent grades and actions from reputable grading companies for QUALCOMM Incorporated:
| Grading Company | Action | New Grade | Date |
|---|---|---|---|
| Mizuho | Downgrade | Neutral | 2026-01-09 |
| Rosenblatt | Maintain | Buy | 2025-11-06 |
| B of A Securities | Maintain | Buy | 2025-11-06 |
| Mizuho | Maintain | Outperform | 2025-11-06 |
| Wells Fargo | Maintain | Underweight | 2025-11-06 |
| Piper Sandler | Maintain | Overweight | 2025-11-06 |
| UBS | Maintain | Neutral | 2025-11-06 |
| JP Morgan | Maintain | Overweight | 2025-11-04 |
| Citigroup | Maintain | Neutral | 2025-10-28 |
| Rosenblatt | Maintain | Buy | 2025-10-28 |
QUALCOMM’s ratings include a mix of Buy, Overweight, Neutral, and one recent downgrade from Outperform to Neutral by Mizuho, indicating some cautious sentiment among analysts.
Which company has the best grades?
Micron Technology holds a stronger consensus with multiple Overweight and Buy grades and no recent downgrades, while QUALCOMM shows a more mixed rating profile including a recent downgrade. This suggests Micron’s outlook is more uniformly positive, potentially impacting investor confidence differently.
Strengths and Weaknesses
Below is a comparison of key strengths and weaknesses for Micron Technology, Inc. (MU) and QUALCOMM Incorporated (QCOM) based on recent financial and strategic data.
| Criterion | Micron Technology, Inc. (MU) | QUALCOMM Incorporated (QCOM) |
|---|---|---|
| Diversification | Focused on memory products (DRAM & NAND); limited product diversification | More diversified with segments like QCT (chipsets) and QTL (licensing) |
| Profitability | Net margin 22.8%, ROIC 12.1%, growing ROIC but slightly below WACC (value shedding) | Net margin 12.5%, ROIC 13.2%, ROIC above WACC (value creation) but declining |
| Innovation | Strong in memory tech innovation but less visible in broader semiconductor innovation | Strong R&D in wireless tech and chipsets; leading 5G and 6G tech development |
| Global presence | Significant global manufacturing and sales, mainly in memory markets | Global player in wireless tech, with broad OEM and licensee network worldwide |
| Market Share | Leading in DRAM and NAND memory markets but cyclical | Strong market share in mobile chipsets and intellectual property licensing |
Key takeaways: Micron excels in memory technology with improving profitability but faces challenges in diversification and value creation. QUALCOMM maintains value creation and strong innovation in wireless technologies but struggles with a declining ROIC trend. Investors should weigh MU’s growth potential against QCOM’s proven value but consider QCOM’s profitability risks.
Risk Analysis
The following table summarizes key risks for Micron Technology, Inc. (MU) and QUALCOMM Incorporated (QCOM) based on the latest data from 2025-2026.
| Metric | Micron Technology, Inc. (MU) | QUALCOMM Incorporated (QCOM) |
|---|---|---|
| Market Risk | High beta (1.503) indicates above-average market volatility exposure | Moderate beta (1.212) suggests moderate market sensitivity |
| Debt Level | Low debt-to-equity ratio (0.28), favorable leverage position | Moderate debt-to-equity ratio (0.7), moderate financial risk |
| Regulatory Risk | Potential semiconductor export controls and trade tensions | Exposure to global patent and licensing regulations |
| Operational Risk | Moderate asset turnover, possible efficiency challenges | Strong fixed asset turnover, lower operational risk |
| Environmental Risk | Industry exposure to energy consumption and e-waste concerns | Similar semiconductor industry environmental risks |
| Geopolitical Risk | US-China tensions impacting supply chains and sales | High sensitivity due to global supply chain and licensing |
Micron faces notable market risk due to higher volatility and geopolitical risk from supply chain exposures linked to US-China dynamics. QUALCOMM shows moderate market risk but carries regulatory risks tied to intellectual property and global licensing. Both companies maintain strong financial health with favorable debt profiles, but investors should closely monitor geopolitical developments and operational efficiency trends.
Which Stock to Choose?
Micron Technology, Inc. (MU) has shown a strong income growth with a 48.85% revenue increase in the last year and favorable profitability ratios such as a 22.84% net margin and 15.76% ROE. Its debt levels are low with a net debt to EBITDA of 0.30, and the overall rating is very favorable with a “B” grade.
QUALCOMM Incorporated (QCOM) exhibits steady income growth at 13.66% in the past year, strong profitability with a 26.13% ROE, and moderate debt with a net debt to EBITDA of 0.62. Its rating is very favorable, graded “B+”, with some unfavorable valuation ratios like a high P/E and P/B.
For risk-averse investors seeking stability and strong profitability, QUALCOMM might appear more favorable due to its consistent value creation despite a declining ROIC trend. Conversely, growth-oriented investors could see Micron’s accelerating income and improving profitability as attractive, given its slightly favorable moat and improving financial health.
Disclaimer: Investment carries a risk of loss of initial capital. The past performance is not a reliable indicator of future results. Be sure to understand risks before making an investment decision.
Go Further
I encourage you to read the complete analyses of Micron Technology, Inc. and QUALCOMM Incorporated to enhance your investment decisions: