In the fast-evolving semiconductor industry, QUALCOMM Incorporated (QCOM) and Microchip Technology Incorporated (MCHP) stand out as key players shaping innovation and market dynamics. Both companies specialize in advanced chip technologies, yet they target different applications and customer bases, from wireless communications to embedded control solutions. This comparison will help you uncover which company offers the most compelling investment opportunity in 2026. Let’s explore their strengths and risks together.
Table of contents
Companies Overview
I will begin the comparison between QUALCOMM and Microchip Technology by providing an overview of these two companies and their main differences.
QUALCOMM Overview
QUALCOMM Incorporated focuses on developing and commercializing foundational technologies for the global wireless industry. Its business operates through segments including Qualcomm CDMA Technologies, Technology Licensing, and Strategic Initiatives. The company is a major player in integrated circuits and system software for wireless communications, licensing intellectual property related to 3G, 4G, and 5G technologies, and invests in emerging tech sectors such as AI and IoT. QUALCOMM is headquartered in San Diego, CA.
Microchip Overview
Microchip Technology Incorporated develops, manufactures, and sells embedded control solutions worldwide, targeting automotive, industrial, computing, and communications sectors. It offers a broad portfolio including microcontrollers, microprocessors, analog products, memory, and FPGA devices. The company also provides development tools and manufacturing services. Headquartered in Chandler, AZ, Microchip serves diverse markets with a focus on secure, connected devices and specialized microcontrollers.
Key similarities and differences
Both QUALCOMM and Microchip operate within the semiconductor industry, focusing on technology innovation and product development. QUALCOMM emphasizes wireless communication technologies and intellectual property licensing, while Microchip concentrates on embedded control solutions and microcontroller products. QUALCOMM’s business model includes strategic investments and licensing revenue, whereas Microchip’s model centers more on manufacturing and development tools for embedded systems. Both companies serve global markets but have distinct product and service portfolios.
Income Statement Comparison
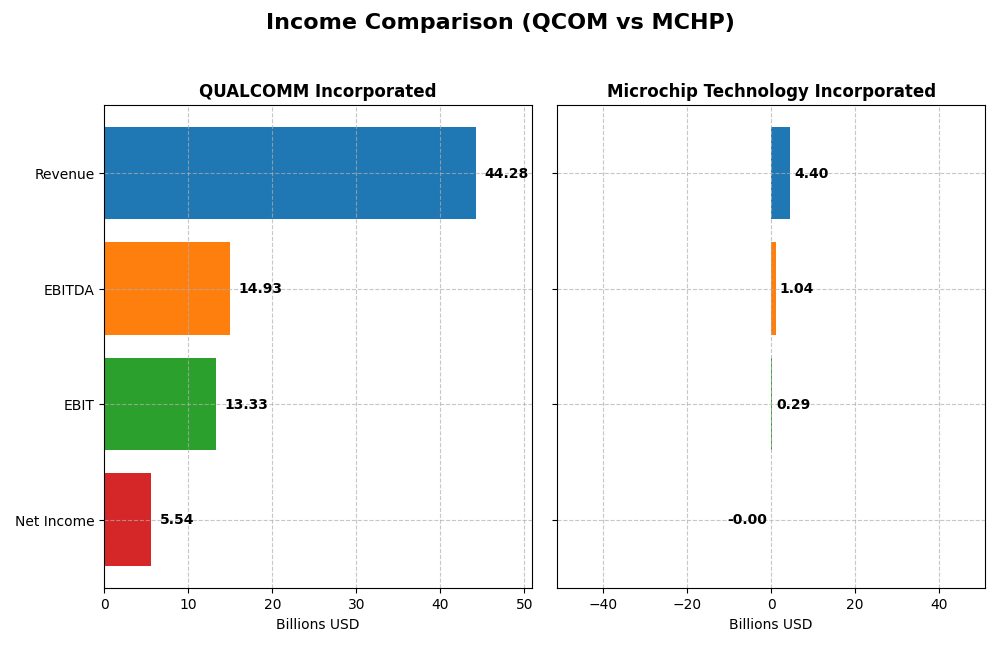
The table below compares key income statement metrics for QUALCOMM Incorporated and Microchip Technology Incorporated for their most recent fiscal years, highlighting their financial performance.
| Metric | QUALCOMM Incorporated (QCOM) | Microchip Technology Incorporated (MCHP) |
|---|---|---|
| Market Cap | 175.3B | 40.3B |
| Revenue | 44.3B | 4.4B |
| EBITDA | 14.9B | 1.0B |
| EBIT | 13.3B | 0.3B |
| Net Income | 5.5B | -0.5M |
| EPS | 5.06 | -0.005 |
| Fiscal Year | 2025 | 2025 |
Income Statement Interpretations
QUALCOMM Incorporated
QUALCOMM’s revenue showed a steady upward trend from $33.6B in 2021 to $44.3B in 2025, with an overall 31.93% growth. Net income, however, declined significantly by 38.73% over the same period, hitting $5.5B in 2025. Gross and EBIT margins remained favorable, around 55.4% and 30.1%, respectively. The 2025 fiscal year saw revenue growth of 13.66%, but net margin dropped sharply by 51.93%, signaling margin pressure despite top-line gains.
Microchip Technology Incorporated
Microchip’s revenue declined notably from $5.4B in 2021 to $4.4B in 2025, with a negative overall growth of 19.06%. Net income deteriorated drastically, turning negative at -$2.7M in 2025, representing a 100.14% fall over the period. While gross margin held steady at about 56.1%, EBIT margin was neutral at 6.6%, and net margin was unfavorable at -0.01%. The 2025 year exhibited steep declines in revenue (-42.35%) and net income, reflecting operational challenges.
Which one has the stronger fundamentals?
QUALCOMM demonstrates stronger fundamentals, with consistent revenue growth, solid gross and EBIT margins, and a favorable overall income statement evaluation despite recent net income declines. In contrast, Microchip faces considerable headwinds, marked by revenue and net income contraction and unfavorable margin trends. The broader positive margin and growth indicators favor QUALCOMM’s financial health over Microchip’s.
Financial Ratios Comparison
This table presents a side-by-side comparison of key financial ratios for QUALCOMM Incorporated and Microchip Technology Incorporated based on their most recent fiscal year data.
| Ratios | QUALCOMM Incorporated (QCOM) | Microchip Technology Incorporated (MCHP) |
|---|---|---|
| ROE | 26.13% | -0.01% |
| ROIC | 13.19% | -0.03% |
| P/E | 32.70 | -52021.39 |
| P/B | 8.54 | 3.67 |
| Current Ratio | 2.82 | 2.59 |
| Quick Ratio | 2.10 | 1.47 |
| D/E | 0.70 | 0.80 |
| Debt-to-Assets | 29.54% | 36.85% |
| Interest Coverage | 18.61 | 1.18 |
| Asset Turnover | 0.88 | 0.29 |
| Fixed Asset Turnover | 9.44 | 3.72 |
| Payout ratio | 68.67% | -1951.40% |
| Dividend yield | 2.10% | 3.75% |
Interpretation of the Ratios
QUALCOMM Incorporated
QUALCOMM shows strong financial health with favorable net margin of 12.51%, ROE at 26.13%, and ROIC of 13.19%. Its liquidity is solid, with a current ratio of 2.82 and interest coverage of 20.07, although valuation multiples like PE at 32.7 and PB at 8.54 are less attractive. The company pays dividends, yielding 2.1%, supported by free cash flow, suggesting a sustainable payout.
Microchip Technology Incorporated
Microchip presents weak profitability metrics, with negative net margin, ROE, and ROIC, indicating operational challenges. Liquidity ratios are decent, including a current ratio of 2.59, but interest coverage is low at 1.15, and asset turnover is subpar. Despite these concerns, Microchip offers a higher dividend yield at 3.75%, but free cash flow is negative, posing risks to distribution sustainability.
Which one has the best ratios?
QUALCOMM holds the advantage with a majority of favorable ratios reflecting profitability, liquidity, and coverage, balanced with reasonable risk indicators. In contrast, Microchip’s financials are less robust, with several unfavorable ratios and earnings challenges despite a higher dividend yield. Overall, QUALCOMM’s ratio profile is markedly stronger than Microchip’s.
Strategic Positioning
This section compares the strategic positioning of QUALCOMM and Microchip Technology, focusing on market position, key segments, and exposure to technological disruption:
QUALCOMM
- Leading global wireless technology provider facing strong competition in semiconductors.
- Diverse segments: QCT (chips), QTL (licensing), QSI (early-stage tech investments).
- Invests in 5G, AI, automotive, cloud, and IoT through QSI, addressing emerging tech trends.
Microchip Technology
- Mid-sized semiconductor firm with competitive pressure in embedded control solutions.
- Focused on microcontrollers, analog, memory, and FPGA products for varied applications.
- Provides specialized microcontrollers and licensing but less emphasis on disruptive tech investments.
QUALCOMM vs Microchip Technology Positioning
QUALCOMM pursues a diversified approach across multiple segments including licensing and strategic initiatives, offering breadth in wireless and emerging tech. Microchip is more concentrated on embedded control and semiconductor products, with narrower segment diversity and less visible early-stage tech investment.
Which has the best competitive advantage?
QUALCOMM holds a slightly favorable moat by creating value despite declining profitability. Microchip shows a very unfavorable moat, shedding value with declining returns, indicating less efficient capital use and weaker competitive advantage.
Stock Comparison
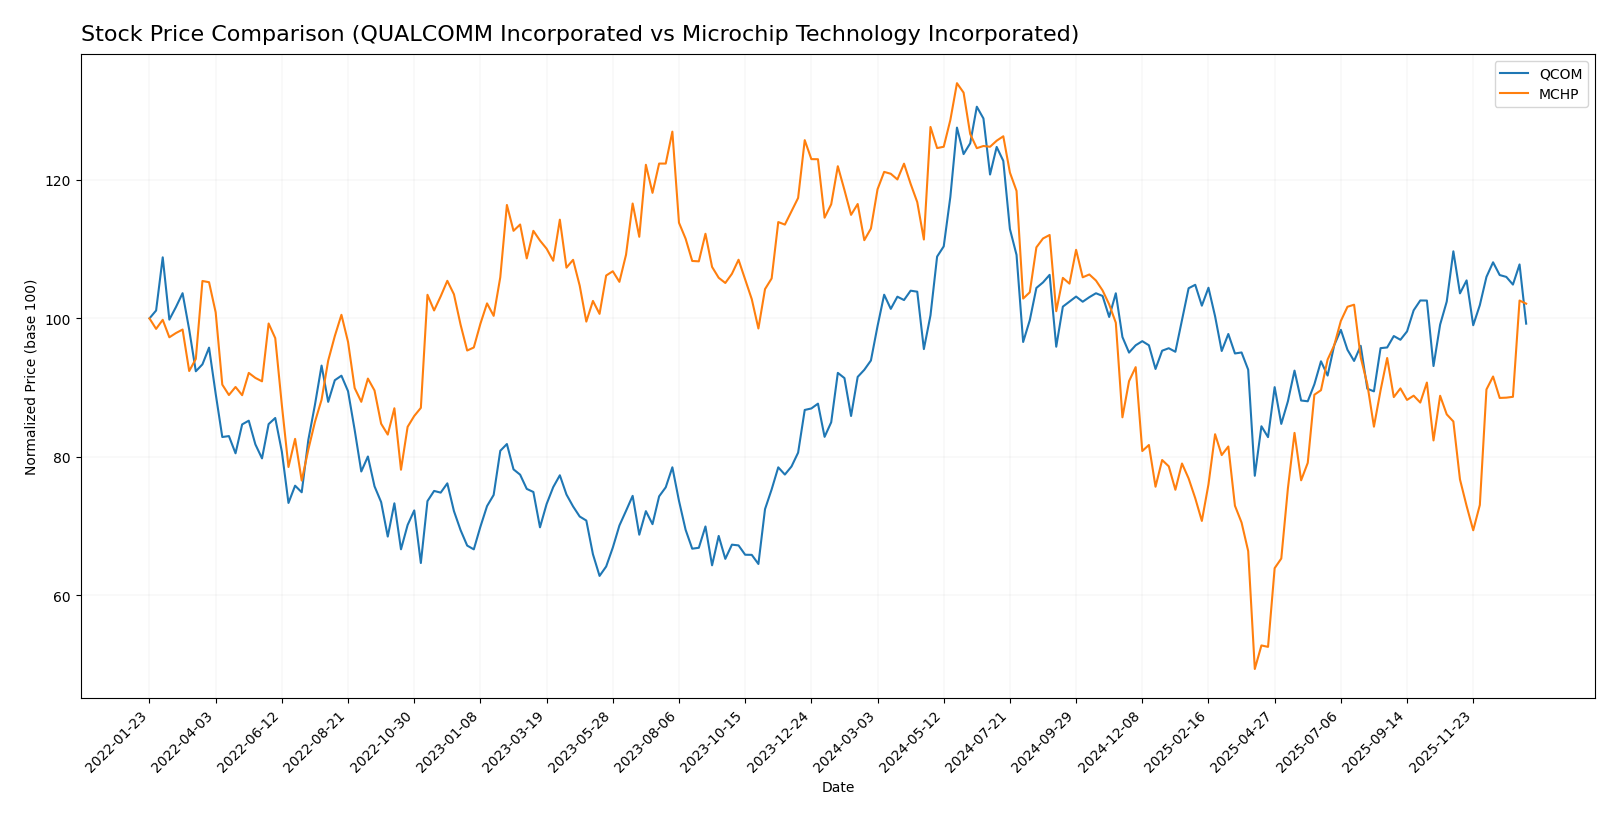
The stock price movements of QUALCOMM Incorporated and Microchip Technology Incorporated over the past 12 months reveal contrasting trends, with QUALCOMM showing overall bullish momentum and Microchip facing a bearish trajectory despite recent gains.
Trend Analysis
QUALCOMM’s stock experienced a 5.66% increase over the past year, indicating a bullish trend with accelerating momentum. The price ranged between 127.46 and 215.33, with volatility measured by a 16.08 standard deviation.
Microchip Technology’s stock recorded a 9.6% decline over the same period, reflecting a bearish trend despite recent acceleration and a notable price rebound of 19.98% since November 2025, accompanied by moderate volatility (7.63 std deviation).
Comparatively, QUALCOMM delivered the highest market performance with a positive overall price change, while Microchip’s stock posted a negative annual return, showing divergent investor sentiment and price dynamics.
Target Prices
The current analyst consensus indicates positive upside potential for both QUALCOMM Incorporated and Microchip Technology Incorporated.
| Company | Target High | Target Low | Consensus |
|---|---|---|---|
| QUALCOMM Incorporated | 210 | 165 | 185.71 |
| Microchip Technology Incorporated | 85 | 60 | 77.44 |
Analysts expect QUALCOMM’s share price to rise from $163.72 to around $185.71 on average, suggesting moderate upside. Microchip’s current price near $74.86 aligns closely with the consensus target of $77.44, indicating modest growth potential.
Analyst Opinions Comparison
This section compares analysts’ ratings and grades for QUALCOMM Incorporated and Microchip Technology Incorporated:
Rating Comparison
QUALCOMM Rating
- Rating: B+, indicating a very favorable overall assessment.
- Discounted Cash Flow Score: 4, a favorable valuation outlook.
- ROE Score: 5, very favorable efficiency in generating profit.
- ROA Score: 5, very favorable asset utilization.
- Debt To Equity Score: 1, very unfavorable indicating higher risk.
- Overall Score: 3, a moderate overall financial standing.
Microchip Technology Rating
- Rating: C-, signaling a very unfavorable overall assessment.
- Discounted Cash Flow Score: 3, indicating a moderate valuation.
- ROE Score: 1, very unfavorable profitability from equity.
- ROA Score: 1, very unfavorable asset performance.
- Debt To Equity Score: 1, very unfavorable indicating higher risk.
- Overall Score: 1, a very unfavorable financial standing.
Which one is the best rated?
Based strictly on the data, QUALCOMM holds a stronger analyst rating with a B+ and more favorable scores in discounted cash flow, ROE, and ROA. Microchip Technology’s C- rating and mostly very unfavorable scores place it at a lower standing.
Scores Comparison
Here is a comparison of the Altman Z-Score and Piotroski Score for QUALCOMM and Microchip Technology:
QCOM Scores
- Altman Z-Score: 6.37, indicating a safe zone with low bankruptcy risk.
- Piotroski Score: 7, classified as strong financial health.
MCHP Scores
- Altman Z-Score: 4.00, also in the safe zone, low bankruptcy risk.
- Piotroski Score: 3, classified as very weak financial health.
Which company has the best scores?
QUALCOMM shows stronger financial health with a higher Piotroski Score of 7 versus Microchip’s 3. Both have safe zone Altman Z-Scores, but QUALCOMM’s is significantly higher.
Grades Comparison
Here is a detailed comparison of the latest grades assigned to QUALCOMM Incorporated and Microchip Technology Incorporated by recognized grading companies:
QUALCOMM Incorporated Grades
The table below summarizes recent action grades from reputable firms for QUALCOMM Incorporated:
| Grading Company | Action | New Grade | Date |
|---|---|---|---|
| Mizuho | Downgrade | Neutral | 2026-01-09 |
| Rosenblatt | Maintain | Buy | 2025-11-06 |
| B of A Securities | Maintain | Buy | 2025-11-06 |
| Mizuho | Maintain | Outperform | 2025-11-06 |
| Wells Fargo | Maintain | Underweight | 2025-11-06 |
| Piper Sandler | Maintain | Overweight | 2025-11-06 |
| UBS | Maintain | Neutral | 2025-11-06 |
| JP Morgan | Maintain | Overweight | 2025-11-04 |
| Citigroup | Maintain | Neutral | 2025-10-28 |
| Rosenblatt | Maintain | Buy | 2025-10-28 |
QUALCOMM’s grades show a mixed but generally positive outlook, with multiple “Buy” and “Outperform” ratings balanced by some “Neutral” and an “Underweight” rating from Wells Fargo, indicating diverse analyst views.
Microchip Technology Incorporated Grades
The table below presents recent grades assigned to Microchip Technology Incorporated by established grading firms:
| Grading Company | Action | New Grade | Date |
|---|---|---|---|
| B. Riley Securities | Maintain | Buy | 2026-01-12 |
| Mizuho | Maintain | Outperform | 2026-01-09 |
| Wells Fargo | Maintain | Equal Weight | 2026-01-07 |
| JP Morgan | Maintain | Overweight | 2026-01-06 |
| Morgan Stanley | Maintain | Equal Weight | 2026-01-06 |
| Needham | Maintain | Buy | 2026-01-06 |
| Rosenblatt | Maintain | Buy | 2026-01-06 |
| Stifel | Maintain | Buy | 2026-01-06 |
| Cantor Fitzgerald | Upgrade | Overweight | 2025-12-16 |
| B of A Securities | Maintain | Neutral | 2025-12-05 |
Microchip Technology displays predominantly positive ratings with a clear emphasis on “Buy,” “Outperform,” and “Overweight” grades, suggesting strong analyst confidence.
Which company has the best grades?
Microchip Technology Incorporated has received more consistent positive grades, including multiple “Buy” and “Outperform” actions, compared to QUALCOMM’s mix of “Buy,” “Neutral,” and some lower ratings. This pattern may imply stronger analyst confidence in Microchip Technology’s outlook, potentially influencing investor sentiment towards stability and growth prospects.
Strengths and Weaknesses
Below is a comparative overview of the strengths and weaknesses of QUALCOMM Incorporated (QCOM) and Microchip Technology Incorporated (MCHP) based on their recent financial and strategic data.
| Criterion | QUALCOMM Incorporated (QCOM) | Microchip Technology Incorporated (MCHP) |
|---|---|---|
| Diversification | Strong revenue streams from QCT (chip technology) and QTL (licensing), showing a balanced mix. | Primarily reliant on semiconductor products, with smaller licensing revenue. |
| Profitability | Favorable net margin (12.51%), ROE (26.13%), and ROIC (13.19%). | Negative profitability metrics with net margin and ROIC slightly below zero. |
| Innovation | Consistent value creation with a positive ROIC vs WACC, though profitability is declining. | Value destroying with a significantly negative ROIC trend indicating weak innovation impact. |
| Global presence | Solid global footprint supported by strong asset turnover and interest coverage ratios. | Moderate global reach but weaker asset turnover and interest coverage ratios. |
| Market Share | High market presence reflected by a favorable fixed asset turnover (9.44) and dividend yield (2.1%). | Smaller market share indicated by lower asset turnover (0.29) but higher dividend yield (3.75%). |
Key takeaways: QUALCOMM maintains a stronger financial and competitive position with diversified revenue and healthy profitability despite recent ROIC declines. Microchip shows weakness in profitability and value creation, signaling caution for investors considering its current financial health and market challenges.
Risk Analysis
Below is a comparative table highlighting key risk factors for QUALCOMM Incorporated and Microchip Technology Incorporated based on their latest financial and operational data from 2025.
| Metric | QUALCOMM Incorporated (QCOM) | Microchip Technology Incorporated (MCHP) |
|---|---|---|
| Market Risk | Beta 1.21; moderate volatility in semiconductor sector | Beta 1.45; higher volatility, more sensitive to market swings |
| Debt level | Debt-to-equity 0.7; favorable interest coverage (20.07) | Debt-to-equity 0.8; low interest coverage (1.15), riskier debt profile |
| Regulatory Risk | Moderate; operates globally with IP licensing exposure | Moderate; diverse product lines with compliance demands in automotive and industrial sectors |
| Operational Risk | Strong asset turnover and operational efficiency | Lower asset turnover; operational challenges reflected in negative profitability |
| Environmental Risk | Standard industry compliance; no major reported issues | Industry typical risks; no significant environmental liabilities disclosed |
| Geopolitical Risk | US-based with global markets, potential export/import restrictions | US-based with global supply chain exposure, sensitive to trade tensions |
Synthesis: The most impactful risks for Microchip Technology stem from its weaker profitability, higher debt burden with low interest coverage, and operational inefficiencies, increasing financial distress risk despite a safe Altman Z-score. QUALCOMM shows moderate market volatility and debt but benefits from strong operational metrics and financial stability. Investors should weigh Microchip’s financial fragility against QUALCOMM’s more robust profile when managing portfolio risk.
Which Stock to Choose?
QUALCOMM Incorporated (QCOM) shows favorable income growth and strong profitability with a 12.51% net margin and 26.13% ROE, supported by a solid current ratio of 2.82 and moderate debt levels. Its overall rating is very favorable.
Microchip Technology Incorporated (MCHP) faces unfavorable income evolution marked by a negative net margin and declining profitability. Despite a current ratio of 2.59, its high debt and very unfavorable rating underscore financial challenges and value destruction.
Investors focused on quality and stable profitability might find QCOM more appealing given its favorable rating and value-creating moat, while those with tolerance for volatility might interpret MCHP’s recent price acceleration as a potential turnaround indicator.
Disclaimer: Investment carries a risk of loss of initial capital. The past performance is not a reliable indicator of future results. Be sure to understand risks before making an investment decision.
Go Further
I encourage you to read the complete analyses of QUALCOMM Incorporated and Microchip Technology Incorporated to enhance your investment decisions: