Home > Comparison > Technology > QCOM vs MXL
The strategic rivalry between QUALCOMM Incorporated and MaxLinear, Inc. shapes the semiconductor industry’s evolution. QUALCOMM operates as a capital-intensive innovator specializing in integrated circuits and wireless technologies. In contrast, MaxLinear focuses on high-performance analog and mixed-signal SoCs for communications infrastructure. This analysis compares their distinct operational models to identify which company presents a superior risk-adjusted opportunity for diversified portfolios amid ongoing sector disruption.
Table of contents
Companies Overview
QUALCOMM Incorporated and MaxLinear, Inc. stand as pivotal players in the semiconductor sector, shaping wireless and communication technologies.
QUALCOMM Incorporated: Wireless Technology Pioneer
QUALCOMM dominates as a foundational technology developer for the wireless industry. Its core revenue stems from integrated circuits and system software for 3G/4G/5G devices and licensing its vast patent portfolio. In 2026, the company strategically invests in 5G, AI, automotive, and IoT to extend its technology leadership and diversify growth avenues.
MaxLinear, Inc.: High-Performance Communication SoCs
MaxLinear excels in radiofrequency and mixed-signal SoCs for connected home and infrastructure markets. It generates revenue by selling integrated communication platform solutions for broadband modems, routers, and 4G/5G infrastructure. The firm focuses on expanding its footprint in fiber-optic modules and power management to enhance end-to-end connectivity solutions.
Strategic Collision: Similarities & Divergences
Both firms innovate within semiconductors but diverge in scope and scale. QUALCOMM leverages a broad patent moat and licensing model, while MaxLinear prioritizes integrated hardware solutions for niche connectivity applications. Their primary battleground is 5G infrastructure components, with QUALCOMM emphasizing licensing and MaxLinear pushing product integration. This contrast defines their distinct risk and growth profiles in the evolving telecom landscape.
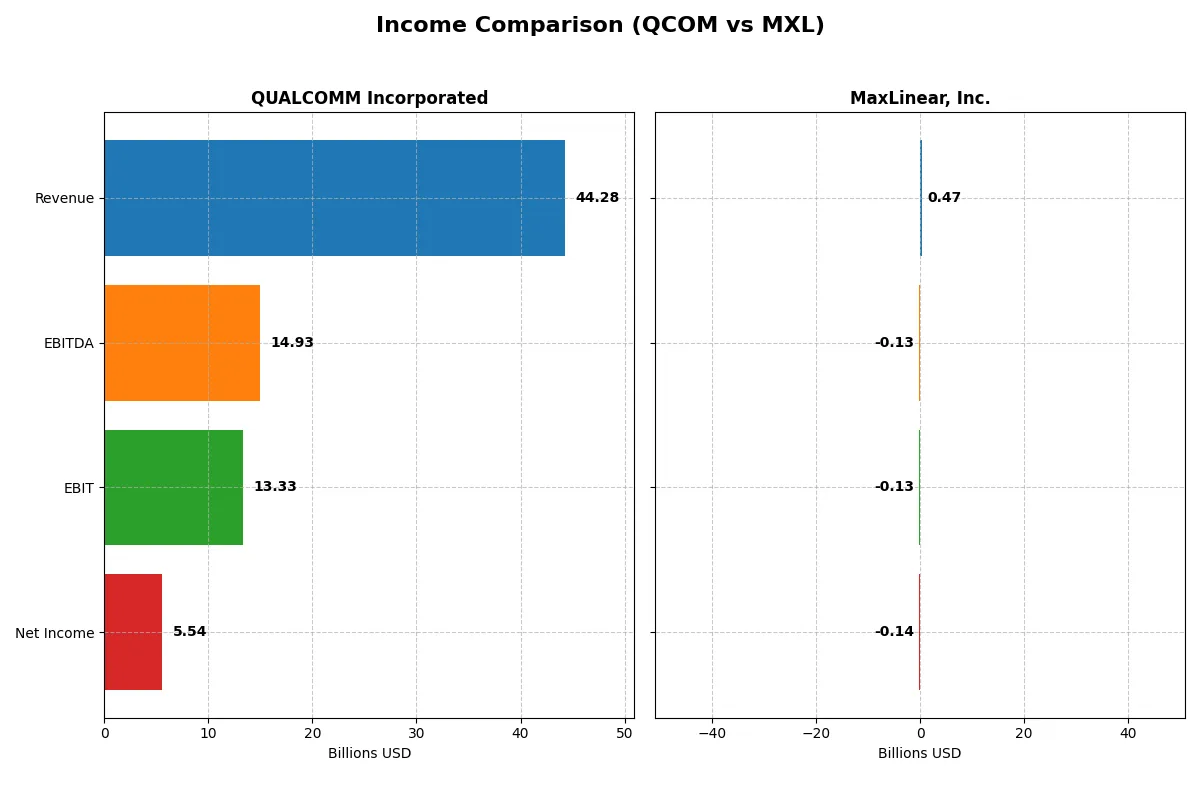
Income Statement Comparison
This data dissects the core profitability and scalability of both corporate engines to reveal who dominates the bottom line:
| Metric | QUALCOMM Incorporated (QCOM) | MaxLinear, Inc. (MXL) |
|---|---|---|
| Revenue | 44.3B | 468M |
| Cost of Revenue | 19.7B | 202M |
| Operating Expenses | 12.2B | 393M |
| Gross Profit | 24.5B | 266M |
| EBITDA | 14.9B | -131M |
| EBIT | 13.3B | -131M |
| Interest Expense | 664M | 10.1M |
| Net Income | 5.5B | -137M |
| EPS | 5.06 | -1.58 |
| Fiscal Year | 2025 | 2025 |
Income Statement Analysis: The Bottom-Line Duel
This income statement comparison will uncover which company operates with superior efficiency and sustainable profitability in a challenging market environment.
QUALCOMM Incorporated Analysis
QUALCOMM’s revenue grew steadily from $33.6B in 2021 to $44.3B in 2025, a 32% rise, while net income declined from $9B to $5.5B. The firm maintains strong gross margins above 55%, and EBIT margin remains robust near 30%. However, net margin contraction and EPS declines signal margin pressure despite top-line growth momentum.
MaxLinear, Inc. Analysis
MaxLinear’s revenue shows volatility, peaking at $1.12B in 2022 before falling to $468M in 2025, with net income persistently negative, hitting -$137M in 2025. It sustains a healthy gross margin near 57%, but EBIT and net margins remain sharply negative. Recent improvements in revenue and margin growth suggest a turnaround effort, yet losses persist.
Margin Strength vs. Scale Dominance
QUALCOMM dominates with scale and consistent high margins, despite recent net income setbacks. MaxLinear struggles with profitability but shows promising revenue and margin growth trends. For investors prioritizing profitability and operational efficiency, QUALCOMM’s profile remains more attractive given its established margin power and scale.
Financial Ratios Comparison
These vital ratios act as a diagnostic tool to expose the underlying fiscal health, valuation premiums, and capital efficiency of the companies compared below:
| Ratios | QUALCOMM Incorporated (QCOM) | MaxLinear, Inc. (MXL) |
|---|---|---|
| ROE | 26.13% | -47.49% |
| ROIC | 13.19% | -24.31% |
| P/E | 32.70 | -6.74 |
| P/B | 8.54 | 3.20 |
| Current Ratio | 2.82 | 1.77 |
| Quick Ratio | 2.10 | 1.28 |
| D/E (Debt-to-Equity) | 0.70 | 0.29 |
| Debt-to-Assets | 29.54% | 17.23% |
| Interest Coverage | 18.61 | -15.52 |
| Asset Turnover | 0.88 | 0.42 |
| Fixed Asset Turnover | 9.44 | 4.65 |
| Payout ratio | 68.67% | 0 |
| Dividend yield | 2.10% | 0 |
| Fiscal Year | 2025 | 2024 |
Efficiency & Valuation Duel: The Vital Signs
Ratios act as a company’s DNA, revealing hidden risks and operational excellence that drive investment decisions.
QUALCOMM Incorporated
QUALCOMM shows robust profitability with a 26.13% ROE and a solid 12.51% net margin, highlighting operational efficiency. Its valuation appears stretched, with a P/E of 32.7 and a P/B of 8.54, above typical benchmarks. Shareholders benefit from a 2.1% dividend yield, reflecting disciplined capital allocation and steady returns.
MaxLinear, Inc.
MaxLinear struggles with deeply negative profitability metrics, including a -47.49% ROE and -68.01% net margin, signaling operational losses. Its valuation seems more attractive with a negative P/E and a P/B of 3.2, but this masks financial instability. The company pays no dividends, instead focusing on heavy R&D reinvestment to fuel growth.
Premium Valuation vs. Operational Safety
QUALCOMM offers a favorable balance of strong profitability and shareholder returns despite a stretched valuation. MaxLinear’s high risks and negative returns limit appeal despite lower valuation multiples. Investors prioritizing stability and income may prefer QUALCOMM, while growth seekers face considerable risk with MaxLinear.
Which one offers the Superior Shareholder Reward?
I compare QUALCOMM and MaxLinear’s distribution strategies. QUALCOMM yields 2.1% with a high payout ratio near 69%, supported by strong free cash flow covering dividends 2.8x. It pairs steady dividends with aggressive buybacks, enhancing total returns sustainably. MaxLinear pays no dividends, reinvesting losses into growth and R&D, but its negative margins and cash flow deficits raise sustainability concerns. Buybacks are absent for MaxLinear, limiting immediate shareholder rewards. I conclude QUALCOMM offers a superior total return profile in 2026 due to its balanced, cash-backed distributions and capital allocation discipline.
Comparative Score Analysis: The Strategic Profile
The radar chart reveals the fundamental DNA and trade-offs of QUALCOMM Incorporated and MaxLinear, Inc., highlighting their core financial strengths and weaknesses:
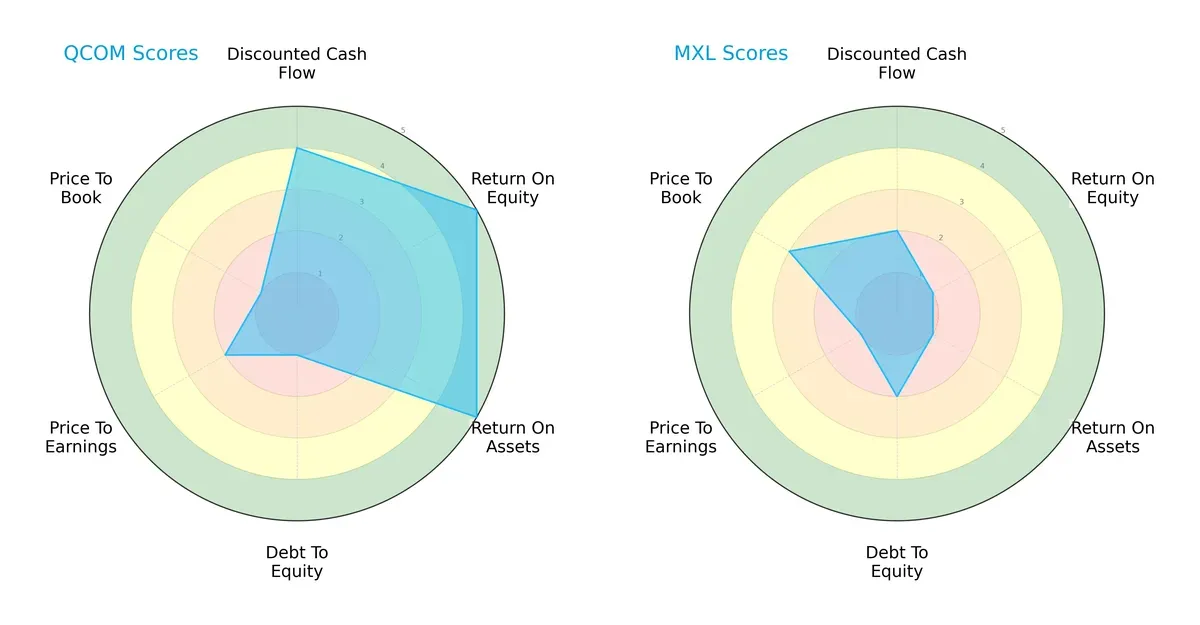
QUALCOMM demonstrates superior profitability with very favorable ROE (5) and ROA (5) scores, and a strong discounted cash flow score (4). However, it carries a significant financial risk reflected in a very unfavorable debt-to-equity score (1) and valuation metrics (P/E 2, P/B 1). MaxLinear, in contrast, shows a more conservative debt profile (debt-to-equity score 2) and slightly better price-to-book valuation (3), but its profitability scores lag significantly (ROE 1, ROA 1), signaling operational challenges. QUALCOMM offers a more balanced profile with a clear edge in generating returns, while MaxLinear relies on financial prudence but struggles on profitability.
Bankruptcy Risk: Solvency Showdown
The Altman Z-Score gap highlights a stark contrast in long-term survival prospects:
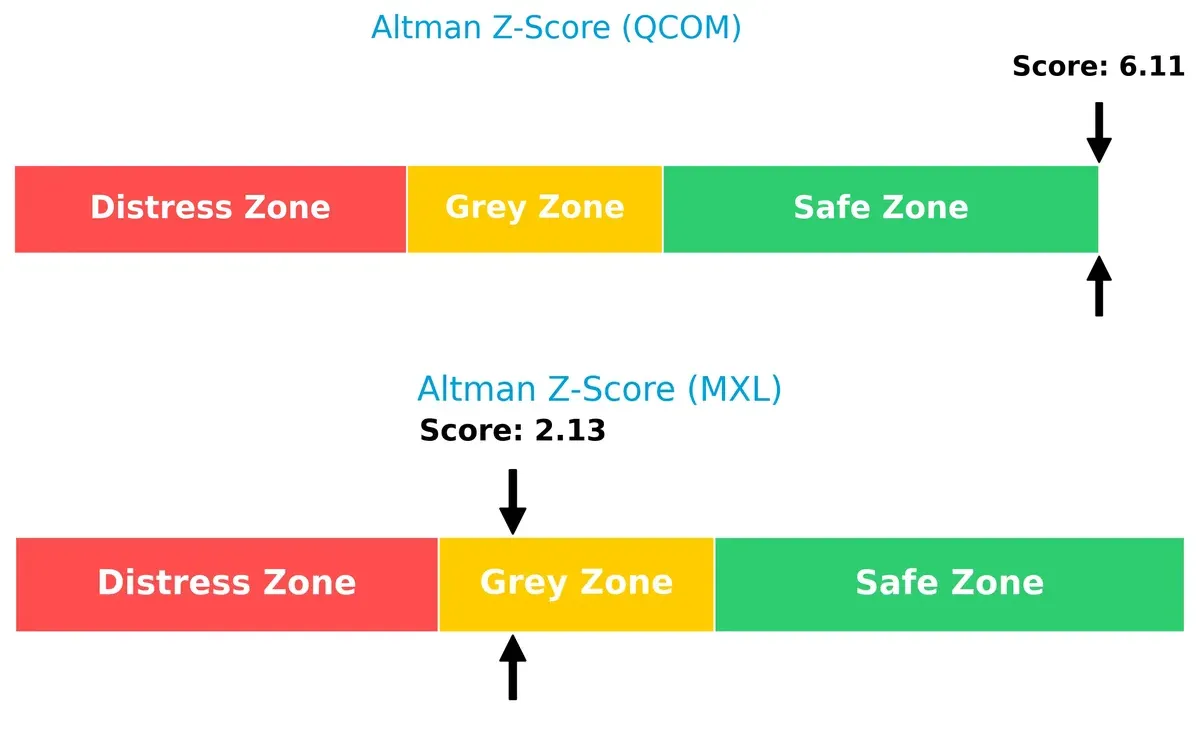
QUALCOMM’s score of 6.11 places it firmly in the safe zone, indicating robust solvency and low bankruptcy risk. MaxLinear’s score of 2.13 situates it in the grey zone, suggesting moderate risk and financial vulnerability amid current market pressures. This gap underscores QUALCOMM’s stronger balance sheet resilience.
Financial Health: Quality of Operations
Piotroski F-Scores reveal operational quality and internal financial health differences clearly:
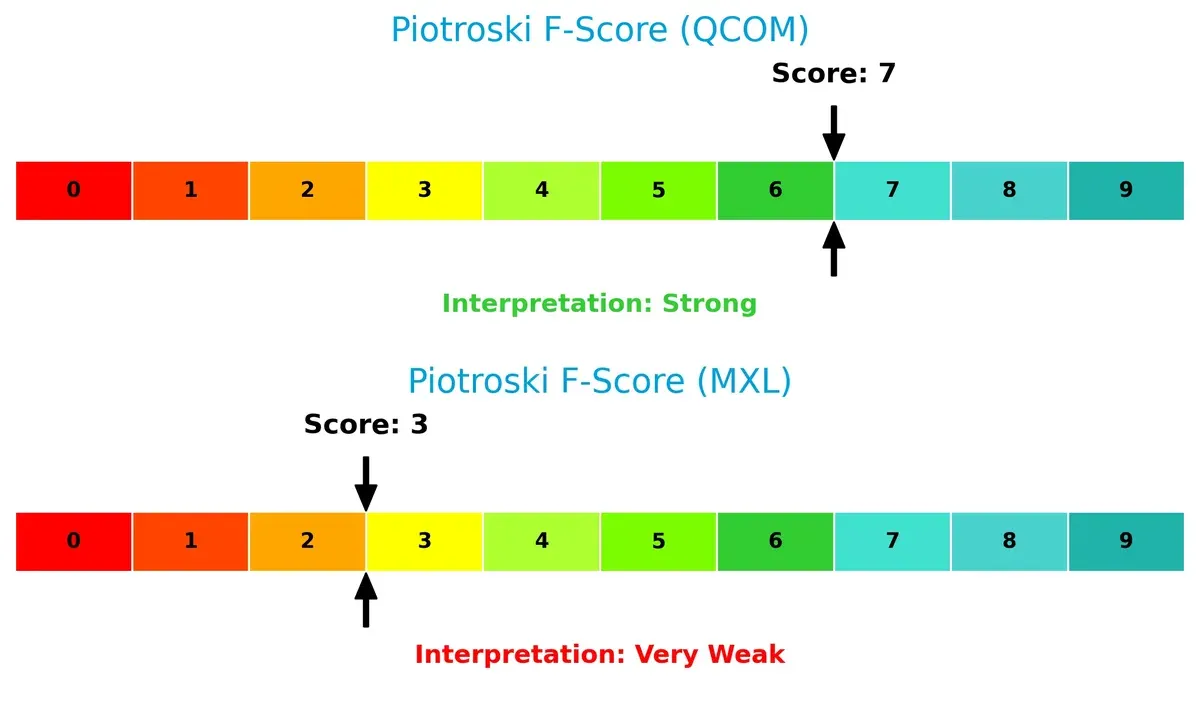
QUALCOMM’s strong F-Score of 7 signals solid profitability, liquidity, and efficiency metrics, indicative of well-managed operations. MaxLinear’s very weak score of 3 raises red flags about its financial stability and internal weaknesses. Investors should view MaxLinear’s low score as a cautionary sign relative to QUALCOMM’s robust health.
How are the two companies positioned?
This section dissects the operational DNA of QUALCOMM and MaxLinear by comparing their revenue distribution and internal strengths and weaknesses. The goal is to confront their economic moats to identify which model delivers the most resilient competitive advantage today.
Revenue Segmentation: The Strategic Mix
The following comparison dissects how QUALCOMM Incorporated and MaxLinear, Inc. diversify their income streams and where their primary sector bets lie:
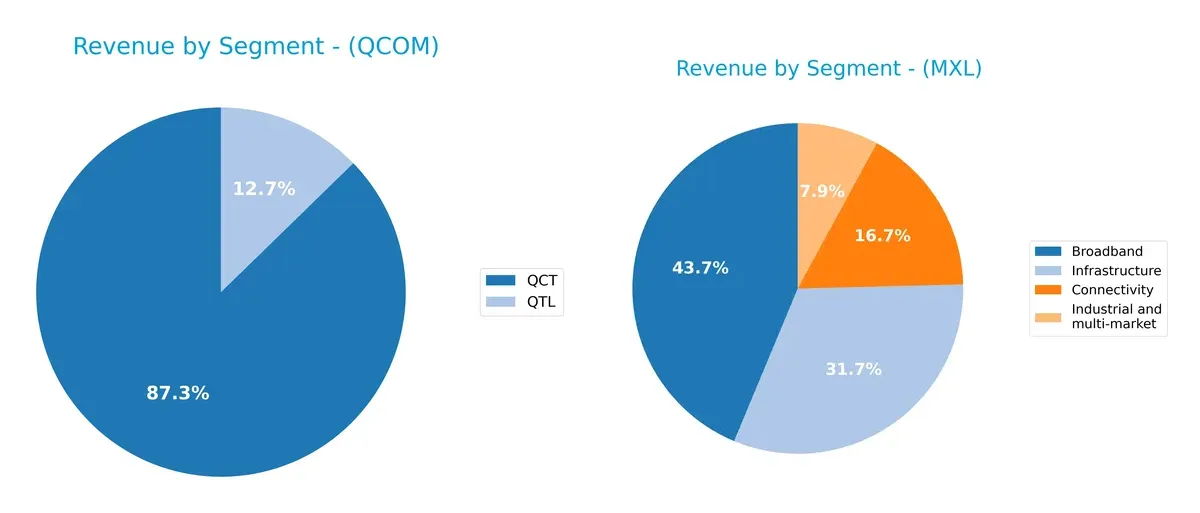
QUALCOMM’s revenue dwarfs MaxLinear’s with a heavy anchor in QCT at $38.4B, complemented by QTL at $5.6B, showing a concentrated but robust semiconductor and licensing model. MaxLinear displays a more balanced mix across Broadband ($204M), Connectivity ($78M), Industrial and multi-market ($37M), and Infrastructure ($148M), reflecting diversified exposure but on a much smaller scale. QUALCOMM’s reliance on QCT signals infrastructure dominance, while MaxLinear’s mix limits concentration risk but lacks scale.
Strengths and Weaknesses Comparison
This table compares the Strengths and Weaknesses of QUALCOMM and MaxLinear:
QUALCOMM Strengths
- Strong profitability metrics with 12.5% net margin and 26.1% ROE
- Favorable liquidity ratios with current ratio at 2.82
- Diversified revenue from QCT and QTL segments
- Global presence with significant revenue from China and other foreign markets
- Solid dividend yield at 2.1%
- Efficient fixed asset turnover at 9.44
MaxLinear Strengths
- Favorable debt-to-equity ratio of 0.29 indicating lower leverage
- Positive price-to-earnings metric despite losses
- Diversified product segments including Broadband, Connectivity, and Infrastructure
- Favorable liquidity ratios with current ratio at 1.77
- Good fixed asset turnover at 4.65
QUALCOMM Weaknesses
- High price-to-book ratio at 8.54 signals premium valuation
- PE ratio of 32.7 considered unfavorable
- Moderate debt with debt-to-assets near 30%
- Neutral asset turnover at 0.88 may impact operational efficiency
MaxLinear Weaknesses
- Negative profitability metrics with -68% net margin and -47.5% ROE
- Negative interest coverage indicating financial strain
- Unfavorable asset turnover at 0.42 limits efficiency
- Zero dividend yield
- Higher WACC at 11.45% raises capital cost
QUALCOMM demonstrates robust profitability, strong global reach, and solid financial health but trades at a high valuation. MaxLinear shows moderate diversification and low leverage but faces serious profitability and efficiency challenges. These factors shape their strategic priorities differently.
The Moat Duel: Analyzing Competitive Defensibility
A durable structural moat shields long-term profits from relentless competition erosion. Let’s dissect how each firm defends its turf:
QUALCOMM Incorporated: Intellectual Property Licensing Moat
QUALCOMM’s competitive edge stems from its vast patent portfolio licensing, driving high ROIC and margin stability. In 2026, expansion into 5G and AI chips could deepen this moat, though geopolitical risks linger.
MaxLinear, Inc.: Integrated Systems-on-Chip Innovation
MaxLinear leverages product integration and design complexity as its moat, unlike QUALCOMM’s licensing model. Despite negative ROIC trends, recent revenue growth signals potential for market disruption in broadband and wireless infrastructure.
Licensing Dominance vs. Product Integration Complexity
QUALCOMM’s wider moat, supported by positive ROIC exceeding WACC, outclasses MaxLinear’s value-destructive trend. QUALCOMM stands better poised to maintain market share amid evolving tech cycles.
Which stock offers better returns?
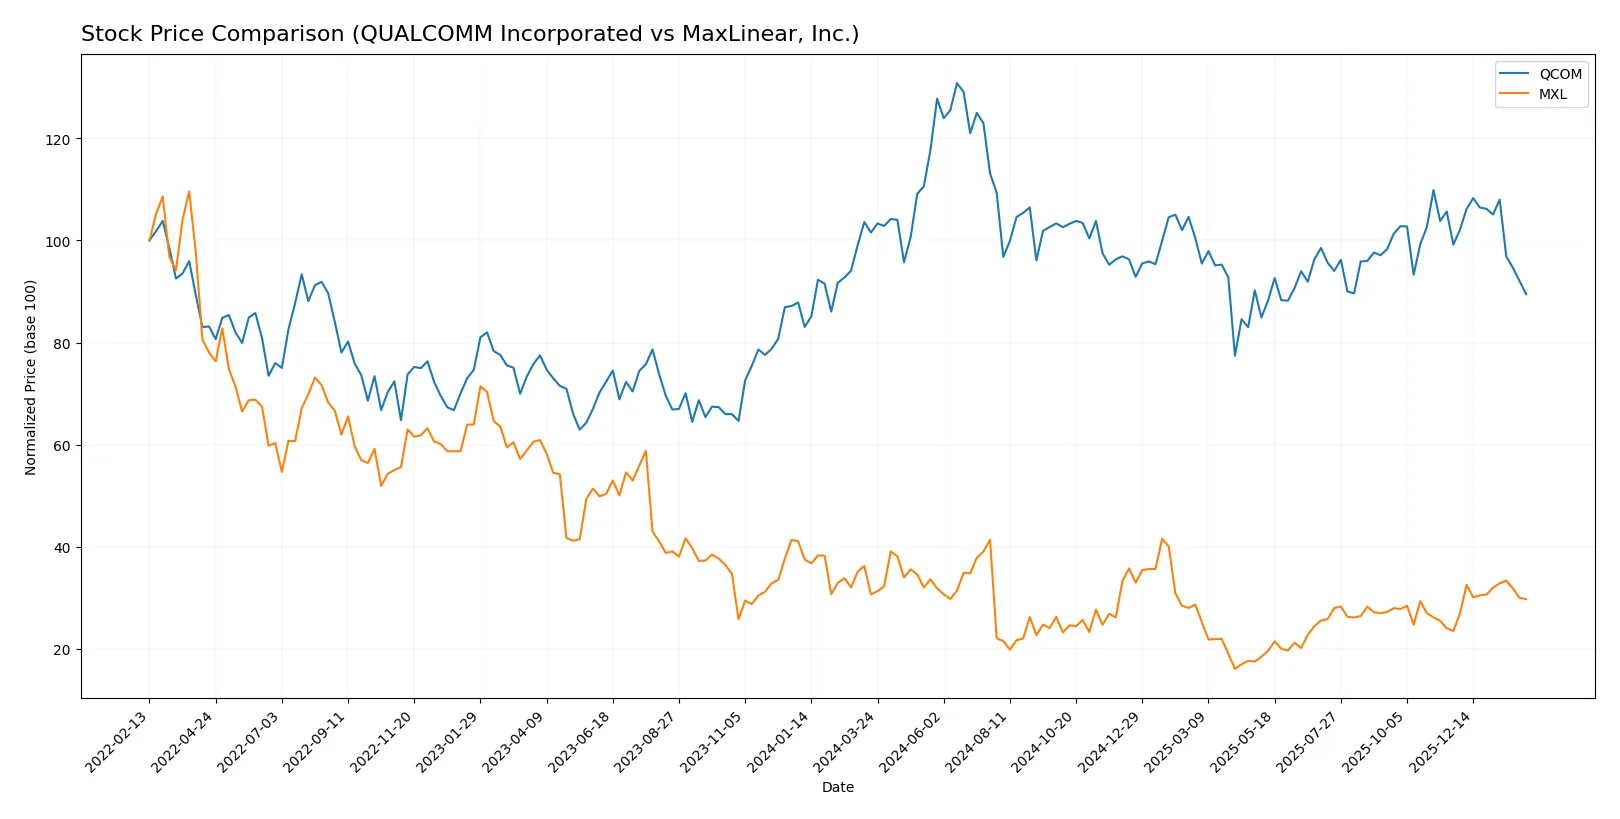
Over the past year, QUALCOMM and MaxLinear exhibited contrasting price movements, with QUALCOMM facing a declining trend and MaxLinear showing signs of recovery and recent strength.
Trend Comparison
QUALCOMM’s stock declined 11.9% over the last 12 months, marking a bearish trend with price deceleration. Volatility remained high, with a standard deviation of 16.26, and the price ranged from 127.46 to 215.33.
MaxLinear’s stock also trended bearish for the year, down 3.11%, but displayed acceleration in its price movement. Volatility was lower at 3.34, with a recent strong recovery gaining 26.45% over the last 2.5 months.
MaxLinear outperformed QUALCOMM in recent months and posted a smaller annual decline. MaxLinear’s trend shows stronger momentum despite both stocks recording bearish annual returns.
Target Prices
Analysts present a moderately bullish consensus for QUALCOMM Incorporated and MaxLinear, Inc.
| Company | Target Low | Target High | Consensus |
|---|---|---|---|
| QUALCOMM Incorporated | 160 | 210 | 181.43 |
| MaxLinear, Inc. | 15 | 25 | 21 |
QUALCOMM’s target consensus of 181.43 implies a 23% upside from its 146.8 current price, signaling analyst confidence above the Nasdaq-100 average. MaxLinear’s 21 target consensus suggests roughly 25% upside, reflecting growth expectations despite its smaller size and higher volatility.

Don’t Let Luck Decide Your Entry Point
Optimize your entry points with our advanced ProRealTime indicators. You’ll get efficient buy signals with precise price targets for maximum performance. Start outperforming now!
How do institutions grade them?
QUALCOMM Incorporated Grades
Here are the recent institutional grades for QUALCOMM Incorporated from leading analysts:
| Grading Company | Action | New Grade | Date |
|---|---|---|---|
| Cantor Fitzgerald | Maintain | Neutral | 2026-02-02 |
| Mizuho | Maintain | Neutral | 2026-01-26 |
| UBS | Maintain | Neutral | 2026-01-26 |
| Mizuho | Downgrade | Neutral | 2026-01-09 |
| Rosenblatt | Maintain | Buy | 2025-11-06 |
| Wells Fargo | Maintain | Underweight | 2025-11-06 |
| Piper Sandler | Maintain | Overweight | 2025-11-06 |
| UBS | Maintain | Neutral | 2025-11-06 |
| Mizuho | Maintain | Outperform | 2025-11-06 |
| B of A Securities | Maintain | Buy | 2025-11-06 |
MaxLinear, Inc. Grades
Below are the recent institutional grades for MaxLinear, Inc. from recognized grading firms:
| Grading Company | Action | New Grade | Date |
|---|---|---|---|
| Wells Fargo | Maintain | Equal Weight | 2026-01-30 |
| Benchmark | Maintain | Buy | 2026-01-16 |
| Benchmark | Maintain | Buy | 2025-10-24 |
| Benchmark | Maintain | Buy | 2025-10-17 |
| Benchmark | Maintain | Buy | 2025-09-02 |
| Loop Capital | Maintain | Hold | 2025-08-04 |
| Wells Fargo | Maintain | Equal Weight | 2025-07-24 |
| Benchmark | Maintain | Buy | 2025-07-24 |
| Susquehanna | Maintain | Neutral | 2025-07-24 |
| Susquehanna | Maintain | Neutral | 2025-07-22 |
Which company has the best grades?
QUALCOMM shows a broad spectrum of grades, mostly Neutral with some Buy and Outperform ratings from top firms. MaxLinear’s grades cluster around Buy and Equal Weight with consistent Buy ratings from Benchmark. QUALCOMM’s mixed grades suggest varied analyst views, while MaxLinear’s more consistent Buy ratings may imply steadier optimism, affecting investor sentiment differently.
Risks specific to each company
The following categories identify critical pressure points and systemic threats facing QUALCOMM Incorporated and MaxLinear, Inc. in the 2026 market environment:
1. Market & Competition
QUALCOMM Incorporated
- Dominates with strong IP licensing and 5G technology leadership.
MaxLinear, Inc.
- Faces intense competition in RF and mixed-signal SoCs with lower scale.
2. Capital Structure & Debt
QUALCOMM Incorporated
- Moderate debt-to-assets at 29.5% with strong interest coverage (20x).
MaxLinear, Inc.
- Low debt ratio (17.2%) but negative interest coverage signals distress.
3. Stock Volatility
QUALCOMM Incorporated
- Beta at 1.24 suggests moderate volatility, consistent with large-cap tech peers.
MaxLinear, Inc.
- Higher beta of 1.71 indicates greater stock price swings and risk.
4. Regulatory & Legal
QUALCOMM Incorporated
- Exposure to global antitrust scrutiny due to licensing model.
MaxLinear, Inc.
- Less regulatory risk but vulnerable to industry standards changes.
5. Supply Chain & Operations
QUALCOMM Incorporated
- Established supply chains with diversified suppliers.
MaxLinear, Inc.
- Smaller scale and reliance on third-party manufacturing pose risks.
6. ESG & Climate Transition
QUALCOMM Incorporated
- Advanced ESG reporting and initiatives aligned with industry benchmarks.
MaxLinear, Inc.
- ESG disclosure and climate initiatives less mature, increasing risk.
7. Geopolitical Exposure
QUALCOMM Incorporated
- Significant global exposure, including China, raising geopolitical risk.
MaxLinear, Inc.
- More US-centric operations limit but do not eliminate geopolitical threats.
Which company shows a better risk-adjusted profile?
QUALCOMM faces its biggest risk from regulatory and geopolitical pressures but demonstrates robust financial health and scale advantages. MaxLinear’s critical risk lies in its operational and financial instability, reflected in poor profitability and weak interest coverage. QUALCOMM’s Altman Z-score of 6.1 places it well in the safe zone, while MaxLinear’s 2.1 score signals moderate distress. The scale and financial strength make QUALCOMM the better risk-adjusted choice today.
Final Verdict: Which stock to choose?
QUALCOMM’s superpower lies in its robust capital efficiency and strong economic moat, consistently delivering returns above its cost of capital. Its main point of vigilance is a declining ROIC trend, hinting at potential margin pressure ahead. This stock suits portfolios targeting steady income with moderate growth.
MaxLinear’s strategic moat centers on aggressive innovation driven by high R&D intensity, fueling strong revenue growth despite current profitability challenges. Relative to QUALCOMM, it offers a riskier profile but with a leaner balance sheet. It fits portfolios with a higher tolerance for volatility and a focus on turnaround potential.
If you prioritize resilient cash generation and proven value creation, QUALCOMM outshines with superior financial stability and income potential. However, if you seek growth fueled by innovation and can accept operational headwinds, MaxLinear offers a compelling, albeit speculative, upside. Both represent distinct analytical scenarios for different investor profiles.
Disclaimer: Investment carries a risk of loss of initial capital. The past performance is not a reliable indicator of future results. Be sure to understand risks before making an investment decision.
Go Further
I encourage you to read the complete analyses of QUALCOMM Incorporated and MaxLinear, Inc. to enhance your investment decisions: