Home > Comparison > Technology > MXL vs NVEC
The strategic rivalry between MaxLinear, Inc. and NVE Corporation shapes the semiconductor sector’s innovation landscape. MaxLinear operates as a broad-based provider of RF and mixed-signal SoCs across multiple communication markets. In contrast, NVE focuses on niche spintronic sensor technology with strong industrial and medical applications. This head-to-head highlights a choice between scale-driven diversification and specialized innovation. This analysis will clarify which trajectory offers superior risk-adjusted returns for a diversified portfolio.
Table of contents
Companies Overview
MaxLinear and NVE Corporation hold pivotal roles in the semiconductor industry, each targeting distinct technological frontiers.
MaxLinear, Inc.: Integrated Communication Solutions Leader
MaxLinear dominates the semiconductor space with radiofrequency and mixed-signal SoCs. Its revenue hinges on products powering connected homes, 4G/5G infrastructure, and industrial applications. In 2026, MaxLinear sharpens focus on end-to-end communication platforms integrating RF, analog, and digital signal processing to sustain its market edge.
NVE Corporation: Spintronics Innovator
NVE Corporation specializes in spintronic sensors and couplers, leveraging nanotechnology to transform data acquisition and transmission. Revenue streams stem from factory automation, medical devices, and industrial IoT markets. Its 2026 strategy emphasizes advancing spintronic technology for specialized sensing and licensing next-gen memory solutions.
Strategic Collision: Similarities & Divergences
Both companies pioneer semiconductor innovation but diverge sharply in scope—MaxLinear pursues broad communication system integration, while NVE targets niche spintronics applications. Their battleground lies in industrial tech, where connectivity meets sensor precision. Investors face contrasting profiles: MaxLinear with scale and diversification versus NVE’s specialized, high-margin technology focus.
Income Statement Comparison
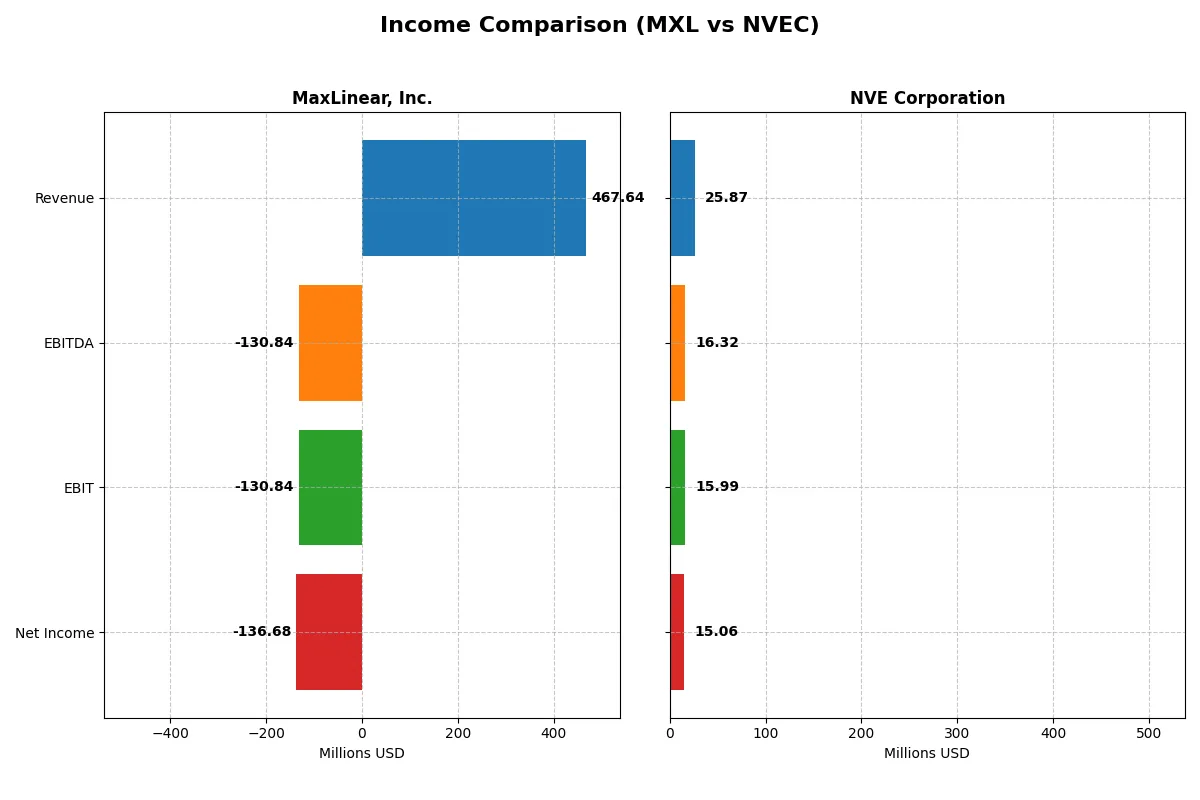
This data dissects the core profitability and scalability of both corporate engines to reveal who dominates the bottom line:
| Metric | MaxLinear, Inc. (MXL) | NVE Corporation (NVEC) |
|---|---|---|
| Revenue | 468M | 26M |
| Cost of Revenue | 202M | 4.2M |
| Operating Expenses | 393M | 5.6M |
| Gross Profit | 266M | 22M |
| EBITDA | -131M | 16M |
| EBIT | -131M | 16M |
| Interest Expense | 10M | 0 |
| Net Income | -137M | 15M |
| EPS | -1.58 | 3.12 |
| Fiscal Year | 2025 | 2025 |
Income Statement Analysis: The Bottom-Line Duel
This income statement comparison reveals the operational efficiency and profitability momentum behind each company’s financial engine.
MaxLinear, Inc. Analysis
MaxLinear’s revenue plunged from 1.12B in 2022 to 468M in 2025, dragging net income deeply negative at -137M in 2025. Despite a solid gross margin near 57%, heavy operating expenses and negative EBIT margins erode profitability. The 2025 year shows improving revenue and net margin growth, signaling early signs of operational recovery.
NVE Corporation Analysis
NVE’s revenue declined slightly to 26M in 2025 from a peak of 38M in 2023, yet it sustains robust profitability with a 58% net margin and 62% EBIT margin. High gross margins above 83% reflect strong cost control. The latest year marks a modest dip in revenue but steady net income, underscoring resilient earnings quality.
Margin Strength vs. Revenue Volatility
NVE clearly outperforms MaxLinear in profitability and margin consistency. MaxLinear’s sharp revenue contraction and sustained losses contrast with NVE’s steady earnings and superior margins. Investors seeking stable, high-margin profiles would find NVE’s earnings durability more attractive despite its modest revenue dip.
Financial Ratios Comparison
These vital ratios act as a diagnostic tool to expose the underlying fiscal health, valuation premiums, and capital efficiency of the companies compared below:
| Ratios | MaxLinear, Inc. (MXL) | NVE Corporation (NVEC) |
|---|---|---|
| ROE | -47.5% (2024) | 24.2% (2025) |
| ROIC | -24.3% (2024) | 21.1% (2025) |
| P/E | -6.7 (2024) | 20.5 (2025) |
| P/B | 3.20 (2024) | 4.95 (2025) |
| Current Ratio | 1.77 (2024) | 28.40 (2025) |
| Quick Ratio | 1.28 (2024) | 22.03 (2025) |
| D/E | 0.29 (2024) | 0.01 (2025) |
| Debt-to-Assets | 17.2% (2024) | 1.4% (2025) |
| Interest Coverage | -15.5 (2024) | 0 (2025) |
| Asset Turnover | 0.42 (2024) | 0.40 (2025) |
| Fixed Asset Turnover | 4.65 (2024) | 8.91 (2025) |
| Payout Ratio | 0% (2024) | 128.4% (2025) |
| Dividend Yield | 0% (2024) | 6.28% (2025) |
| Fiscal Year | 2024 | 2025 |
Efficiency & Valuation Duel: The Vital Signs
Financial ratios act as the company’s DNA, revealing hidden risks and operational excellence that drive investor decisions.
MaxLinear, Inc.
MaxLinear struggles with deeply negative profitability metrics, including a -47% ROE and -68% net margin, signaling operational challenges. The stock trades at a negative P/E, which may reflect losses or accounting distortions, while its P/B ratio of 3.2 appears stretched. Absent dividends, MaxLinear reinvests heavily in R&D, dedicating 62% of revenue to innovation.
NVE Corporation
NVE demonstrates strong profitability, with a 24% ROE and 58% net margin, indicating robust operational efficiency. Its P/E of 20.5 suggests a fairly valued stock relative to growth prospects, despite a high P/B of 4.95. NVE rewards shareholders with a 6.3% dividend yield and maintains a very low debt level, reflecting solid financial health and capital discipline.
Profitability Strength vs. Innovation Challenge
NVE offers a superior balance of profitability and shareholder returns, with favorable ratios and sustainable dividends. MaxLinear’s heavy R&D focus and negative returns pose higher risk but potential long-term growth. Investors seeking operational stability lean toward NVE; those favoring innovation-driven recovery might consider MaxLinear.
Which one offers the Superior Shareholder Reward?
I compare MaxLinear, Inc. (MXL) and NVE Corporation (NVEC) on shareholder distributions. MXL pays no dividends, has no buybacks, and posts negative free cash flow (-$0.75/share in 2024), signaling weak cash returns. NVEC yields ~4.5%-6.3% with payout ratios above 100%, supported by strong free cash flow ($2.7/share) and robust operating margins (~62%). NVEC’s modest buyback activity complements its dividend, enhancing total returns sustainably. MXL’s zero payout and cash burn pose sustainability risks despite growth efforts. I conclude NVEC offers a superior, more reliable total shareholder reward in 2026.
Comparative Score Analysis: The Strategic Profile
The radar chart reveals the fundamental DNA and trade-offs of MaxLinear, Inc. and NVE Corporation through key financial performance metrics:
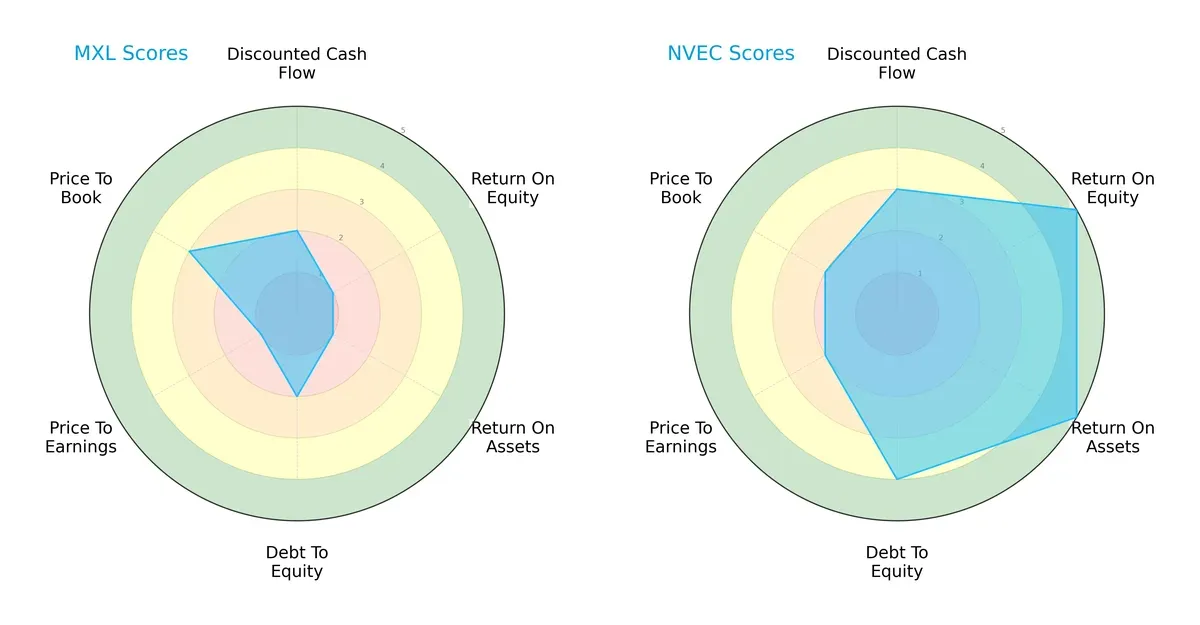
NVE Corporation dominates with a balanced profile, excelling in ROE (5 vs. 1) and ROA (5 vs. 1), signaling superior profitability and asset efficiency. MaxLinear, Inc. shows moderate strength in debt management (2 vs. 4) and book valuation (3 vs. 2) but lags significantly in earnings and cash flow metrics. NVE’s diversified edge contrasts with MaxLinear’s reliance on valuation bargains.
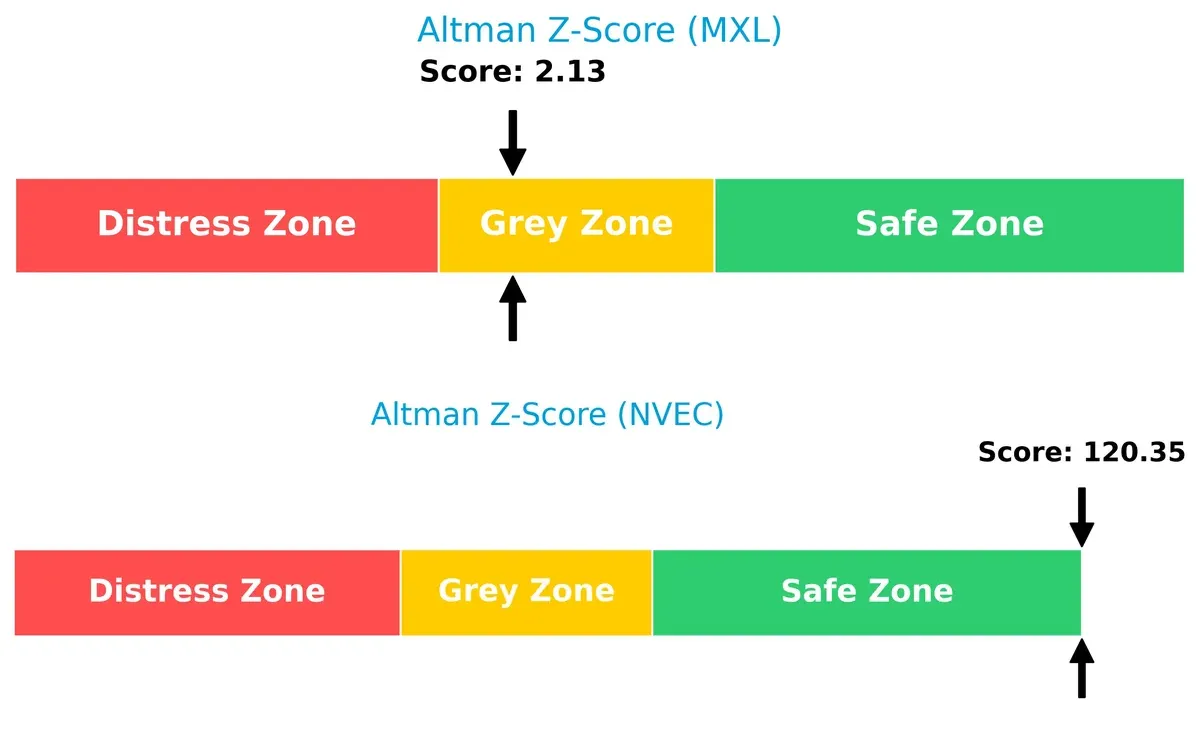
Bankruptcy Risk: Solvency Showdown
NVE Corporation’s Altman Z-Score (120.4) far surpasses MaxLinear’s 2.13, placing NVE firmly in the safe zone while MaxLinear remains in the grey zone, indicating higher bankruptcy risk and financial uncertainty for MaxLinear:
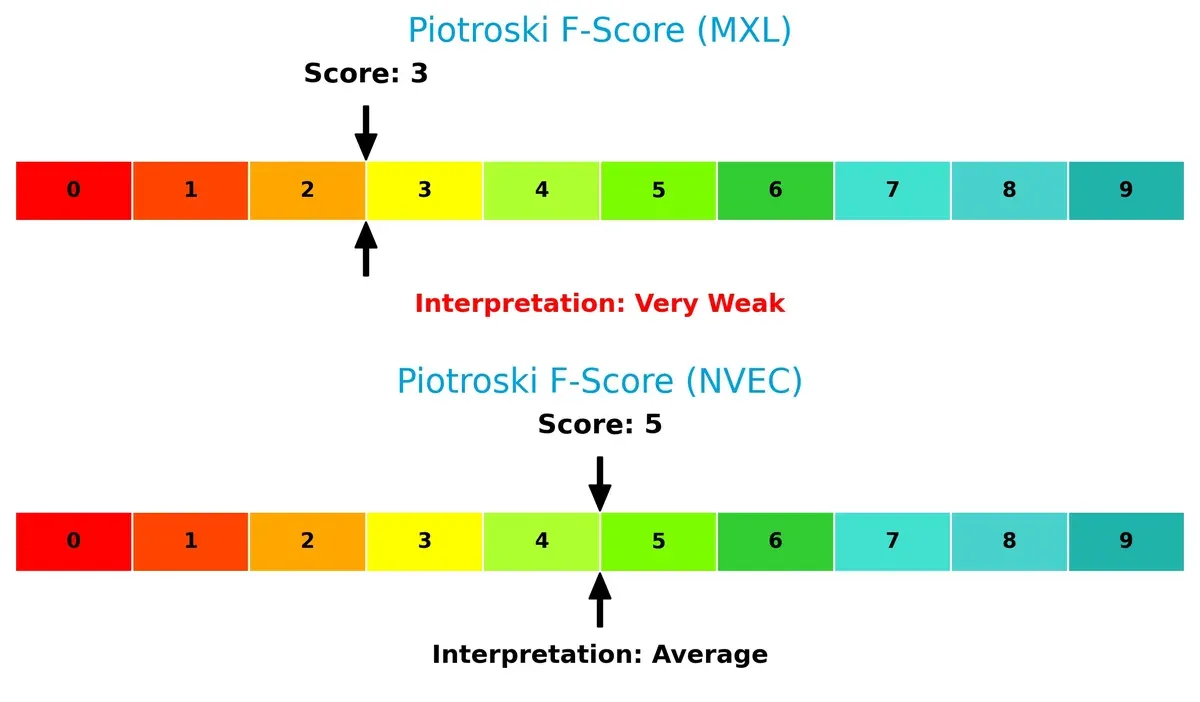
Financial Health: Quality of Operations
NVE scores a 5 on the Piotroski F-Score, reflecting average financial health and operational quality. MaxLinear’s score of 3 signals very weak financial fundamentals, raising red flags about internal efficiency and profitability:
How are the two companies positioned?
This section dissects the operational DNA of MaxLinear and NVE by comparing their revenue distribution and internal strengths and weaknesses. The goal is to confront their economic moats to identify which model offers the most resilient competitive advantage today.
Revenue Segmentation: The Strategic Mix
This visual comparison dissects how MaxLinear, Inc. and NVE Corporation diversify their income streams and where their primary sector bets lie:
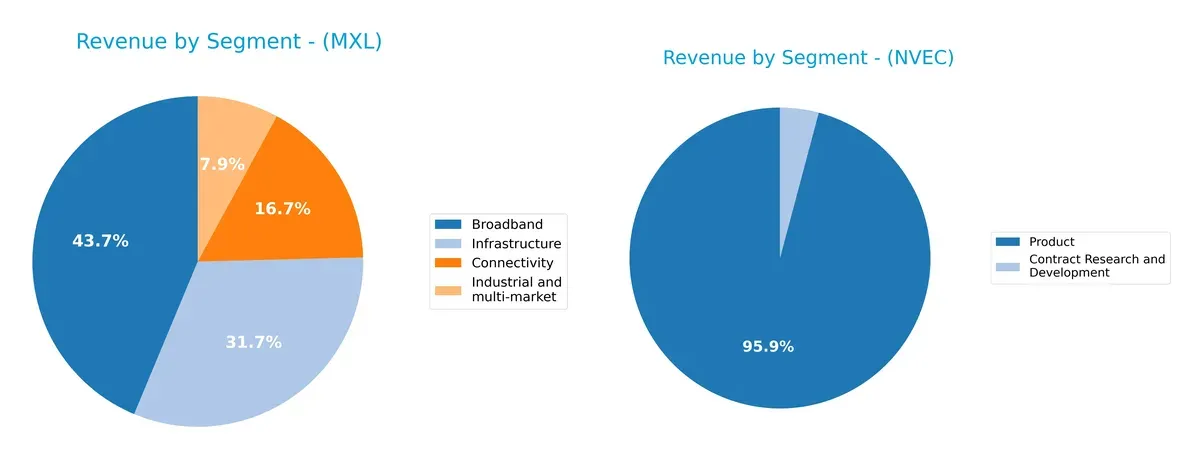
MaxLinear anchors its revenue in Broadband ($204M) and Infrastructure ($148M), with Connectivity and Industrial segments adding diversity. NVE Corporation pivots heavily on its Product segment ($25.9M in 2022), dwarfing its Contract Research and Development ($1.1M). MaxLinear’s balanced mix signals ecosystem resilience, while NVE’s concentration in Product highlights potential concentration risk despite strong market focus.
Strengths and Weaknesses Comparison
This table compares the Strengths and Weaknesses of MaxLinear, Inc. (MXL) and NVE Corporation (NVEC):
MXL Strengths
- Diversified revenue across Broadband, Connectivity, Industrial, Infrastructure
- Favorable current and quick ratios indicate solid liquidity
- Low debt-to-equity and debt-to-assets ratios show conservative leverage
- Strong fixed asset turnover reflects efficient use of long-term assets
NVEC Strengths
- High net margin, ROE, and ROIC demonstrate strong profitability
- Favorable interest coverage and low debt leverage support financial stability
- High fixed asset turnover indicates efficient asset utilization
- Balanced geographic revenue exposure including US, Europe, Asia Pacific
MXL Weaknesses
- Negative profitability ratios (net margin, ROE, ROIC) raise concerns
- Unfavorable interest coverage signals risk servicing debt
- High price-to-book ratio questions valuation efficiency
- Lower asset turnover suggests less operational efficiency
NVEC Weaknesses
- Unfavorable current ratio indicates potential short-term liquidity risk
- High price-to-book ratio may imply overvaluation
- Slightly unfavorable asset turnover reflects moderate operational efficiency
- Dividend yield is neutral, offering limited income advantage
Both companies display strong asset utilization and conservative leverage, but MXL struggles with profitability and liquidity. NVEC shows robust profitability but faces liquidity and valuation concerns. These factors will shape each company’s strategic priorities going forward.
The Moat Duel: Analyzing Competitive Defensibility
A structural moat protects long-term profits from relentless competitive pressure. Without it, firms lose pricing power and market share rapidly:
MaxLinear, Inc. (MXL): Technology Integration Moat
MaxLinear’s moat relies on its integrated SoC solutions blending RF, analog, and digital tech. Margins show pressure, and ROIC well below WACC signals value erosion. New product launches could stabilize margins but face fierce industry disruption in 2026.
NVE Corporation (NVEC): Spintronics Innovation Moat
NVE’s moat stems from proprietary spintronic technology, a niche with high barriers to entry. It posts strong ROIC above WACC and robust margin expansion, reflecting efficient capital use. Growth may slow short term but long-term demand for IoT sensors supports moat deepening.
Competitive Edge Showdown: Integration Complexity vs. Technological Innovation
NVE commands a wider and deeper moat with rising ROIC and consistent value creation. MaxLinear struggles with declining profitability and shrinking economic returns. NVE is better positioned to defend its market share amid evolving semiconductor demands.
Which stock offers better returns?
The past year shows divergent price moves for MaxLinear, Inc. and NVE Corporation, with both stocks experiencing bearish trends overall but recent acceleration in gains.
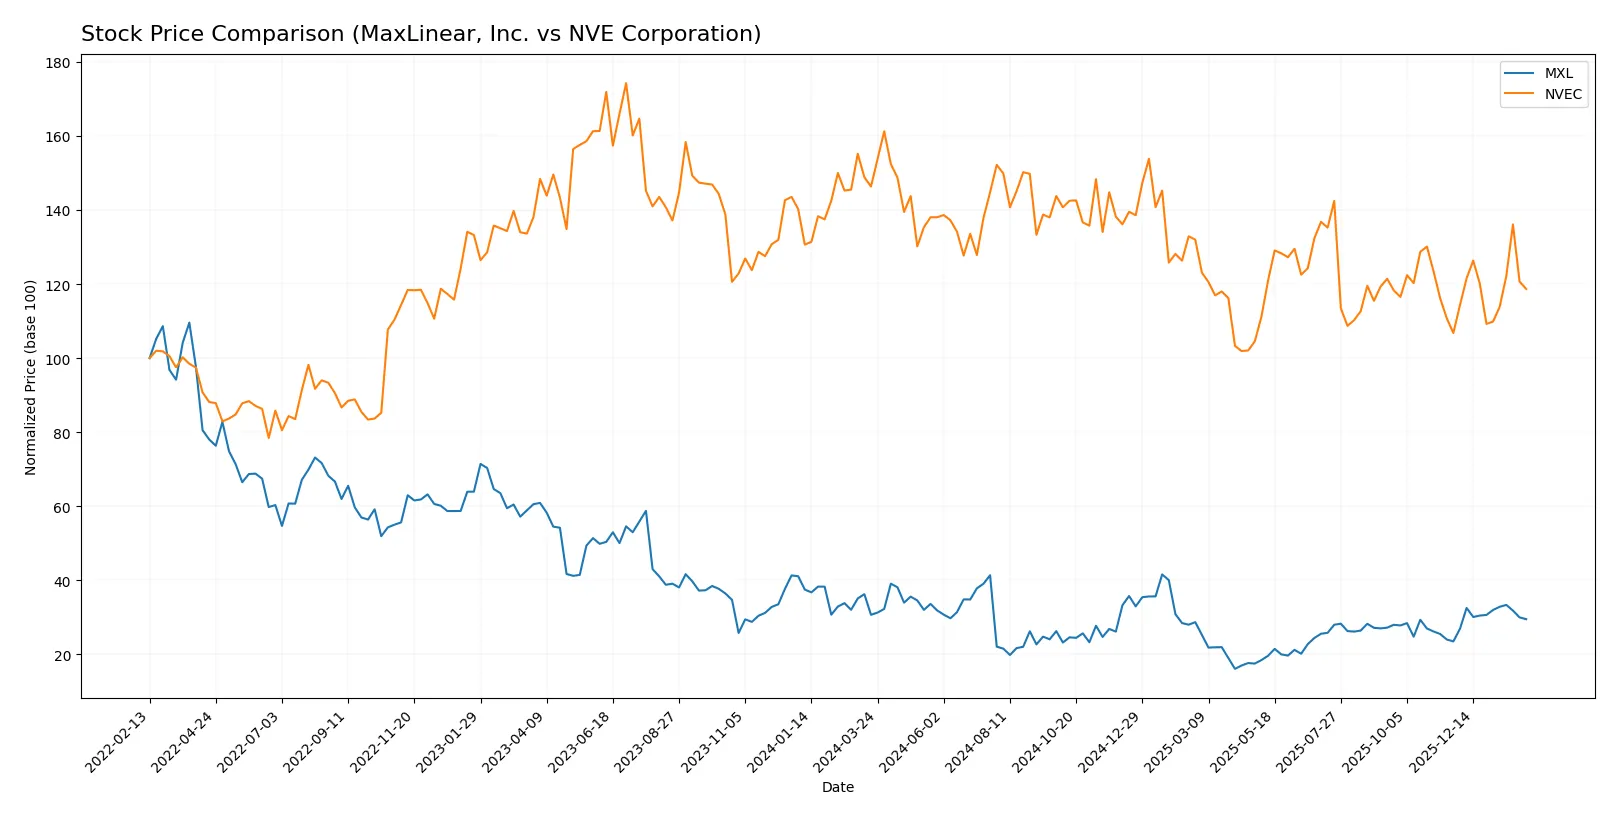
Trend Comparison
MaxLinear, Inc. fell 3.83% over 12 months, marking a bearish trend with accelerating decline. It swung between a 24.05 high and 9.31 low, showing moderate volatility (3.34 std dev).
NVE Corporation dropped 18.89% over the same period, confirming a bearish trend with accelerating losses. The stock fluctuated from 90.18 to 56.99, exhibiting higher volatility (7.55 std dev).
MaxLinear’s recent 25.51% rise outpaced NVE’s 11.15% gain, indicating stronger short-term recovery despite both showing overall yearly losses.
Target Prices
MaxLinear, Inc. shows a clear target price consensus reflecting moderate upside potential.
| Company | Target Low | Target High | Consensus |
|---|---|---|---|
| MaxLinear, Inc. | 15 | 25 | 21 |
The consensus target of $21 suggests analysts expect a roughly 23% gain from the current $17 price. No verified target price data is available for NVE Corporation.

Don’t Let Luck Decide Your Entry Point
Optimize your entry points with our advanced ProRealTime indicators. You’ll get efficient buy signals with precise price targets for maximum performance. Start outperforming now!
How do institutions grade them?
Here is a comparison of institutional grades for MaxLinear, Inc. and NVE Corporation:
MaxLinear, Inc. Grades
The following table summarizes recent grades from recognized financial institutions:
| Grading Company | Action | New Grade | Date |
|---|---|---|---|
| Wells Fargo | Maintain | Equal Weight | 2026-01-30 |
| Benchmark | Maintain | Buy | 2026-01-16 |
| Benchmark | Maintain | Buy | 2025-10-24 |
| Benchmark | Maintain | Buy | 2025-10-17 |
| Benchmark | Maintain | Buy | 2025-09-02 |
| Loop Capital | Maintain | Hold | 2025-08-04 |
| Wells Fargo | Maintain | Equal Weight | 2025-07-24 |
| Benchmark | Maintain | Buy | 2025-07-24 |
| Susquehanna | Maintain | Neutral | 2025-07-24 |
| Susquehanna | Maintain | Neutral | 2025-07-22 |
Which company has the best grades?
Only MaxLinear, Inc. has reliable institutional grades, predominantly Buy and Equal Weight ratings. NVE Corporation lacks grade data. Investors may find MaxLinear’s consistent Buy ratings a stronger signal of confidence.
Risks specific to each company
The following categories identify critical pressure points and systemic threats facing MaxLinear, Inc. and NVE Corporation in the 2026 market environment:
1. Market & Competition
MaxLinear, Inc.
- Faces intense semiconductor competition; struggles with negative margins and low ROIC.
NVE Corporation
- Niche spintronics focus limits competitors but market size is smaller; strong profitability.
2. Capital Structure & Debt
MaxLinear, Inc.
- Moderate debt with a D/E ratio of 0.29; interest coverage negative, signaling financial strain.
NVE Corporation
- Minimal debt with D/E ratio of 0.01; excellent interest coverage supports financial stability.
3. Stock Volatility
MaxLinear, Inc.
- Beta of 1.71 indicates high volatility, increasing investment risk.
NVE Corporation
- Beta of 1.22 shows moderate volatility, reflecting steadier price movements.
4. Regulatory & Legal
MaxLinear, Inc.
- Operates globally in complex RF and communication markets, subject to evolving regulations.
NVE Corporation
- Focus on spintronics and IoT devices faces fewer regulatory hurdles but requires IP protection vigilance.
5. Supply Chain & Operations
MaxLinear, Inc.
- Broad semiconductor supply chain exposure; risks from component shortages and manufacturing delays.
NVE Corporation
- Smaller scale operations reduce complexity but increase vulnerability to supplier disruptions.
6. ESG & Climate Transition
MaxLinear, Inc.
- Larger footprint in energy-intensive chip production; ESG initiatives critical amid rising investor scrutiny.
NVE Corporation
- Smaller operation size limits ESG impact; innovation in energy-efficient spintronics may align with climate goals.
7. Geopolitical Exposure
MaxLinear, Inc.
- Global supply chains and international sales expose it to trade tensions and tariffs.
NVE Corporation
- Primarily US-based operations reduce geopolitical risks but limit global market access.
Which company shows a better risk-adjusted profile?
MaxLinear’s biggest risk is its financial health, evidenced by negative margins and weak interest coverage. NVE’s primary risk lies in its niche market size and operational scale. NVE displays a superior risk-adjusted profile, supported by strong profitability, low debt, and a safe Altman Z-score. This contrast highlights MaxLinear’s urgent need to improve capital efficiency and profitability to mitigate risks in a competitive semiconductor market.
Final Verdict: Which stock to choose?
MaxLinear’s superpower lies in its aggressive investment in R&D, fueling innovation and potential market disruption. However, its consistent value destruction and negative profitability demand vigilance. It suits portfolios targeting high-risk, high-reward aggressive growth plays willing to weather volatility.
NVE Corporation commands a durable moat with a strong ROIC exceeding its cost of capital, signaling efficient capital use and sustained competitive advantage. Its financial safety profile surpasses MaxLinear’s, making it a more stable candidate for balanced Growth at a Reasonable Price (GARP) investors seeking consistent returns.
If you prioritize capital efficiency and long-term value creation, NVE stands out for its sustainable profitability and financial health. However, for those chasing bold innovation and potential turnaround, MaxLinear might offer higher upside despite its inherent risks and operational challenges.
Disclaimer: Investment carries a risk of loss of initial capital. The past performance is not a reliable indicator of future results. Be sure to understand risks before making an investment decision.
Go Further
I encourage you to read the complete analyses of MaxLinear, Inc. and NVE Corporation to enhance your investment decisions: