In the dynamic world of technology-driven software applications, The Trade Desk, Inc. (TTD) and Match Group, Inc. (MTCH) stand out as influential players with distinct yet overlapping market footprints. The Trade Desk excels in data-driven digital advertising platforms, while Match Group dominates the global online dating industry with a diverse portfolio of brands. This comparison explores their innovation strategies and growth potential to help you decide which company deserves a place in your investment portfolio. Stay tuned to discover which stock aligns best with your financial goals.

Table of contents
Companies Overview
I will begin the comparison between The Trade Desk, Inc. and Match Group, Inc. by providing an overview of these two companies and their main differences.
The Trade Desk Overview
The Trade Desk, Inc. is a technology company specializing in a self-service cloud platform that enables buyers to create, manage, and optimize data-driven digital advertising campaigns. Operating across various ad formats and devices, it serves advertising agencies and service providers globally. Founded in 2009 and headquartered in Ventura, California, The Trade Desk holds a significant market position in software applications for advertising technology.
Match Group Overview
Match Group, Inc. operates in the software application sector with a focus on providing dating products worldwide. Its portfolio includes well-known brands such as Tinder, Match, OkCupid, and Hinge. Incorporated in 1986 and based in Dallas, Texas, Match Group has established itself as a major player in online dating services, leveraging its diverse brand portfolio to reach a broad customer base globally.
Key similarities and differences
Both companies operate in the technology sector within the software application industry, with a focus on digital platforms serving global markets. However, The Trade Desk concentrates on digital advertising technology, while Match Group specializes in online dating services. The Trade Desk has a larger market capitalization (approximately $17.3B) compared to Match Group’s $7.4B, reflecting differences in scale and market focus.
Income Statement Comparison
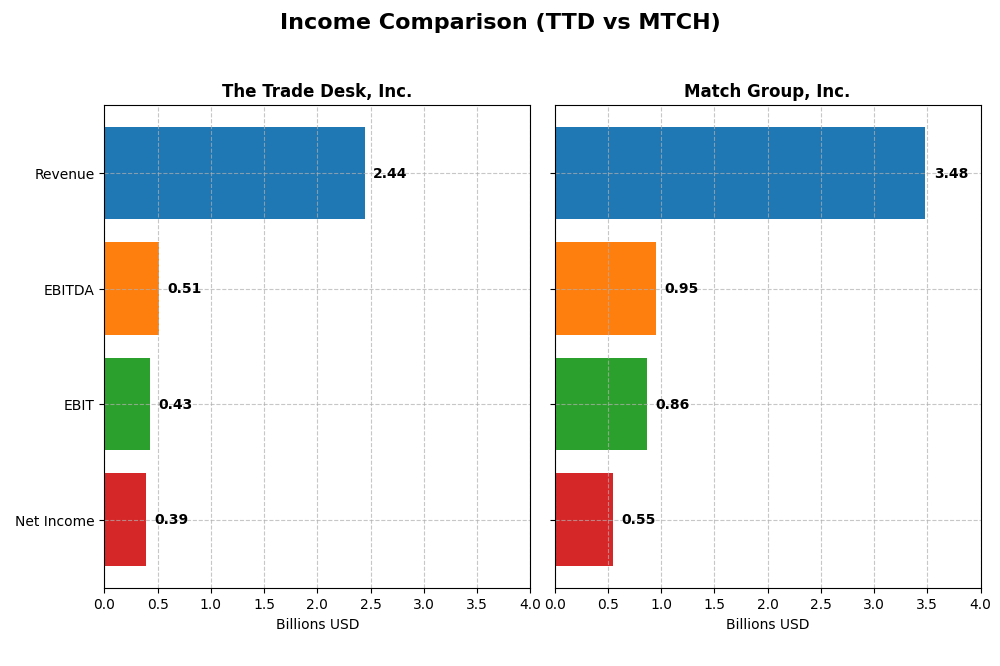
The following table compares the latest fiscal year income statement metrics for The Trade Desk, Inc. and Match Group, Inc., highlighting key financial figures.
| Metric | The Trade Desk, Inc. (TTD) | Match Group, Inc. (MTCH) |
|---|---|---|
| Market Cap | 17.3B | 7.4B |
| Revenue | 2.44B | 3.48B |
| EBITDA | 515M | 952M |
| EBIT | 427M | 864M |
| Net Income | 393M | 551M |
| EPS | 0.80 | 2.12 |
| Fiscal Year | 2024 | 2024 |
Income Statement Interpretations
The Trade Desk, Inc.
The Trade Desk showed strong revenue growth from 2020 to 2024, increasing from $836M to $2.44B, with net income rising from $242M to $393M. Margins remained healthy, with a gross margin around 80.7% and net margin at 16.1%. In 2024, revenue growth accelerated sharply by 25.6%, supported by a doubling of EBIT and a 74.9% increase in net margin.
Match Group, Inc.
Match Group’s revenue grew steadily from $2.39B in 2020 to $3.48B in 2024, with net income jumping from $162M to $551M. Gross margin was stable near 71.5%, while EBIT margin improved to 24.8%. However, 2024 saw modest 3.4% revenue growth with declines in EBIT (-7.7%) and net margin (-18.2%), indicating some margin pressure despite overall growth.
Which one has the stronger fundamentals?
The Trade Desk exhibits stronger recent growth dynamics, with significant improvements in revenue, EBIT, and net margin over the last year, supported by high gross margins and zero interest expense. Match Group has a higher EBIT margin and impressive long-term net income growth, but its slower recent revenue growth and margin contractions suggest less momentum. Overall, both show favorable fundamentals but with contrasting growth and profitability profiles.
Financial Ratios Comparison
This table presents a side-by-side comparison of key financial ratios for The Trade Desk, Inc. (TTD) and Match Group, Inc. (MTCH) based on their most recent fiscal year data, 2024.
| Ratios | The Trade Desk, Inc. (TTD) | Match Group, Inc. (MTCH) |
|---|---|---|
| ROE | 13.33% | -865.98% |
| ROIC | 10.02% | 16.38% |
| P/E | 146.77 | 15.44 |
| P/B | 19.56 | -133.75 |
| Current Ratio | 1.86 | 2.54 |
| Quick Ratio | 1.86 | 2.54 |
| D/E | 0.11 | -62.09 |
| Debt-to-Assets | 5.11% | 88.51% |
| Interest Coverage | 0 (not available) | 5.14 |
| Asset Turnover | 0.40 | 0.78 |
| Fixed Asset Turnover | 5.17 | 22.00 |
| Payout ratio | 0 | 0 |
| Dividend yield | 0 | 0 |
Interpretation of the Ratios
The Trade Desk, Inc.
The Trade Desk shows a strong overall ratio profile with 57% favorable and only 29% unfavorable metrics. Key strengths include a solid net margin of 16.08%, a favorable return on invested capital (10.02%), and a healthy current ratio of 1.86 indicating good liquidity. Concerns include a high price-to-earnings ratio of 146.77 and price-to-book of 19.56, suggesting potential overvaluation. The company does not pay dividends, likely reflecting a reinvestment strategy to support growth.
Match Group, Inc.
Match Group presents 64% favorable ratios, with notable strengths in return on invested capital (16.38%) and a strong current ratio of 2.54. However, it faces challenges such as a highly negative return on equity (-865.98%) and a high debt-to-assets ratio of 88.51%, indicating significant leverage. The price-to-earnings ratio is moderate at 15.44. The company pays dividends, but its dividend yield is zero, suggesting a cautious or limited payout approach despite share buybacks or reinvestment priorities.
Which one has the best ratios?
Both companies exhibit favorable overall ratio profiles, though Match Group has a slightly higher percentage of favorable metrics at 64% compared to The Trade Desk’s 57%. Match Group’s stronger return on capital metrics contrast with its concerning leverage and negative ROE, while The Trade Desk’s high valuation multiples may deter some investors. The choice depends on weighing growth potential against financial structure and valuation.
Strategic Positioning
This section compares the strategic positioning of The Trade Desk, Inc. and Match Group, Inc., focusing on Market position, Key segments, and Exposure to technological disruption:
The Trade Desk, Inc.
- Operates a cloud-based digital advertising platform in a competitive software market.
- Focuses on digital advertising campaigns across multiple ad formats and channels.
- Exposure to digital advertising technology trends with potential impact on ad delivery.
Match Group, Inc.
- Provides a portfolio of dating brands in a competitive application software space.
- Key segments include dating services and other products primarily in online dating.
- Faces technological changes in online dating and user engagement platforms.
The Trade Desk, Inc. vs Match Group, Inc. Positioning
The Trade Desk has a diversified advertising platform across multiple media formats, while Match Group concentrates on online dating brands. The Trade Desk’s broad ad technology offers versatility, whereas Match Group’s niche focus provides strong brand recognition but less diversification.
Which has the best competitive advantage?
Match Group shows a slightly favorable moat with value creation despite declining profitability, while The Trade Desk has a slightly unfavorable moat, shedding value and declining returns, indicating a stronger competitive advantage for Match Group based on MOAT evaluation.
Stock Comparison
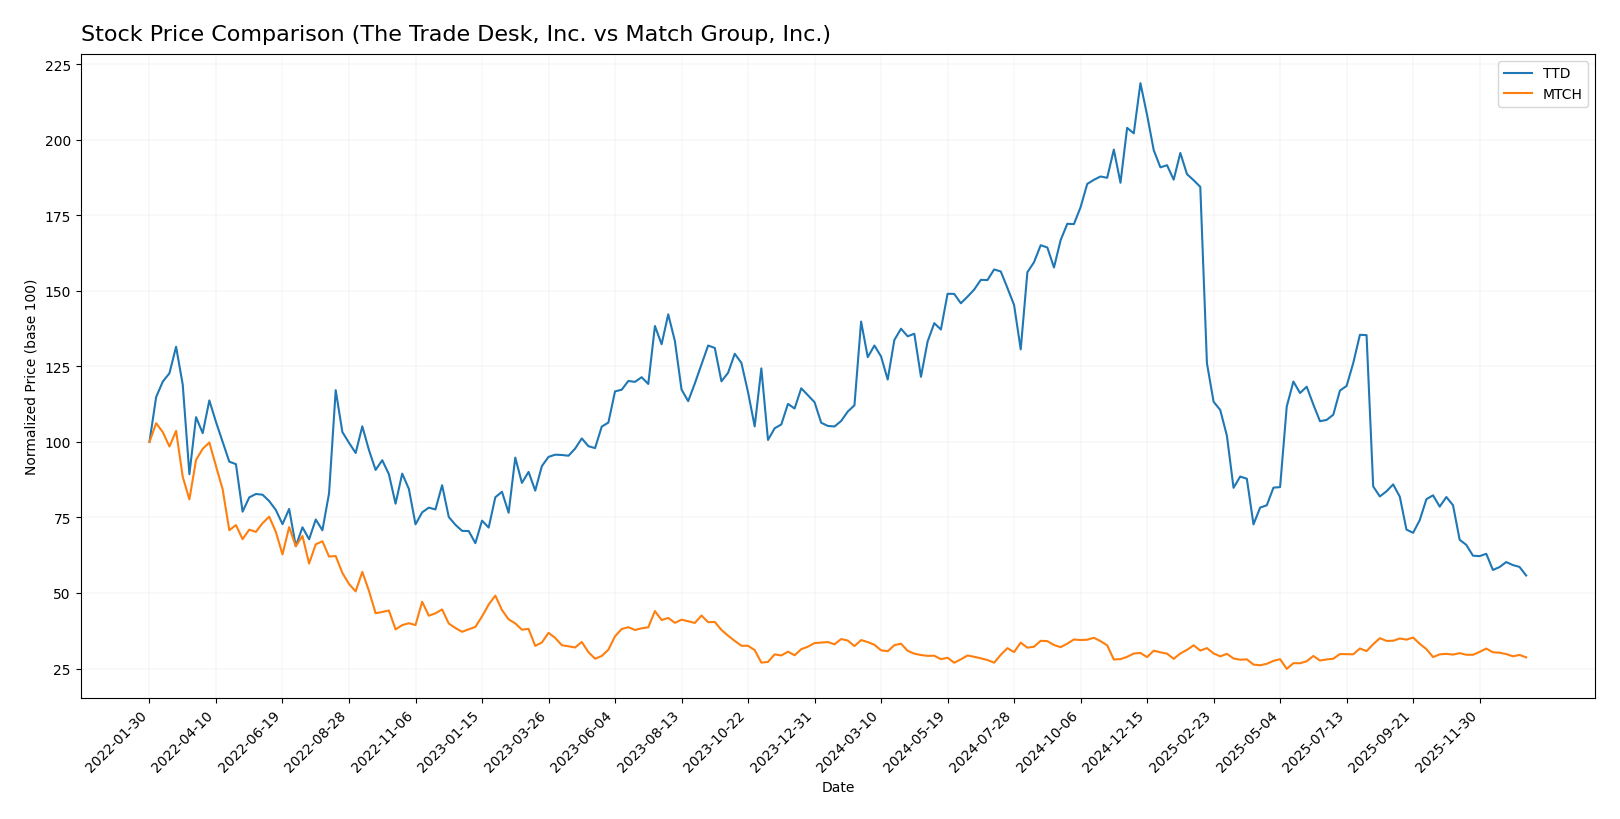
The stock prices of The Trade Desk, Inc. (TTD) and Match Group, Inc. (MTCH) have both exhibited bearish trends over the past 12 months, with notable declines and contrasting volume dynamics shaping their trading patterns.
Trend Analysis
The Trade Desk, Inc. recorded a -56.43% price change over the past year, indicating a strong bearish trend with deceleration. The stock showed high volatility, with prices ranging from 139.11 at its peak to 35.48 at its lowest point.
Match Group, Inc. also posted a bearish trend with a -14.98% price change over 12 months, accompanied by deceleration and lower volatility than TTD. Its highest price was 38.51, and the lowest was 27.18.
Comparing both stocks, The Trade Desk delivered the lowest market performance with a significantly larger decline than Match Group, which experienced a milder bearish trend overall.
Target Prices
The current analyst consensus presents a varied but insightful outlook on these technology stocks.
| Company | Target High | Target Low | Consensus |
|---|---|---|---|
| The Trade Desk, Inc. | 98 | 39 | 56.73 |
| Match Group, Inc. | 43 | 33 | 36.29 |
For The Trade Desk, the consensus target price of 56.73 USD suggests a significant upside from the current price of 35.48 USD. Match Group’s consensus at 36.29 USD also indicates moderate growth potential compared to its current price of 31.34 USD.
Analyst Opinions Comparison
This section compares analysts’ ratings and grades for The Trade Desk, Inc. (TTD) and Match Group, Inc. (MTCH):
Rating Comparison
TTD Rating
- Rating: B, evaluated as Very Favorable overall.
- Discounted Cash Flow Score: 4, indicating a favorable valuation based on future cash flows.
- ROE Score: 4, showing efficient profit generation from shareholders’ equity.
- ROA Score: 4, reflecting effective asset utilization to generate earnings.
- Debt To Equity Score: 3, showing moderate financial risk with balanced debt levels.
- Overall Score: 3, indicating a moderate overall financial standing.
MTCH Rating
- Rating: B, evaluated as Very Favorable overall.
- Discounted Cash Flow Score: 5, indicating a very favorable valuation based on future cash flows.
- ROE Score: 1, indicating very unfavorable efficiency in generating profit from equity.
- ROA Score: 5, reflecting very favorable asset utilization to generate earnings.
- Debt To Equity Score: 1, indicating very unfavorable financial risk due to high debt.
- Overall Score: 3, indicating a moderate overall financial standing.
Which one is the best rated?
Both TTD and MTCH share the same overall rating of B and a moderate overall score of 3. MTCH scores higher on discounted cash flow and ROA but has poor ROE and debt-to-equity scores. TTD shows more balanced scores across ROE, ROA, and debt metrics.
Scores Comparison
Here is a comparison of the Altman Z-Score and Piotroski Score for The Trade Desk, Inc. and Match Group, Inc.:
The Trade Desk, Inc. Scores
- Altman Z-Score: 4.30, indicating a safe zone with low bankruptcy risk.
- Piotroski Score: 5, reflecting average financial strength.
Match Group, Inc. Scores
- Altman Z-Score: 0.52, indicating distress zone with high bankruptcy risk.
- Piotroski Score: 8, reflecting very strong financial strength.
Which company has the best scores?
Based solely on the provided data, The Trade Desk has a stronger Altman Z-Score indicating financial safety, while Match Group has a higher Piotroski Score showing stronger financial health. Each company leads in one key score.
Grades Comparison
The following presents a comparison of recent grades assigned to The Trade Desk, Inc. and Match Group, Inc.:
The Trade Desk, Inc. Grades
This table summarizes recent grades assigned by notable financial institutions to The Trade Desk, Inc.:
| Grading Company | Action | New Grade | Date |
|---|---|---|---|
| Morgan Stanley | Maintain | Equal Weight | 2026-01-13 |
| Wells Fargo | Maintain | Equal Weight | 2026-01-12 |
| Cantor Fitzgerald | Maintain | Neutral | 2026-01-08 |
| Wolfe Research | Maintain | Outperform | 2026-01-06 |
| Guggenheim | Maintain | Buy | 2026-01-05 |
| Jefferies | Maintain | Hold | 2025-12-11 |
| Wedbush | Maintain | Neutral | 2025-12-08 |
| DA Davidson | Maintain | Buy | 2025-11-10 |
| Truist Securities | Maintain | Buy | 2025-11-07 |
| Wells Fargo | Maintain | Equal Weight | 2025-11-07 |
The Trade Desk’s grades show a mix of Buy, Hold, Neutral, and Equal Weight ratings, indicating a generally positive but cautious outlook.
Match Group, Inc. Grades
This table summarizes recent grades assigned by notable financial institutions to Match Group, Inc.:
| Grading Company | Action | New Grade | Date |
|---|---|---|---|
| Morgan Stanley | Maintain | Equal Weight | 2026-01-13 |
| Truist Securities | Maintain | Hold | 2025-11-05 |
| Evercore ISI Group | Maintain | In Line | 2025-11-05 |
| Wells Fargo | Maintain | Equal Weight | 2025-11-05 |
| Morgan Stanley | Maintain | Equal Weight | 2025-10-20 |
| Susquehanna | Maintain | Positive | 2025-08-07 |
| Evercore ISI Group | Maintain | In Line | 2025-08-06 |
| JP Morgan | Maintain | Neutral | 2025-08-06 |
| UBS | Maintain | Neutral | 2025-07-23 |
| Wells Fargo | Maintain | Equal Weight | 2025-06-27 |
Match Group’s grades primarily cluster around Equal Weight, Neutral, and Hold, reflecting a more conservative sentiment.
Which company has the best grades?
The Trade Desk, Inc. has received a larger number of Buy ratings compared to Match Group, Inc., which mostly holds Equal Weight and Neutral grades. This difference may suggest a more optimistic outlook from analysts on The Trade Desk, potentially impacting investor sentiment and confidence.
Strengths and Weaknesses
The following table summarizes key strengths and weaknesses of The Trade Desk, Inc. (TTD) and Match Group, Inc. (MTCH) based on recent financial and strategic data.
| Criterion | The Trade Desk, Inc. (TTD) | Match Group, Inc. (MTCH) |
|---|---|---|
| Diversification | Moderate; focused on digital advertising | High; diverse dating and other service segments |
| Profitability | Moderate profitability; ROIC 10.02%, net margin 16.08% | Strong profitability; ROIC 16.38%, net margin 15.84% |
| Innovation | Strong in programmatic ad tech but declining ROIC trend | Innovative in online dating but facing profitability decline |
| Global presence | Solid presence but less diversified globally | Extensive global footprint in dating services |
| Market Share | Growing but challenged by high valuation ratios | Leading market share in dating industry |
Key takeaways: Match Group shows stronger value creation and diversification, though both companies face declining ROIC trends. The Trade Desk maintains favorable margins but has less diversification and high valuation risks. Caution is advised due to declining profitability trends.
Risk Analysis
Below is a comparison of key risks for The Trade Desk, Inc. (TTD) and Match Group, Inc. (MTCH) based on their latest financial and operational data for 2024.
| Metric | The Trade Desk, Inc. (TTD) | Match Group, Inc. (MTCH) |
|---|---|---|
| Market Risk | Beta 1.105; high valuation with PE 146.77 increases sensitivity to market swings | Beta 1.334; moderate PE 15.44 but volatile sector exposure |
| Debt Level | Low debt-to-equity 0.11; debt/assets 5.11% (favorable) | High leverage; debt-to-assets 88.51% (unfavorable) |
| Regulatory Risk | Moderate; operates in digital advertising with evolving data privacy laws | Elevated; global dating services face diverse regulations and content liabilities |
| Operational Risk | Medium; reliance on platform stability and algorithm accuracy | Medium-high; dependence on user engagement and brand reputation |
| Environmental Risk | Low; primarily software business with minimal direct impact | Low; digital services with limited environmental footprint |
| Geopolitical Risk | Moderate; international ad markets subject to geopolitical tensions | Moderate; global presence, sensitive to international market access |
The most impactful risks are Match Group’s high debt level and regulatory challenges given its global footprint and user data sensitivity. The Trade Desk’s valuation exposes it to market volatility risk despite its strong financial stability and low debt. Investors should weigh Match’s financial distress signals against its strong operational positioning, while monitoring The Trade Desk’s price multiples carefully.
Which Stock to Choose?
The Trade Desk, Inc. (TTD) shows strong income growth with a 25.63% revenue increase in 2024 and favorable profitability ratios, including a 16.08% net margin and 10.02% ROIC. Its low debt and a “Very Favorable” B rating reflect financial stability despite a slightly unfavorable valuation.
Match Group, Inc. (MTCH) exhibits moderate income growth with a 3.41% revenue increase in 2024 and favorable profitability metrics, including a 15.84% net margin and 16.38% ROIC. However, it carries high debt levels and a “Very Favorable” B rating, with mixed financial ratios reflecting some risk.
Investors seeking growth might find TTD’s robust income evolution and favorable financial ratios appealing, while those with a tolerance for higher leverage and focused on value creation could view MTCH’s solid ROIC and strong Piotroski score as advantageous. The choice may depend on the investor’s risk profile and preference for growth versus financial leverage.
Disclaimer: Investment carries a risk of loss of initial capital. The past performance is not a reliable indicator of future results. Be sure to understand risks before making an investment decision.
Go Further
I encourage you to read the complete analyses of The Trade Desk, Inc. and Match Group, Inc. to enhance your investment decisions: