Investors seeking growth in the technology sector often face tough choices between innovative companies with distinct market focuses. ServiceTitan, Inc. (TTAN) specializes in software solutions for field service management, streamlining operations in residential and commercial infrastructure. Meanwhile, Match Group, Inc. (MTCH) dominates the digital dating space with a broad portfolio of popular platforms. This article will analyze both companies’ strategies and market positions to help you decide which could be the more compelling investment opportunity.
Table of contents
Companies Overview
I will begin the comparison between ServiceTitan and Match Group by providing an overview of these two companies and their main differences.
ServiceTitan Overview
ServiceTitan, Inc. operates in the software application industry, focusing on field service management for residential and commercial infrastructure. Founded in 2008 and headquartered in Glendale, CA, it offers solutions to streamline installation, maintenance, and servicing operations. With a market capitalization of $8.5B and 3,049 employees, the company is a growing player in technology-driven service solutions.
Match Group Overview
Match Group, Inc. specializes in global dating products, managing well-known brands such as Tinder, Match, and OkCupid. Established in 1986 and based in Dallas, TX, it serves a broad user base through its diverse portfolio. The company has a market cap of $7.4B and employs approximately 2,500 people, positioning itself as a leader in digital social connection platforms.
Key similarities and differences
Both companies operate within the technology sector and the software application industry, but their business models serve distinct markets: ServiceTitan targets service management for physical infrastructure, while Match Group focuses on digital consumer dating services. ServiceTitan’s beta is negative (-0.85), indicating less volatility relative to the market, whereas Match Group’s beta is 1.33, suggesting higher market sensitivity. Their employee counts and market caps are comparable, reflecting mid-sized tech firms with different end-user engagements.
Income Statement Comparison
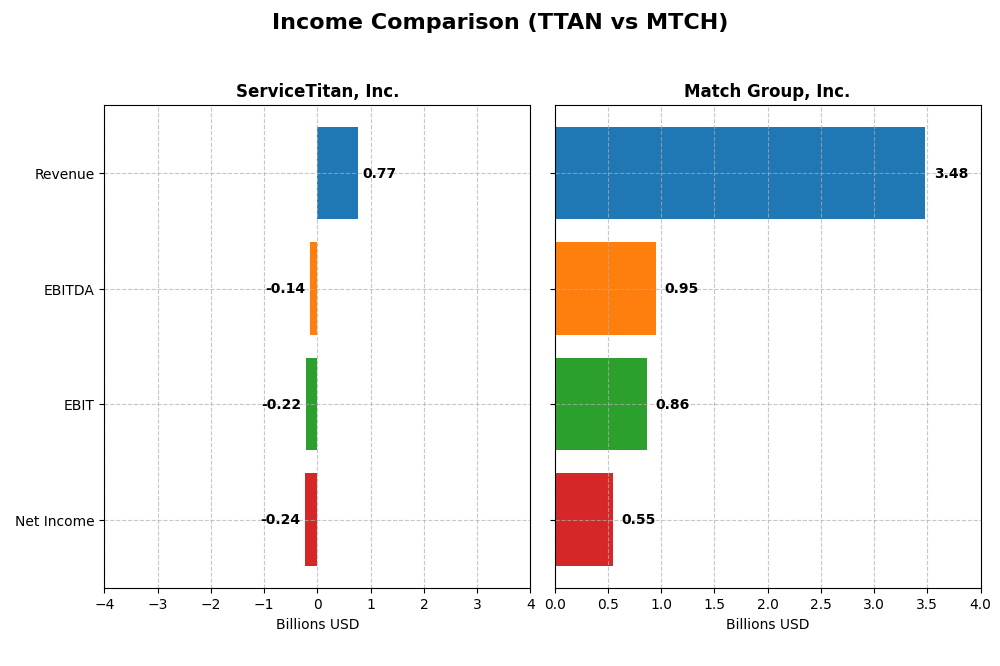
Below is a side-by-side comparison of key income statement metrics for ServiceTitan, Inc. and Match Group, Inc. for their most recent fiscal years.
| Metric | ServiceTitan, Inc. (TTAN) | Match Group, Inc. (MTCH) |
|---|---|---|
| Market Cap | 8.5B | 7.4B |
| Revenue | 772M | 3.48B |
| EBITDA | -141M | 952M |
| EBIT | -221M | 864M |
| Net Income | -239M | 551M |
| EPS | -8.53 | 2.12 |
| Fiscal Year | 2025 | 2024 |
Income Statement Interpretations
ServiceTitan, Inc.
ServiceTitan showed strong revenue growth of 65.0% from 2023 to 2025, reaching $772M in 2025, with gross margin stable at 64.9%. Despite this, operating and net margins remained negative, with net loss widening to -$239M in 2025. The latest year showed continued revenue acceleration but declining EBIT and EPS, indicating margin pressure amid higher expenses.
Match Group, Inc.
Match Group’s revenues grew steadily by 45.5% over 2020-2024, hitting $3.48B in 2024 with a robust gross margin of 71.5%. EBIT margin remained healthy at 24.8%, though growth slowed in 2024 with slight declines in EBIT and net margin. Net income reached $551M, reflecting solid profitability despite a modest margin contraction in the last year.
Which one has the stronger fundamentals?
Match Group presents stronger fundamentals with consistent profitability, favorable margins, and significant net income growth, despite some recent margin softness. ServiceTitan, while growing rapidly in revenue, struggles with persistent losses and negative margins, reflecting higher operational costs and weaker earnings quality. Overall, Match Group’s income statement indicates a more stable and profitable business model.
Financial Ratios Comparison
The table below compares key financial ratios for ServiceTitan, Inc. and Match Group, Inc. based on their most recent fiscal year data, providing a snapshot of their profitability, liquidity, leverage, and valuation metrics.
| Ratios | ServiceTitan, Inc. (TTAN) FY 2025 | Match Group, Inc. (MTCH) FY 2024 |
|---|---|---|
| ROE | -16.4% | -865.9% |
| ROIC | -14.1% | 16.4% |
| P/E | -18.1 | 15.4 |
| P/B | 2.98 | -133.7 |
| Current Ratio | 3.74 | 2.54 |
| Quick Ratio | 3.74 | 2.54 |
| D/E | 0.114 | -62.1 |
| Debt-to-Assets | 9.35% | 88.5% |
| Interest Coverage | -14.8 | 5.14 |
| Asset Turnover | 0.44 | 0.78 |
| Fixed Asset Turnover | 9.57 | 22.0 |
| Payout ratio | 0 | 0 |
| Dividend yield | 0 | 0 |
Interpretation of the Ratios
ServiceTitan, Inc.
ServiceTitan shows a mixed ratio profile with 42.86% favorable and 50% unfavorable ratios, leading to a slightly unfavorable overall view. Key concerns include negative net margin (-30.98%), ROE (-16.44%), and interest coverage (-14.26). The company has a strong quick ratio (3.74) and low debt (debt to assets 9.35%). ServiceTitan does not pay dividends, likely reflecting its current unprofitable status and reinvestment strategy.
Match Group, Inc.
Match Group presents a mostly favorable ratio set, with 64.29% favorable and only 21.43% unfavorable ratios. Positive aspects include a solid net margin (15.84%), ROIC (16.38%), and interest coverage (5.4). However, ROE is deeply negative (-865.98%), and debt to assets is high at 88.51%. The company pays dividends, but with a 0% dividend yield, indicating limited current shareholder returns or possible focus on other capital allocation priorities.
Which one has the best ratios?
Match Group displays a healthier ratio profile overall, with more favorable metrics and fewer red flags than ServiceTitan. While Match Group’s ROE and debt levels raise concerns, its profitability and cash flow ratios suggest a stronger operational footing. ServiceTitan’s negative profitability and coverage ratios contribute to a less favorable assessment despite some liquidity strengths.
Strategic Positioning
This section compares the strategic positioning of ServiceTitan (TTAN) and Match Group (MTCH) based on market position, key segments, and exposure to technological disruption:
ServiceTitan, Inc.
- Mid-size market cap in software with low beta, facing moderate competitive pressure.
- Focused on field service software with platform and subscription revenues driving growth.
- Limited explicit exposure to technological disruption mentioned in provided data.
Match Group, Inc.
- Large market cap in software, higher beta, operating in a competitive dating market.
- Concentrated in dating products globally, with multiple well-known brands generating revenue.
- No specific mention of technological disruption in dating services within data.
ServiceTitan vs Match Group Positioning
ServiceTitan pursues a diversified B2B software approach in field services, while Match Group concentrates on global dating platforms. ServiceTitan’s platform and subscription model contrasts with Match’s brand portfolio, reflecting different sector focuses and revenue drivers.
Which has the best competitive advantage?
Based on MOAT evaluation, Match Group shows a slightly favorable competitive advantage by creating value despite declining profitability, whereas ServiceTitan is currently shedding value with an unfavorable moat status.
Stock Comparison
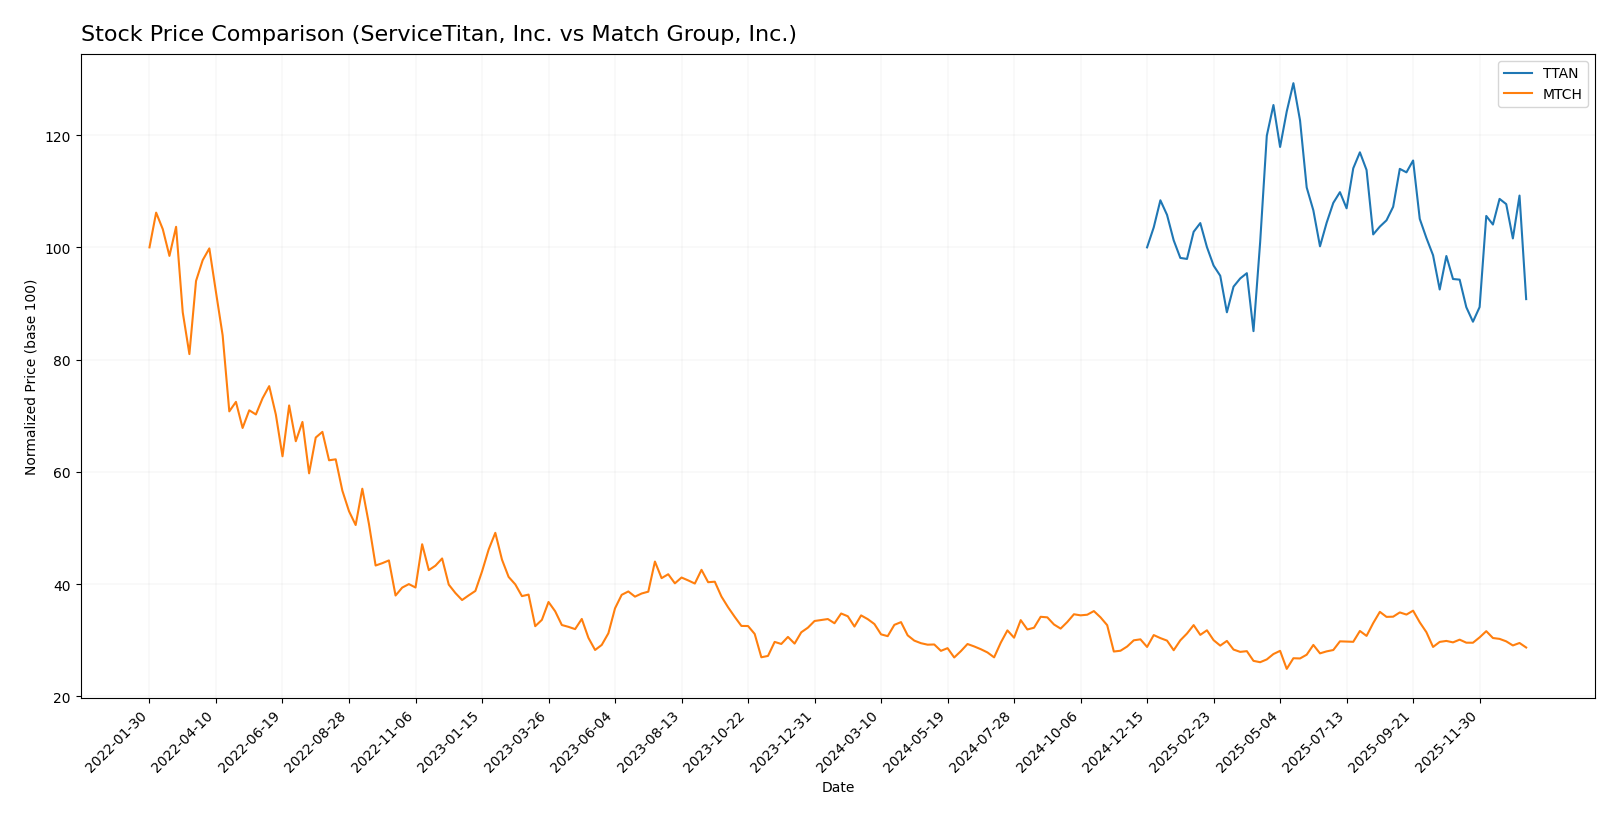
The stock price movements of ServiceTitan, Inc. (TTAN) and Match Group, Inc. (MTCH) over the past 12 months reveal distinct bearish trends with varying degrees of volatility and trading volume dynamics.
Trend Analysis
ServiceTitan, Inc. (TTAN) experienced a bearish trend with a -9.22% price change over the past year, marked by accelerating decline and high volatility (std deviation 9.86). The stock ranged between 85.07 and 129.26.
Match Group, Inc. (MTCH) showed a bearish trend as well, with a -14.98% price change over the past year. The decline decelerated, volatility was lower (std deviation 2.64), and prices fluctuated between 27.18 and 38.51.
Comparing both, TTAN outperformed MTCH with a smaller decline in price over the year, despite higher volatility and accelerating downward momentum.
Target Prices
Analysts present a clear consensus on target prices for ServiceTitan, Inc. and Match Group, Inc.
| Company | Target High | Target Low | Consensus |
|---|---|---|---|
| ServiceTitan, Inc. | 145 | 117 | 132.44 |
| Match Group, Inc. | 43 | 33 | 36.29 |
The target consensus for ServiceTitan suggests a strong upside from its current price of 90.78 USD, while Match Group’s consensus also implies modest potential growth compared to its current 31.34 USD price.
Analyst Opinions Comparison
This section compares analysts’ ratings and grades for ServiceTitan, Inc. and Match Group, Inc.:
Rating Comparison
TTAN Rating
- Rating: C-, considered very favorable overall.
- Discounted Cash Flow Score: 1, indicating very unfavorable valuation based on future cash flow projections.
- Return on Equity Score: 1, very unfavorable efficiency in generating profit from equity.
- Return on Assets Score: 1, very unfavorable asset utilization to generate earnings.
- Debt To Equity Score: 3, moderate financial risk with balanced debt to equity ratio.
- Overall Score: 1, very unfavorable overall financial standing.
MTCH Rating
- Rating: B, considered very favorable overall.
- Discounted Cash Flow Score: 5, indicating very favorable valuation based on future cash flow projections.
- Return on Equity Score: 1, very unfavorable efficiency in generating profit from equity.
- Return on Assets Score: 5, very favorable asset utilization to generate earnings.
- Debt To Equity Score: 1, very unfavorable financial risk due to high reliance on debt compared to equity.
- Overall Score: 3, moderate overall financial standing.
Which one is the best rated?
Based strictly on the data, Match Group holds a better overall rating with a B and a moderate overall score of 3 versus ServiceTitan’s C- and very unfavorable score of 1. Match Group’s stronger discounted cash flow and return on assets scores contribute significantly to its higher rating.
Scores Comparison
The scores comparison between ServiceTitan and Match Group illustrates their financial health evaluations:
ServiceTitan Scores
- Altman Z-Score: 15.74, indicating a safe zone status.
- Piotroski Score: 6, reflecting average financial strength.
Match Group Scores
- Altman Z-Score: 0.52, indicating a distress zone status.
- Piotroski Score: 8, reflecting very strong financial strength.
Which company has the best scores?
ServiceTitan has a significantly higher Altman Z-Score, signaling strong financial stability. Match Group shows better Piotroski strength but faces higher bankruptcy risk. Each score highlights different financial aspects.
Grades Comparison
Here is a detailed comparison of the latest grades issued by respected financial institutions for both companies:
ServiceTitan, Inc. Grades
The table below shows recent grades and recommendations for ServiceTitan, Inc. from established grading firms.
| Grading Company | Action | New Grade | Date |
|---|---|---|---|
| Piper Sandler | Maintain | Overweight | 2025-12-05 |
| BMO Capital | Maintain | Outperform | 2025-12-05 |
| TD Cowen | Maintain | Buy | 2025-12-05 |
| Morgan Stanley | Maintain | Equal Weight | 2025-12-05 |
| BMO Capital | Maintain | Outperform | 2025-11-20 |
| Wells Fargo | Maintain | Overweight | 2025-09-19 |
| Stifel | Maintain | Buy | 2025-09-19 |
| Piper Sandler | Maintain | Overweight | 2025-09-19 |
| Canaccord Genuity | Maintain | Buy | 2025-09-19 |
| Citigroup | Maintain | Neutral | 2025-09-09 |
ServiceTitan’s grades predominantly indicate a positive outlook with many “Buy”, “Outperform”, and “Overweight” ratings, while a minority maintain a neutral or equal weight stance.
Match Group, Inc. Grades
The table below lists recent grades and recommendations for Match Group, Inc. from recognized grading companies.
| Grading Company | Action | New Grade | Date |
|---|---|---|---|
| Morgan Stanley | Maintain | Equal Weight | 2026-01-13 |
| Truist Securities | Maintain | Hold | 2025-11-05 |
| Evercore ISI Group | Maintain | In Line | 2025-11-05 |
| Wells Fargo | Maintain | Equal Weight | 2025-11-05 |
| Morgan Stanley | Maintain | Equal Weight | 2025-10-20 |
| Susquehanna | Maintain | Positive | 2025-08-07 |
| Evercore ISI Group | Maintain | In Line | 2025-08-06 |
| JP Morgan | Maintain | Neutral | 2025-08-06 |
| UBS | Maintain | Neutral | 2025-07-23 |
| Wells Fargo | Maintain | Equal Weight | 2025-06-27 |
Match Group’s ratings cluster around “Equal Weight”, “Hold”, and “Neutral” with some “Positive” and “In Line” assessments, indicating a more cautious consensus.
Which company has the best grades?
ServiceTitan, Inc. has received generally more favorable grades, with multiple “Buy”, “Outperform”, and “Overweight” ratings compared to Match Group’s mostly neutral or hold-oriented grades. This suggests investors might perceive ServiceTitan as having stronger growth potential or more attractive fundamentals relative to Match Group.
Strengths and Weaknesses
Below is a comparative overview of key strengths and weaknesses for ServiceTitan, Inc. (TTAN) and Match Group, Inc. (MTCH) based on the most recent financial and operational data.
| Criterion | ServiceTitan, Inc. (TTAN) | Match Group, Inc. (MTCH) |
|---|---|---|
| Diversification | Primarily focused on platform and subscription revenues; moderate product mix | Diverse revenue streams including dating, service, and other products; broader market segments |
| Profitability | Negative net margin (-30.98%), negative ROIC (-14.11%), value destroying | Positive net margin (15.84%), positive ROIC (16.38%), value creating but declining profitability |
| Innovation | Moderate asset turnover with strong fixed asset utilization; stable ROIC trend | High fixed asset turnover and asset efficiency; innovation reflected in diverse offerings |
| Global presence | Primarily US-focused with growth potential; limited international footprint | Strong global presence with diverse markets and service lines |
| Market Share | Growing platform adoption but facing profitability challenges | Established market leader with significant share in online dating and social platforms |
In summary, ServiceTitan shows promising growth in platform revenue but struggles with profitability and value creation, indicating higher risk. Match Group maintains strong profitability and diversified revenue but faces a declining ROIC trend, calling for caution on long-term sustainability. Investors should weigh these factors carefully in portfolio decisions.
Risk Analysis
Below is a comparative table of key risks for ServiceTitan, Inc. (TTAN) and Match Group, Inc. (MTCH) based on the most recent data available from 2025 and 2024 respectively:
| Metric | ServiceTitan, Inc. (TTAN) | Match Group, Inc. (MTCH) |
|---|---|---|
| Market Risk | Beta: -0.85 (low market correlation) | Beta: 1.33 (higher volatility) |
| Debt level | Debt-to-Equity: 0.11 (low) | Debt-to-Equity: -62.09 (unusual, high leverage) |
| Regulatory Risk | Moderate (technology sector, US) | Moderate to High (global dating platforms) |
| Operational Risk | Negative net margin (-30.98%), negative ROE | Positive net margin (15.84%) but negative ROE (-865.98%) |
| Environmental Risk | Low (software industry) | Low (software industry) |
| Geopolitical Risk | Low (US-based, domestic focus) | Moderate (global user base exposure) |
Synthesis: ServiceTitan exhibits moderate operational risks due to sustained losses and unfavorable returns on equity, but benefits from low debt and market risk. Match Group faces significant financial leverage concerns and geopolitical exposure due to its international footprint, despite showing profitability. The most impactful risks are Match Group’s high debt levels and geopolitical exposure, and ServiceTitan’s ongoing negative profitability which may affect long-term viability.
Which Stock to Choose?
ServiceTitan, Inc. (TTAN) shows favorable revenue growth of 25.6% in 2025, with a gross margin near 65%, but suffers from negative profitability ratios including a -30.98% net margin and -16.44% ROE. Its debt levels are low and the overall rating is very favorable, yet financial ratios are slightly unfavorable and the company is losing value with a negative ROIC compared to WACC.
Match Group, Inc. (MTCH) presents stable income growth with a 3.4% revenue increase in 2024 and strong profitability, including a 15.84% net margin and 16.38% ROIC exceeding its WACC, indicating value creation. Despite high debt-to-assets ratio and a mixed rating profile, it maintains a favorable global ratios opinion and a slightly favorable moat status, although its Altman Z-Score signals financial distress risk.
Investors seeking growth might find ServiceTitan’s strong revenue expansion appealing despite its value erosion and weaker profitability. Conversely, those prioritizing value creation and income stability could lean toward Match Group, which demonstrates consistent profitability and value creation but carries higher financial risk and a declining ROIC trend.
Disclaimer: Investment carries a risk of loss of initial capital. The past performance is not a reliable indicator of future results. Be sure to understand risks before making an investment decision.
Go Further
I encourage you to read the complete analyses of ServiceTitan, Inc. and Match Group, Inc. to enhance your investment decisions: