Home > Comparison > Technology > NOW vs MTCH
The strategic rivalry between ServiceNow, Inc. and Match Group, Inc. defines the current trajectory of the technology sector’s software application industry. ServiceNow operates a capital-intensive enterprise cloud platform focused on workflow automation across industries. Match Group, by contrast, is a leaner, high-margin provider specializing in consumer-facing dating services. This analysis pits enterprise-scale innovation against niche market leadership to identify which offers superior risk-adjusted returns for a diversified portfolio.
Table of contents
Companies Overview
ServiceNow and Match Group shape distinct segments of the evolving software application market.
ServiceNow, Inc.: Enterprise Workflow Automation Leader
ServiceNow dominates the enterprise cloud computing space, generating revenue through its Now platform. This platform automates workflows with AI, machine learning, and robotic process automation. In 2026, the company strategically partners with Celonis to prioritize automation opportunities, reinforcing its focus on enhancing operational efficiency for large organizations worldwide.
Match Group, Inc.: Global Dating Platform Powerhouse
Match Group commands the online dating sector with a diverse portfolio including Tinder, Match, and Hinge. Its core revenue derives from subscription and advertising services across these brands. In 2026, Match Group prioritizes expanding user engagement and monetization strategies, focusing on broadening its footprint in competitive digital dating markets.
Strategic Collision: Similarities & Divergences
Both companies excel in software applications but target vastly different user bases and business models. ServiceNow emphasizes a B2B closed ecosystem centered on workflow automation, while Match Group operates an open consumer platform driven by network effects. Their primary battleground lies in digital engagement—enterprise clients versus individual consumers. This divergence translates into distinct risk profiles and growth trajectories for investors to consider.
Income Statement Comparison
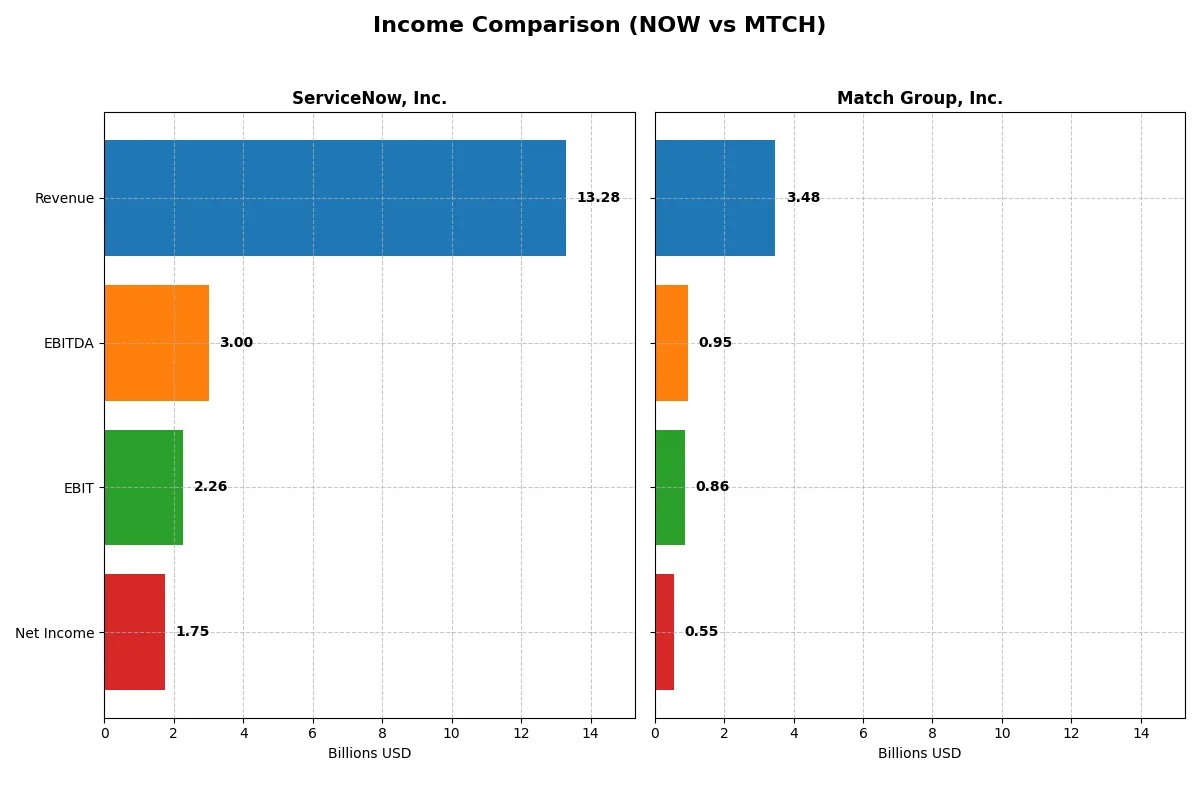
This data dissects the core profitability and scalability of both corporate engines to reveal who dominates the bottom line:
| Metric | ServiceNow, Inc. (NOW) | Match Group, Inc. (MTCH) |
|---|---|---|
| Revenue | 13.3B | 3.5B |
| Cost of Revenue | 3.0B | 991M |
| Operating Expenses | 8.5B | 1.7B |
| Gross Profit | 10.3B | 2.5B |
| EBITDA | 3.0B | 952M |
| EBIT | 2.3B | 864M |
| Interest Expense | 0 | 160M |
| Net Income | 1.7B | 551M |
| EPS | 1.69 | 2.12 |
| Fiscal Year | 2025 | 2024 |
Income Statement Analysis: The Bottom-Line Duel
This income statement comparison reveals which company drives superior efficiency and profit generation in their respective markets.
ServiceNow, Inc. Analysis
ServiceNow’s revenue surged from 5.9B in 2021 to 13.3B in 2025, with net income growing sharply from 230M to 1.75B. Its gross margin remains robust near 77.5%, and net margin holds favorable at 13.2%. The 2025 year shows strong momentum with 21% revenue growth and a 28% rise in EBIT, signaling efficient scale expansion.
Match Group, Inc. Analysis
Match Group grew revenue from 2.4B in 2020 to 3.5B in 2024, with net income rising from 168M to 563M. Gross margin stands solid at 71.5%, while net margin measures a healthy 15.8%. However, recent growth slowed to 3.4% revenue increase and net margin declined 18%, reflecting margin pressures despite overall profitability.
Margin Power vs. Revenue Scale
ServiceNow dominates with explosive revenue and net income growth, underpinned by strong margin expansion and operational leverage. Match Group holds higher net margin but faces recent profit contraction and slower top-line growth. Investors seeking rapid growth and improving profitability find ServiceNow’s profile more compelling, while Match’s steadier margin base suits more conservative appetites.
Financial Ratios Comparison
These vital ratios act as a diagnostic tool to expose the underlying fiscal health, valuation premiums, and capital efficiency of the companies compared below:
| Ratios | ServiceNow, Inc. (NOW) | Match Group, Inc. (MTCH) |
|---|---|---|
| ROE | 13.5% | -8.7% |
| ROIC | 9.0% | 16.4% |
| P/E | 90.9 | 15.4 |
| P/B | 12.3 | -133.7 |
| Current Ratio | 0.95 | 2.54 |
| Quick Ratio | 0.95 | 2.54 |
| D/E | 0.25 | -62.1 |
| Debt-to-Assets | 12.3% | 88.5% |
| Interest Coverage | 0 | 5.1 |
| Asset Turnover | 0.51 | 0.78 |
| Fixed Asset Turnover | 4.29 | 22.0 |
| Payout ratio | 0 | 0 |
| Dividend yield | 0 | 0 |
| Fiscal Year | 2025 | 2024 |
Efficiency & Valuation Duel: The Vital Signs
Financial ratios act as the company’s DNA, revealing hidden risks and operational strengths that numbers alone cannot capture.
ServiceNow, Inc.
ServiceNow posts a solid 13.5% ROE and a favorable 13.2% net margin, reflecting reliable profitability. However, its valuation appears stretched, with a P/E near 91 and P/B above 12, signaling expensive stock pricing. The company offers no dividends, focusing instead on heavy reinvestment in R&D, which supports long-term growth but limits immediate shareholder returns.
Match Group, Inc.
Match Group delivers a strong 15.8% net margin and an impressive 16.4% ROIC, indicating operational efficiency. Its valuation stands at a reasonable P/E of 15.4 and a favorable P/B despite a negative ratio figure, suggesting market confidence. Like ServiceNow, it pays no dividend, choosing to reinvest cash flow to sustain growth and innovation in a competitive sector.
Premium Valuation vs. Operational Efficiency
ServiceNow’s high valuation contrasts with Match Group’s more reasonable multiples and superior capital returns. Match offers a better balance of risk and reward through efficient asset use and moderate valuation. Investors prioritizing growth at a premium may prefer ServiceNow, while those favoring operational strength and value may lean toward Match.
Which one offers the Superior Shareholder Reward?
ServiceNow (NOW) and Match Group (MTCH) both eschew dividends, prioritizing reinvestment and buybacks. NOW sustains zero dividend yield and payout but boasts consistent free cash flow (4.4/share in 2025) fueling moderate buybacks. MTCH also pays no dividends but outpaces NOW with aggressive buybacks supported by robust free cash flow (3.4/share in 2024) and a lower price-to-free-cash-flow ratio (~9.7 vs. NOW’s 34.7). However, MTCH’s heavy leverage and negative equity pose risks to buyback sustainability. I see NOW’s conservative capital structure and consistent cash flow as a more durable model for long-term total returns in 2026. Thus, I favor ServiceNow for superior shareholder reward given its balanced reinvestment and prudent buybacks amid market cycles.
Comparative Score Analysis: The Strategic Profile
The radar chart reveals the fundamental DNA and trade-offs of ServiceNow, Inc. and Match Group, Inc., highlighting their financial strengths and vulnerabilities:
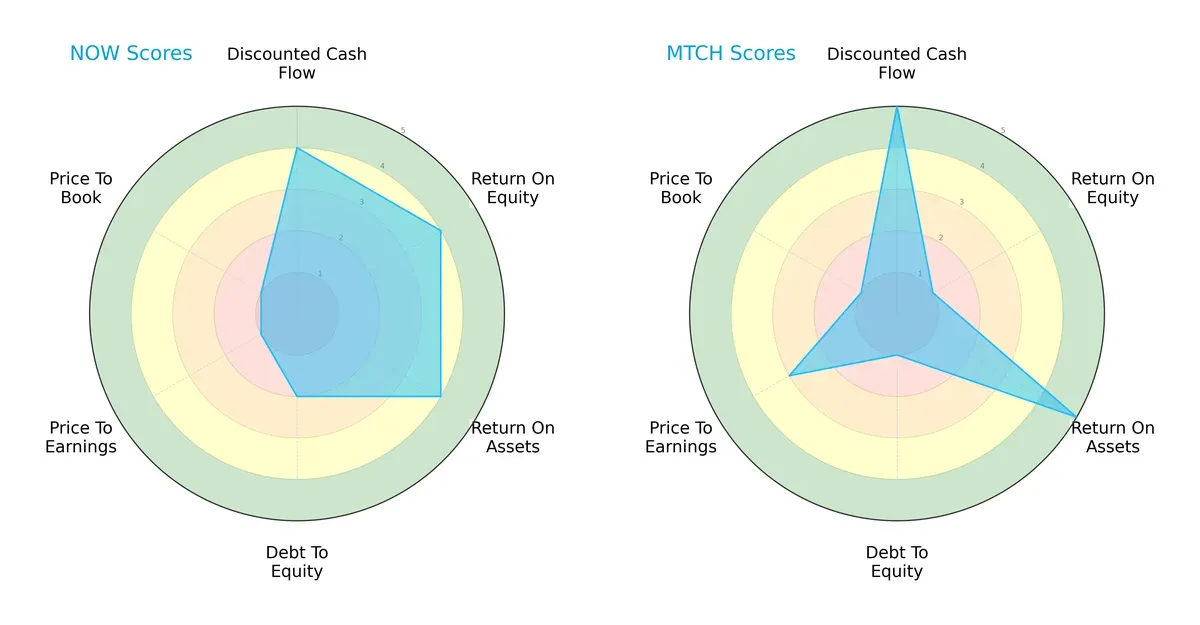
ServiceNow shows balanced strengths in DCF, ROE, and ROA with moderate debt management but suffers from unfavorable valuation scores. Match Group excels in DCF and ROA but struggles with high debt and weak ROE, reflecting a reliance on asset efficiency over equity returns. ServiceNow’s profile is steadier, while Match Group depends on select operational advantages.
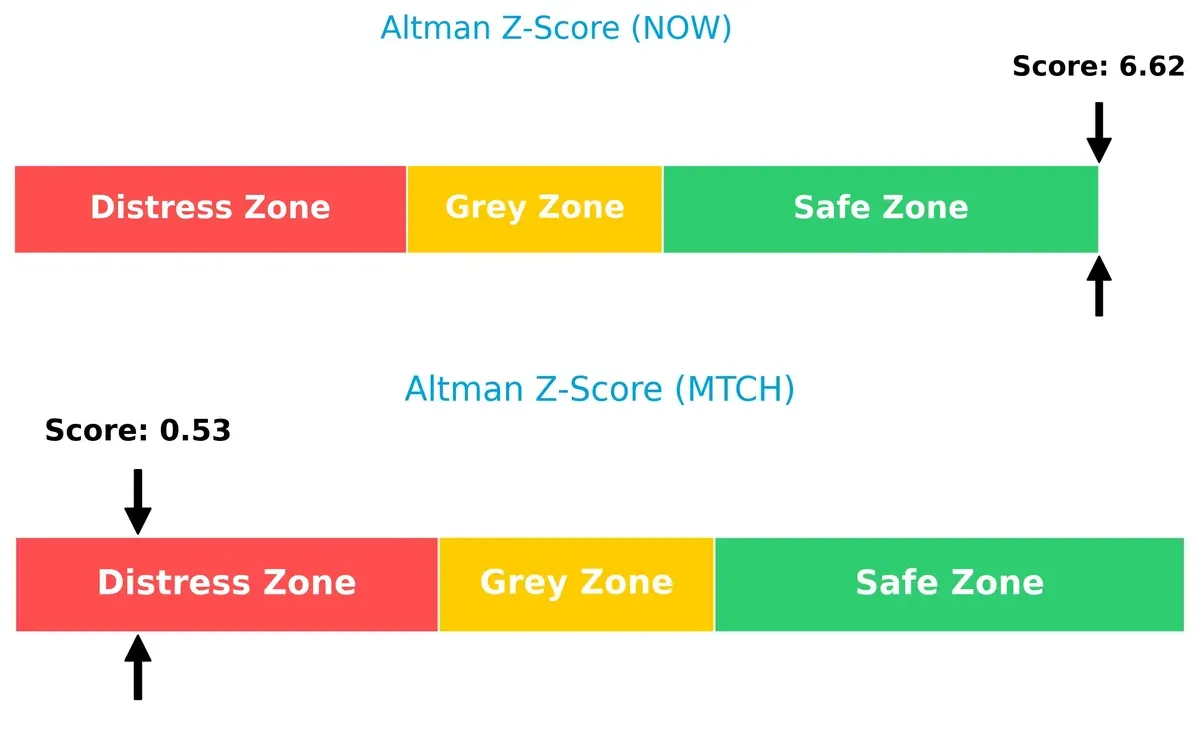
Bankruptcy Risk: Solvency Showdown
ServiceNow’s Altman Z-Score of 6.6 places it comfortably in the safe zone, indicating low bankruptcy risk. Match Group’s 0.5 signals distress, raising red flags about its long-term survival in this cycle:
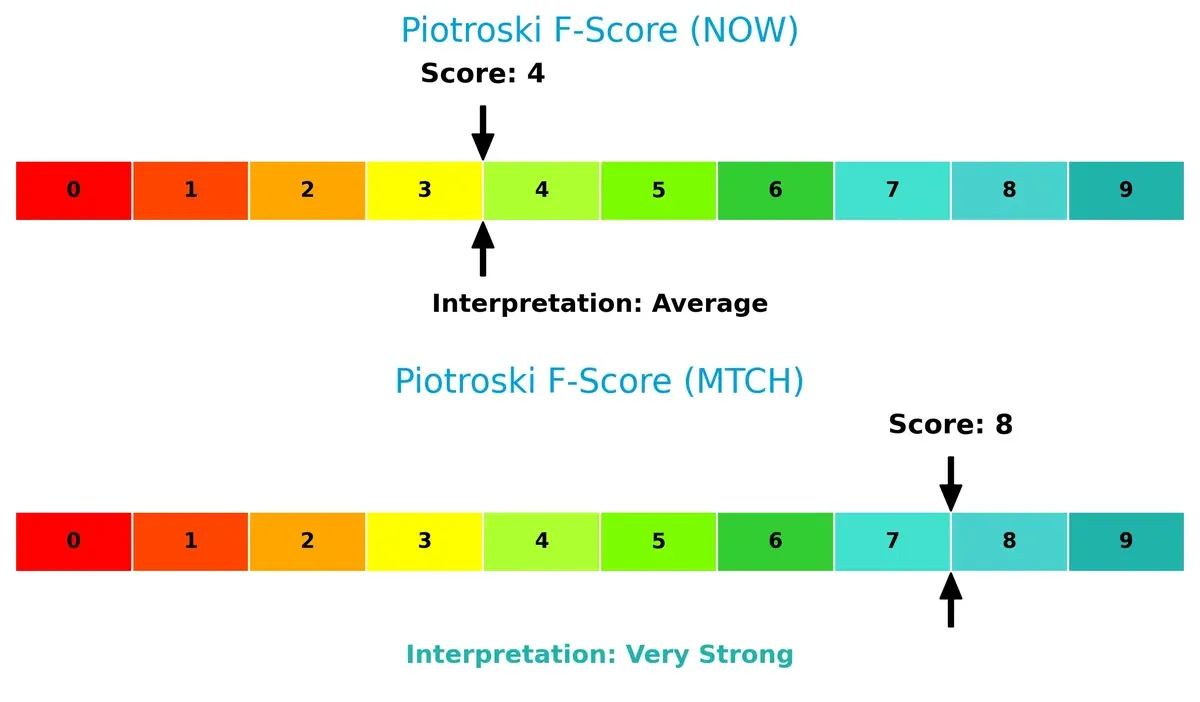
Financial Health: Quality of Operations
Match Group’s Piotroski score of 8 reflects very strong financial health, showing robust internal operations. ServiceNow’s 4 is average, suggesting some red flags in operational efficiency and financial quality:
How are the two companies positioned?
This section dissects the operational DNA of ServiceNow and Match Group by comparing their revenue distribution and internal dynamics. The final objective confronts their economic moats to identify which business model offers the most resilient and sustainable competitive advantage today.
Revenue Segmentation: The Strategic Mix
The following visual comparison dissects how both firms diversify their income streams and where their primary sector bets lie:
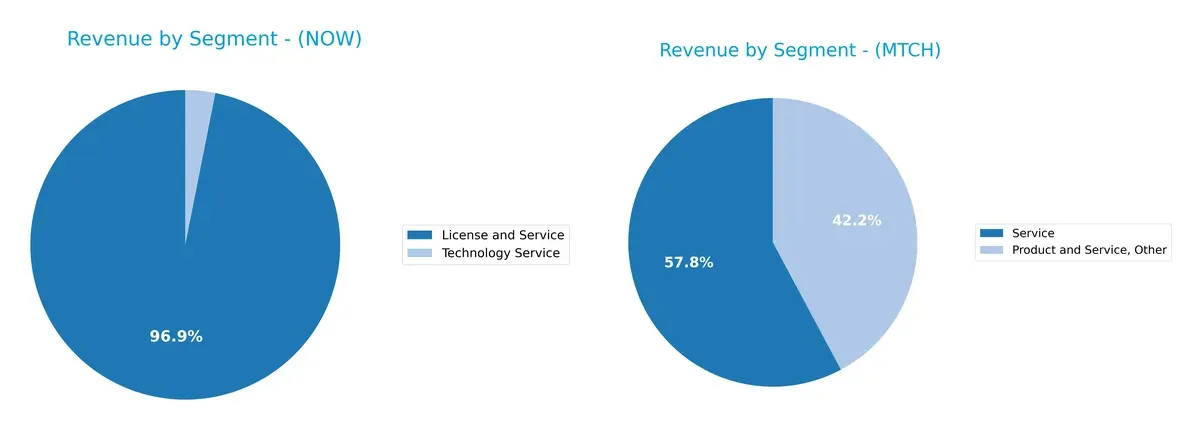
ServiceNow, Inc. anchors its revenue heavily in License and Service, totaling $12.9B in 2025, with a smaller $414M from Technology Service. This concentration signals strong ecosystem lock-in in enterprise software. Match Group, Inc. shows a more fragmented mix across Product and Service ($989M) and Service ($1.36B) in 2020, reflecting diversified digital dating and social platforms. Match carries less concentration risk but also less infrastructure dominance compared to ServiceNow.
Strengths and Weaknesses Comparison
This table compares the Strengths and Weaknesses of ServiceNow, Inc. (NOW) and Match Group, Inc. (MTCH):
NOW Strengths
- Strong diversification with License and Service and Technology Service segments
- Balanced global revenue from North America, EMEA, and Asia Pacific
- Favorable debt-to-equity and interest coverage ratios
- Neutral profitability metrics show stable returns
MTCH Strengths
- Favorable net margin and ROIC indicate efficient capital use
- Strong current and quick ratios suggest solid liquidity
- Favorable fixed asset turnover reflects operational efficiency
- Balanced US and Non-US revenue streams
NOW Weaknesses
- Unfavorable high PE and PB ratios may indicate overvaluation
- Current ratio below 1 signals potential liquidity risks
- Zero dividend yield limits income for investors
- Neutral ROE and WACC imply moderate capital efficiency
MTCH Weaknesses
- Extremely negative ROE signals poor shareholder returns
- High debt-to-assets ratio raises financial risk concerns
- Zero dividend yield restricts income generation
- Neutral PE may reflect market uncertainty
Both companies display clear strengths in operational efficiency and geographic reach. However, NOW faces valuation and liquidity challenges, while MTCH must address significant profitability and leverage issues to stabilize its financial profile.
The Moat Duel: Analyzing Competitive Defensibility
A structural moat is the only true shield protecting long-term profits from relentless competitive erosion. Let’s examine two tech leaders’ moats:
ServiceNow, Inc.: Workflow Automation with Expanding Intangible Assets
ServiceNow leverages intangible assets like its Now Platform and AI integrations, driving stable margins and 13% net profit. Its growing ROIC signals improving profitability. Expansion into new enterprise segments could deepen its moat in 2026.
Match Group, Inc.: Network Effects in Social Dating Ecosystems
Match Group’s moat stems from strong network effects across multiple dating brands, yielding a 16% net margin and solid value creation. However, its declining ROIC trend warns of margin pressure. New product launches may offset this in 2026.
Intangible Assets vs. Network Effects: Which Moat Holds Stronger?
ServiceNow’s growing ROIC hints at a widening moat, while Match Group’s higher ROIC but shrinking trend signals vulnerability. I see ServiceNow better positioned to defend and expand its market share long term.
Which stock offers better returns?
ServiceNow, Inc. and Match Group, Inc. have both experienced declining stock prices over the past year, with notable lows and decelerating bearish trends shaping their trading dynamics.
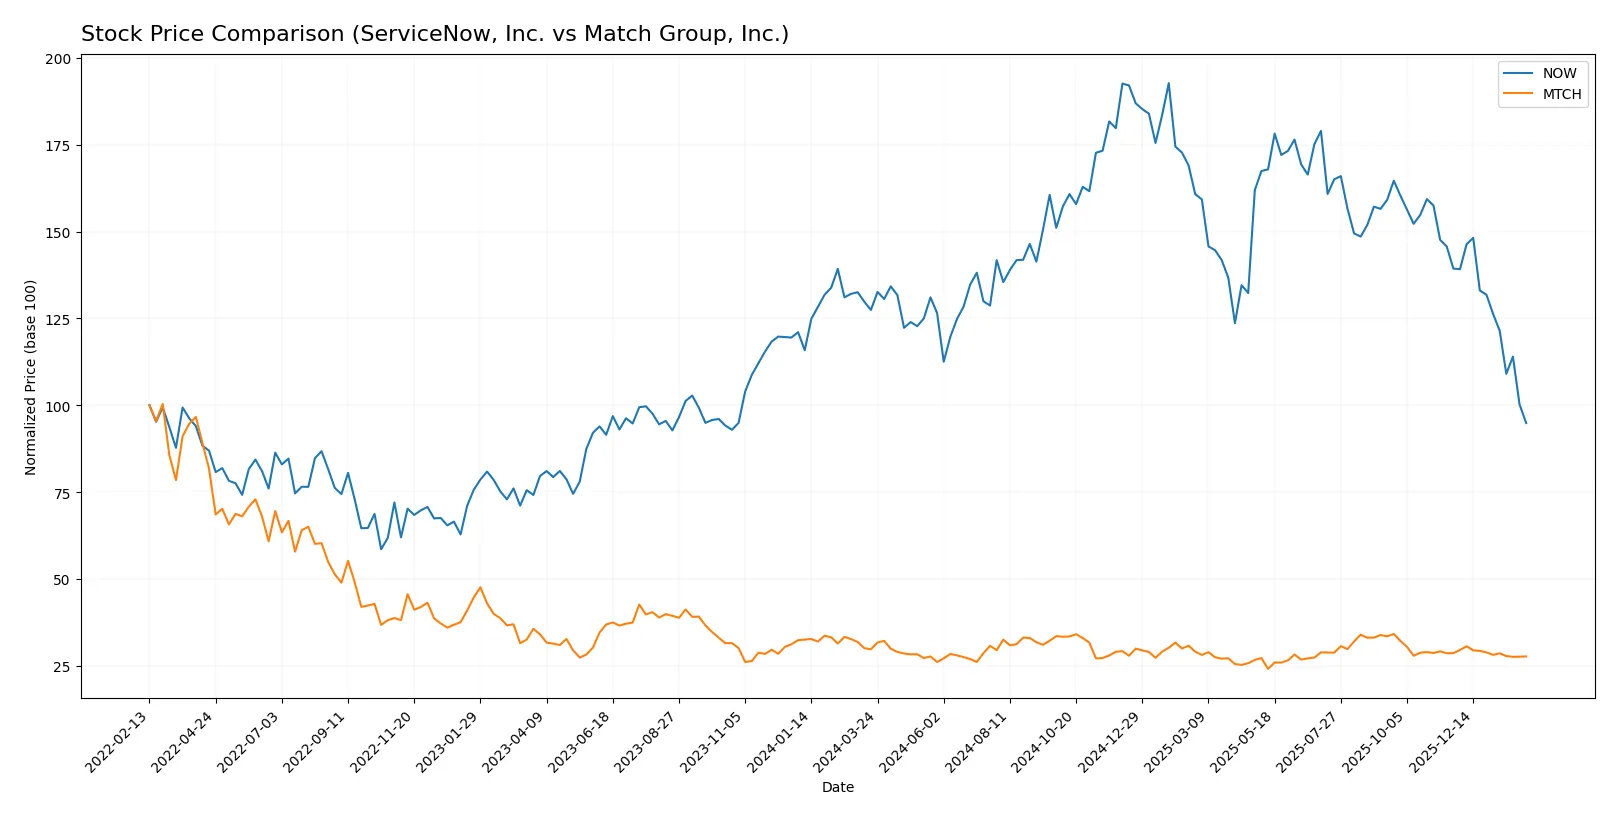
Trend Comparison
ServiceNow’s stock fell 25.54% over the past 12 months, marking a bearish trend with decelerating decline and high volatility. The price swung between 225.0 and 110.78.
Match Group’s stock declined 6.92% over the same period, also bearish with deceleration but far lower volatility. Prices ranged from 38.51 to 27.18.
Comparing trends, ServiceNow’s performance lagged significantly behind Match Group’s, delivering the weaker market return over the past year.
Target Prices
Analysts present a wide target price range for ServiceNow, Inc. and a more conservative outlook for Match Group, Inc.
| Company | Target Low | Target High | Consensus |
|---|---|---|---|
| ServiceNow, Inc. | 115 | 1315 | 440.64 |
| Match Group, Inc. | 33 | 43 | 36.29 |
ServiceNow’s target consensus at $440 far exceeds its current $111 price, signaling strong bullish sentiment despite wide uncertainty. Match Group’s consensus of $36 moderately surpasses its $31 price, indicating modest upside expectations.

Don’t Let Luck Decide Your Entry Point
Optimize your entry points with our advanced ProRealTime indicators. You’ll get efficient buy signals with precise price targets for maximum performance. Start outperforming now!
How do institutions grade them?
ServiceNow, Inc. Grades
The following table summarizes recent institutional grades for ServiceNow, Inc.:
| Grading Company | Action | New Grade | Date |
|---|---|---|---|
| Citigroup | Maintain | Buy | 2026-01-30 |
| Macquarie | Maintain | Neutral | 2026-01-29 |
| Evercore ISI Group | Maintain | Outperform | 2026-01-29 |
| RBC Capital | Maintain | Outperform | 2026-01-29 |
| Keybanc | Maintain | Underweight | 2026-01-29 |
| Needham | Maintain | Buy | 2026-01-29 |
| Stifel | Maintain | Buy | 2026-01-29 |
| BTIG | Maintain | Buy | 2026-01-29 |
| Cantor Fitzgerald | Maintain | Overweight | 2026-01-29 |
| DA Davidson | Maintain | Buy | 2026-01-29 |
Match Group, Inc. Grades
Below is a summary of recent institutional grades for Match Group, Inc.:
| Grading Company | Action | New Grade | Date |
|---|---|---|---|
| Morgan Stanley | Maintain | Equal Weight | 2026-01-13 |
| Evercore ISI Group | Maintain | In Line | 2025-11-05 |
| Truist Securities | Maintain | Hold | 2025-11-05 |
| Wells Fargo | Maintain | Equal Weight | 2025-11-05 |
| Morgan Stanley | Maintain | Equal Weight | 2025-10-20 |
| Susquehanna | Maintain | Positive | 2025-08-07 |
| Evercore ISI Group | Maintain | In Line | 2025-08-06 |
| JP Morgan | Maintain | Neutral | 2025-08-06 |
| UBS | Maintain | Neutral | 2025-07-23 |
| Wells Fargo | Maintain | Equal Weight | 2025-06-27 |
Which company has the best grades?
ServiceNow, Inc. holds stronger grades overall, with multiple “Buy” and “Outperform” ratings. Match Group, Inc. mostly receives “Equal Weight” and “Hold” grades. This suggests investors may view ServiceNow as having more upside potential.
Risks specific to each company
The following categories identify critical pressure points and systemic threats facing ServiceNow, Inc. and Match Group, Inc. in the 2026 market environment:
1. Market & Competition
ServiceNow, Inc.
- Faces intense competition in enterprise cloud software; high P/E reflects growth premium and market pressure.
Match Group, Inc.
- Operates in a saturated dating app market; diversified brand portfolio offsets competitive risks.
2. Capital Structure & Debt
ServiceNow, Inc.
- Low debt-to-equity (0.25) and strong interest coverage suggest prudent leverage management.
Match Group, Inc.
- Extremely high debt-to-assets (88.5%) signals elevated financial risk despite favorable interest coverage.
3. Stock Volatility
ServiceNow, Inc.
- Beta near 1 (0.978) indicates stock volatility close to the broader market.
Match Group, Inc.
- Higher beta (1.315) reveals greater price sensitivity and market risk.
4. Regulatory & Legal
ServiceNow, Inc.
- Operates globally with exposure to data privacy and compliance regulations across sectors.
Match Group, Inc.
- Faces stringent regulations on user data and content moderation, increasing legal risks.
5. Supply Chain & Operations
ServiceNow, Inc.
- Relies on cloud infrastructure partnerships; operational scale (26K employees) supports resilience.
Match Group, Inc.
- Smaller workforce (2.5K) and dependence on platform stability could limit operational flexibility.
6. ESG & Climate Transition
ServiceNow, Inc.
- Increasing focus on sustainable IT solutions but ESG metrics not detailed, a potential blind spot.
Match Group, Inc.
- Limited public ESG initiatives; social governance critical due to user data sensitivity.
7. Geopolitical Exposure
ServiceNow, Inc.
- US-based with global customers; geopolitical tensions could impact international contracts.
Match Group, Inc.
- US-centric but global user base exposes it to cross-border regulatory and geopolitical risks.
Which company shows a better risk-adjusted profile?
ServiceNow’s controlled leverage and safe Altman Z-Score (6.6) underpin a stronger risk-adjusted profile. Match Group’s distressed Altman Z-Score (0.5) and high debt-to-assets raise red flags despite robust Piotroski Score. The most impactful risk for ServiceNow is its stretched valuation, while Match Group’s excessive leverage threatens solvency. ServiceNow’s stable capital structure and lower volatility justify my preference amid 2026 uncertainties.
Final Verdict: Which stock to choose?
ServiceNow’s superpower lies in its relentless revenue and earnings growth, driven by strong operating efficiency and expanding market relevance. Its main point of vigilance is a stretched current ratio below 1, signaling liquidity risks. It suits investors targeting aggressive growth with a tolerance for short-term balance sheet pressures.
Match Group boasts a strategic moat rooted in its dominant position in digital dating platforms and robust free cash flow generation. It offers a safer financial profile with a solid current ratio and favorable capital efficiency, appealing more to those seeking growth at a reasonable price with moderate risk.
If you prioritize high-growth potential and are comfortable with liquidity constraints, ServiceNow outshines due to its accelerating profitability and market momentum. However, if you seek better financial stability combined with a durable competitive moat in a niche market, Match Group offers a more balanced risk-reward scenario. Both present compelling but distinct analytical scenarios depending on your portfolio strategy.
Disclaimer: Investment carries a risk of loss of initial capital. The past performance is not a reliable indicator of future results. Be sure to understand risks before making an investment decision.
Go Further
I encourage you to read the complete analyses of ServiceNow, Inc. and Match Group, Inc. to enhance your investment decisions: