In the fast-evolving semiconductor industry, QUALCOMM Incorporated and Marvell Technology, Inc. stand out as key innovators driving wireless and data communication advancements. Both companies compete in overlapping markets, focusing on cutting-edge integrated circuits and connectivity solutions. Their distinct innovation strategies and market footprints make them compelling choices for investors seeking growth in technology. This article will help you decide which company aligns best with your investment goals.
Table of contents
Companies Overview
I will begin the comparison between QUALCOMM and Marvell Technology by providing an overview of these two companies and their main differences.
QUALCOMM Overview
QUALCOMM Incorporated focuses on developing and commercializing foundational wireless technologies globally. It operates through three segments: Qualcomm CDMA Technologies (QCT), Qualcomm Technology Licensing (QTL), and Qualcomm Strategic Initiatives (QSI), covering integrated circuits, software, licensing, and strategic investments in 5G and AI. Founded in 1985 and headquartered in San Diego, it holds a strong position in the semiconductor industry with a market cap of $175B.
Marvell Technology Overview
Marvell Technology, Inc. designs, develops, and sells analog, mixed-signal, and digital integrated circuits, including Ethernet solutions and storage controllers for HDDs and SSDs. It operates globally with facilities in multiple countries and was incorporated in 1995, headquartered in Wilmington, Delaware. Marvell’s market cap stands at $71B, positioning it as a significant player in semiconductor components and networking technologies.
Key similarities and differences
Both companies operate in the semiconductor industry and serve technology markets with integrated circuits and related products. QUALCOMM emphasizes wireless technologies and licensing, with diversified segments including strategic investments, whereas Marvell focuses more on Ethernet, storage solutions, and networking hardware. QUALCOMM is larger in market cap and employee count, reflecting a broader portfolio and global influence compared to Marvell’s more specialized product offerings.
Income Statement Comparison
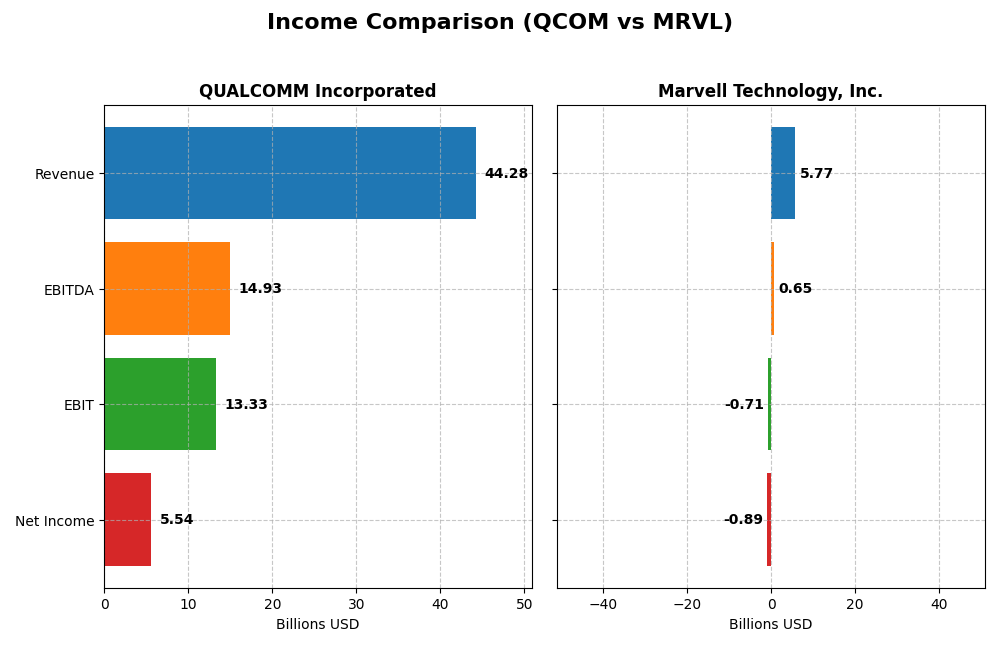
The table below presents the most recent fiscal year income statement figures for QUALCOMM Incorporated and Marvell Technology, Inc., facilitating a direct financial comparison of key metrics.
| Metric | QUALCOMM Incorporated | Marvell Technology, Inc. |
|---|---|---|
| Market Cap | 175B | 71B |
| Revenue | 44.3B | 5.77B |
| EBITDA | 14.9B | 652M |
| EBIT | 13.3B | -705M |
| Net Income | 5.54B | -885M |
| EPS | 5.06 | -1.02 |
| Fiscal Year | 2025 | 2025 |
Income Statement Interpretations
QUALCOMM Incorporated
QUALCOMM’s revenue grew steadily from $33.6B in 2021 to $44.3B in 2025, reflecting a 31.9% overall increase. Net income showed volatility, peaking at $12.9B in 2022 before declining to $5.5B in 2025, with net margin contracting to 12.5%. The latest year recorded favorable revenue and EBIT growth but experienced a significant net margin and EPS decline, signaling margin pressure despite strong top-line gains.
Marvell Technology, Inc.
Marvell’s revenue almost doubled from $3B in 2021 to $5.8B in 2025, showing impressive top-line growth of 94.3%. However, net income remained negative throughout, worsening to a -$885M loss in 2025, alongside a negative net margin of -15.4%. Although gross margins remained stable and revenue growth was neutral last year, EBIT and overall net income trends indicate ongoing profitability challenges.
Which one has the stronger fundamentals?
QUALCOMM exhibits stronger fundamentals with consistent revenue growth, favorable gross and EBIT margins above 30%, and positive net income despite recent margin compression. Marvell, while demonstrating robust revenue expansion, faces persistent losses, negative EBIT margins, and weaker profitability metrics. The balance of favorable to unfavorable income statement indicators favors QUALCOMM in terms of financial stability and operational efficiency.
Financial Ratios Comparison
The table below provides a side-by-side comparison of key financial ratios for QUALCOMM Incorporated and Marvell Technology, Inc. based on their most recent fiscal year data.
| Ratios | QUALCOMM Incorporated (2025) | Marvell Technology, Inc. (2025) |
|---|---|---|
| ROE | 26.1% | -6.6% |
| ROIC | 13.2% | -3.9% |
| P/E | 32.7 | -110.4 |
| P/B | 8.54 | 7.27 |
| Current Ratio | 2.82 | 1.54 |
| Quick Ratio | 2.10 | 1.03 |
| D/E (Debt to Equity) | 0.70 | 0.32 |
| Debt-to-Assets | 29.5% | 21.5% |
| Interest Coverage | 18.6 | -3.8 |
| Asset Turnover | 0.88 | 0.29 |
| Fixed Asset Turnover | 9.44 | 5.56 |
| Payout ratio | 68.7% | -23.4% |
| Dividend yield | 2.10% | 0.21% |
Interpretation of the Ratios
QUALCOMM Incorporated
QUALCOMM’s financial ratios mostly reflect strength, with favorable net margin (12.51%), ROE (26.13%), and ROIC (13.19%), alongside strong liquidity shown by a current ratio of 2.82. Concerns include relatively high P/E (32.7) and P/B (8.54) ratios. The company pays dividends with a solid 2.1% yield, supported by consistent free cash flow coverage, indicating sustainable shareholder returns.
Marvell Technology, Inc.
Marvell’s ratios reveal weaknesses, marked by negative net margin (-15.35%), ROE (-6.59%), and ROIC (-3.88%), with unfavorable interest coverage (-3.72). Liquidity is adequate but less robust than QUALCOMM, with a current ratio of 1.54. Marvell pays a low dividend yield of 0.21%, reflecting limited shareholder returns likely constrained by ongoing losses and reinvestment needs.
Which one has the best ratios?
QUALCOMM demonstrates a favorable overall ratio profile with strong profitability, liquidity, and dividend metrics, while Marvell shows multiple unfavorable profitability and coverage ratios. Given the higher proportion of favorable indicators and sustainable shareholder returns, QUALCOMM presents a stronger financial ratio picture compared to Marvell.
Strategic Positioning
This section compares the strategic positioning of QUALCOMM and Marvell Technology, focusing on market position, key segments, and exposure to technological disruption:
QUALCOMM
- Leading semiconductor player with significant market cap and strong industry presence.
- Diversified segments: QCT (integrated circuits, 3G-5G tech), QTL (technology licensing), QSI (investments in 5G, AI, automotive).
- Invests in emerging technologies like 5G, AI, automotive, IoT; IP licensing supports industry standards.
Marvell Technology
- Mid-sized semiconductor company with notable market volatility and competition.
- Concentrated on Ethernet solutions, storage controllers, processors, and networking for data centers and enterprise.
- Focused on analog, mixed-signal ICs, networking, storage, with exposure to evolving data center and enterprise needs.
QUALCOMM vs Marvell Technology Positioning
QUALCOMM pursues a diversified approach across integrated circuits, licensing, and strategic investments, offering broader exposure and multiple revenue streams. Marvell concentrates on specialized networking and storage solutions, which may limit exposure but focus on specific growth drivers.
Which has the best competitive advantage?
QUALCOMM shows a slightly favorable economic moat with positive value creation despite declining profitability, while Marvell demonstrates a very unfavorable moat, shedding value with decreasing returns on invested capital.
Stock Comparison
The past year reveals distinct price dynamics for QUALCOMM Incorporated and Marvell Technology, Inc., with both stocks showing overall bullish trends but recent declines indicating short-term bearish shifts.

Trend Analysis
QUALCOMM Incorporated’s stock rose 5.43% over the last 12 months, reflecting a bullish trend with acceleration. The price ranged between 127.46 and 215.33, showing moderate volatility (std dev 16.08).
Marvell Technology, Inc. experienced a stronger bullish trend with a 21.47% gain over the same period, although its upward momentum decelerated. The price fluctuated from 49.43 to 124.76, with similar volatility (std dev 16.46).
Comparing both, Marvell Technology, Inc. delivered the highest market performance over the past year, gaining significantly more than QUALCOMM, despite both showing recent price declines.
Target Prices
The consensus target prices for QUALCOMM Incorporated and Marvell Technology, Inc. reflect optimistic analyst expectations.
| Company | Target High | Target Low | Consensus |
|---|---|---|---|
| QUALCOMM Incorporated | 210 | 165 | 185.71 |
| Marvell Technology, Inc. | 156 | 80 | 117 |
Analysts expect QUALCOMM’s price to rise moderately above its current 163.03 USD, while Marvell’s consensus target of 117 USD suggests significant upside from the current 82.17 USD.
Analyst Opinions Comparison
This section compares analysts’ ratings and grades for QUALCOMM and Marvell Technology:
Rating Comparison
QUALCOMM Rating
- Rating: B+, status Very Favorable
- Discounted Cash Flow Score: 4, Favorable
- ROE Score: 5, Very Favorable
- ROA Score: 5, Very Favorable
- Debt To Equity Score: 1, Very Unfavorable
- Overall Score: 3, Moderate
Marvell Technology Rating
- Rating: B+, status Very Favorable
- Discounted Cash Flow Score: 3, Moderate
- ROE Score: 4, Favorable
- ROA Score: 5, Very Favorable
- Debt To Equity Score: 2, Moderate
- Overall Score: 3, Moderate
Which one is the best rated?
Both QUALCOMM and Marvell Technology share the same overall rating of B+ and a moderate overall score of 3. QUALCOMM scores higher in discounted cash flow and ROE, while Marvell has a better debt-to-equity score, indicating a less risky balance sheet.
Scores Comparison
The following table compares the Altman Z-Score and Piotroski Score of QUALCOMM and Marvell Technology:
QUALCOMM Scores
- Altman Z-Score: 6.37, indicating a safe zone status.
- Piotroski Score: 7, categorized as strong financials.
Marvell Technology Scores
- Altman Z-Score: 6.76, indicating a safe zone status.
- Piotroski Score: 7, categorized as strong financials.
Which company has the best scores?
Both QUALCOMM and Marvell Technology have Altman Z-Scores well within the safe zone and identical Piotroski Scores of 7, indicating equally strong financial health based on the provided data.
Grades Comparison
Here is the grades comparison of QUALCOMM Incorporated and Marvell Technology, Inc.:
QUALCOMM Incorporated Grades
This table displays recent grades and rating actions from reputable financial institutions for QUALCOMM Incorporated.
| Grading Company | Action | New Grade | Date |
|---|---|---|---|
| Mizuho | Downgrade | Neutral | 2026-01-09 |
| Rosenblatt | Maintain | Buy | 2025-11-06 |
| B of A Securities | Maintain | Buy | 2025-11-06 |
| Mizuho | Maintain | Outperform | 2025-11-06 |
| Wells Fargo | Maintain | Underweight | 2025-11-06 |
| Piper Sandler | Maintain | Overweight | 2025-11-06 |
| UBS | Maintain | Neutral | 2025-11-06 |
| JP Morgan | Maintain | Overweight | 2025-11-04 |
| Citigroup | Maintain | Neutral | 2025-10-28 |
| Rosenblatt | Maintain | Buy | 2025-10-28 |
QUALCOMM’s grades show a mix of Buy and Neutral ratings, with one recent downgrade by Mizuho to Neutral, indicating some cautious sentiment among analysts.
Marvell Technology, Inc. Grades
Below is a summary of recent grading actions from financial firms for Marvell Technology, Inc.
| Grading Company | Action | New Grade | Date |
|---|---|---|---|
| Rosenblatt | Maintain | Buy | 2026-01-07 |
| Melius Research | Upgrade | Buy | 2026-01-05 |
| Benchmark | Downgrade | Hold | 2025-12-08 |
| B. Riley Securities | Maintain | Buy | 2025-12-03 |
| JP Morgan | Maintain | Overweight | 2025-12-03 |
| Susquehanna | Maintain | Positive | 2025-12-03 |
| Benchmark | Maintain | Buy | 2025-12-03 |
| Oppenheimer | Maintain | Outperform | 2025-12-03 |
| Stifel | Maintain | Buy | 2025-12-03 |
| Rosenblatt | Maintain | Buy | 2025-12-03 |
Marvell Technology’s grades predominantly reflect Buy and Outperform ratings, with one Hold downgrade, showing mostly positive analyst sentiment.
Which company has the best grades?
Marvell Technology, Inc. has received a higher proportion of Buy and Outperform grades compared to QUALCOMM Incorporated, which has a more mixed rating profile including Neutral and Underweight grades. This difference may influence investors’ perception of growth and risk profiles.
Strengths and Weaknesses
Below is a comparison table of key strengths and weaknesses for QUALCOMM Incorporated (QCOM) and Marvell Technology, Inc. (MRVL) based on their latest financial and operational data.
| Criterion | QUALCOMM Incorporated (QCOM) | Marvell Technology, Inc. (MRVL) |
|---|---|---|
| Diversification | Strong, with dominant segments in QCT ($38.4B) and QTL ($5.6B) revenue streams | Moderate, focused on Data Center ($4.16B) with smaller contributions in other segments |
| Profitability | Favorable net margin (12.5%), ROE (26.1%), ROIC (13.2%) | Negative net margin (-15.3%), negative ROE (-6.6%), negative ROIC (-3.9%) |
| Innovation | Established leader in wireless tech, consistent value creation despite declining ROIC trend | Struggling with value destruction and declining ROIC, weaker profitability indicators |
| Global presence | Extensive, with a diversified product portfolio serving multiple regions | Global presence focused on specific tech niches but limited scale compared to QCOM |
| Market Share | Strong in mobile chipset market with high asset turnover (9.44) | Smaller market share, evidenced by lower asset turnover (0.29) and declining profitability |
Key takeaways: QUALCOMM shows solid profitability, diversification, and market leadership despite a declining ROIC trend, signaling cautious optimism. Marvell faces significant challenges with negative profitability and value destruction, indicating higher investment risk.
Risk Analysis
Below is a comparative table summarizing key risk metrics for QUALCOMM Incorporated (QCOM) and Marvell Technology, Inc. (MRVL) as of 2025-2026:
| Metric | QUALCOMM Incorporated (QCOM) | Marvell Technology, Inc. (MRVL) |
|---|---|---|
| Market Risk | Beta 1.21 (moderate volatility) | Beta 1.95 (high volatility) |
| Debt level | Debt-to-Equity 0.7 (neutral), Debt-to-Assets 29.54% (favorable) | Debt-to-Equity 0.32 (favorable), Debt-to-Assets 21.5% (favorable) |
| Regulatory Risk | Moderate; operates globally with government contracts | Moderate; operates in multiple countries including China and US |
| Operational Risk | Diversified product segments, stable asset turnover (0.88) | Lower asset turnover (0.29), negative net margin indicates operational challenges |
| Environmental Risk | Standard industry risks; no major disclosures | Industry-standard risks; no major disclosures |
| Geopolitical Risk | Exposure to US-China tensions affecting tech supply chains | High exposure with operations in Asia-Pacific region |
The most significant risks lie in MRVL’s operational and market volatility due to its negative profitability and higher beta, exposing it to greater swings and financial instability. QCOM, while facing moderate market and geopolitical risks, demonstrates stronger financial stability and operational efficiency, mitigating downside risks comparatively.
Which Stock to Choose?
QUALCOMM Incorporated (QCOM) shows a favorable income evolution with 13.66% revenue growth in 2025 and strong profitability metrics including a 12.51% net margin and 26.13% ROE. Its financial ratios are mostly favorable, supported by a low net debt to EBITDA of 0.62 and a solid current ratio of 2.82. The company holds a very favorable rating with a B+ grade and demonstrates a slightly favorable economic moat despite a declining ROIC trend.
Marvell Technology, Inc. (MRVL) presents a mixed income picture with a modest 4.71% revenue growth but negative net margin of -15.35% and declining profitability ratios such as -6.59% ROE. Its financial ratios are largely unfavorable, including a high net debt to EBITDA of 5.21 and weak interest coverage. The company’s rating is also B+ but reflects a very unfavorable moat due to value destruction and declining ROIC, indicating financial challenges.
Considering ratings and overall financial evaluations, QCOM’s favorable income statement and mostly strong financial ratios might appeal to investors seeking stability and quality. Conversely, MRVL’s status could be seen as more suitable for risk-tolerant investors aiming at potential turnaround or growth opportunities despite current profitability and financial weaknesses.
Disclaimer: Investment carries a risk of loss of initial capital. The past performance is not a reliable indicator of future results. Be sure to understand risks before making an investment decision.
Go Further
I encourage you to read the complete analyses of QUALCOMM Incorporated and Marvell Technology, Inc. to enhance your investment decisions: