In the dynamic world of semiconductors, QUALCOMM Incorporated and Lattice Semiconductor Corporation stand out as key players driving innovation. QUALCOMM, a giant with a broad portfolio in wireless technology, contrasts with Lattice’s specialized focus on programmable logic devices. Both companies compete within overlapping markets, making their strategies and growth prospects particularly compelling to investors. This article will help you decide which of these semiconductor leaders deserves a place in your investment portfolio.
Table of contents
Companies Overview
I will begin the comparison between QUALCOMM and Lattice Semiconductor by providing an overview of these two companies and their main differences.
QUALCOMM Overview
QUALCOMM Incorporated focuses on developing and commercializing foundational technologies for the global wireless industry. It operates through three segments: Qualcomm CDMA Technologies, Qualcomm Technology Licensing, and Qualcomm Strategic Initiatives. The company supplies integrated circuits and system software for wireless communications and licenses intellectual property related to various wireless standards. Headquartered in San Diego, CA, QUALCOMM has a market cap of 175.5B and employs 49,000 people.
Lattice Semiconductor Overview
Lattice Semiconductor Corporation develops and sells semiconductor products, including field programmable gate arrays and video connectivity products, across Asia, Europe, and the Americas. It also licenses technology through IP services and patent monetization. Serving OEMs in communications, computing, consumer, and automotive markets, Lattice is based in Hillsboro, OR, with a market cap of 11.6B and 1,110 employees.
Key similarities and differences
Both QUALCOMM and Lattice operate in the semiconductor industry and serve technology markets globally. QUALCOMM’s business model centers on integrated circuit development, software, and IP licensing for wireless technologies, while Lattice focuses on programmable semiconductors and IP licensing with a smaller scale and workforce. QUALCOMM’s diversified segments and larger market cap contrast with Lattice’s emphasis on FPGA products and targeted end markets.
Income Statement Comparison
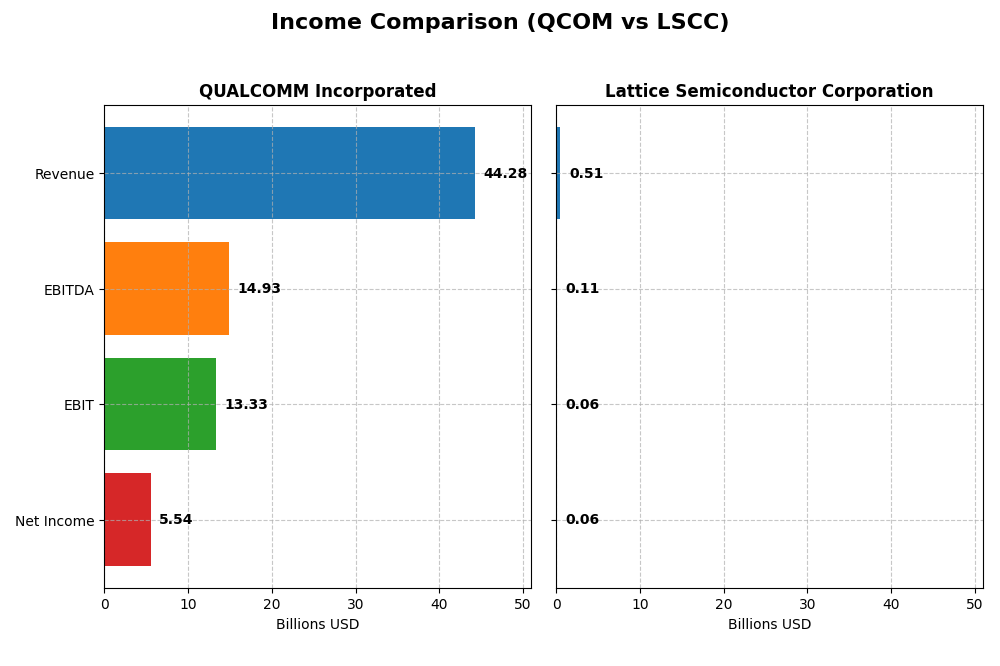
The table below compares the most recent fiscal year income statement metrics for QUALCOMM Incorporated and Lattice Semiconductor Corporation, providing a clear financial overview.
| Metric | QUALCOMM Incorporated | Lattice Semiconductor Corporation |
|---|---|---|
| Market Cap | 175.5B | 11.6B |
| Revenue | 44.3B | 509.4M |
| EBITDA | 14.9B | 106.9M |
| EBIT | 13.3B | 60.7M |
| Net Income | 5.54B | 61.1M |
| EPS | 5.06 | 0.44 |
| Fiscal Year | 2025 | 2024 |
Income Statement Interpretations
QUALCOMM Incorporated
QUALCOMM’s revenue trended upward from $33.6B in 2021 to $44.3B in 2025, reflecting a 31.9% growth over five years. Net income declined overall, dropping from $9.0B in 2021 to $5.5B in 2025, with net margin falling significantly. The latest year showed revenue growth of 13.7%, EBIT margin improvement, but a steep net margin contraction by over 50%, indicating margin pressures despite top-line gains.
Lattice Semiconductor Corporation
Lattice’s revenue increased from $408M in 2020 to $509M in 2024, a 24.8% rise over five years, though revenue fell sharply by 30.9% in 2024. Net income grew overall, reaching $61M in 2024, with net margin stable around 12%. However, the latest year saw significant declines in revenue, gross profit, EBIT, and EPS, reflecting a challenging recent performance despite generally favorable margins historically.
Which one has the stronger fundamentals?
QUALCOMM exhibits stronger absolute revenue and EBIT margins with robust revenue growth, but faces declining net income and margins recently. Lattice shows consistent net income growth and higher gross margins but suffers from sharper recent declines in profitability and revenue. Both maintain favorable overall income statements, yet QUALCOMM’s scale and margin strength contrast with Lattice’s volatility and recent profitability challenges.
Financial Ratios Comparison
Below is a comparison of key financial ratios for QUALCOMM Incorporated (QCOM) and Lattice Semiconductor Corporation (LSCC) based on their most recent fiscal year data.
| Ratios | QUALCOMM Incorporated (2025) | Lattice Semiconductor Corporation (2024) |
|---|---|---|
| ROE | 26.13% | 8.60% |
| ROIC | 13.19% | 4.59% |
| P/E | 32.70 | 132.74 |
| P/B | 8.54 | 11.41 |
| Current Ratio | 2.82 | 3.66 |
| Quick Ratio | 2.10 | 2.62 |
| D/E (Debt to Equity) | 0.70 | 0.02 |
| Debt-to-Assets | 29.54% | 1.81% |
| Interest Coverage | 18.61 | 129.54 |
| Asset Turnover | 0.88 | 0.60 |
| Fixed Asset Turnover | 9.44 | 7.62 |
| Payout Ratio | 68.67% | 0% |
| Dividend Yield | 2.10% | 0% |
Interpretation of the Ratios
QUALCOMM Incorporated
QUALCOMM’s financial ratios generally appear strong, with favorable net margin at 12.51%, ROE at 26.13%, and ROIC at 13.19%. The current and quick ratios indicate solid liquidity, while debt levels are well-managed. However, valuation multiples like P/E of 32.7 and P/B of 8.54 are relatively high. The company pays dividends, offering a 2.1% yield with sustainable coverage, posing limited risk of unsustainable payouts.
Lattice Semiconductor Corporation
Lattice Semiconductor shows mixed ratios with a decent net margin of 12.0% but weaker returns on equity (8.6%) and invested capital (4.59%). The weighted average cost of capital (WACC) at 11.81% is unfavorable, and valuation multiples are high, with a P/E of 132.74 and P/B of 11.41. LSCC does not pay dividends, likely reinvesting in growth and R&D, supported by strong interest coverage and low debt levels.
Which one has the best ratios?
Comparing both, QUALCOMM demonstrates a more favorable overall financial profile, with a higher percentage of favorable ratios and balanced leverage. Lattice Semiconductor’s higher valuation multiples and weaker profitability metrics weigh against it, despite solid liquidity and low debt. Thus, QUALCOMM currently presents the more robust set of financial ratios.
Strategic Positioning
This section compares the strategic positioning of QUALCOMM and Lattice Semiconductor, including market position, key segments, and exposure to disruption:
QUALCOMM
- Leading market position with significant competitive pressure in semiconductors
- Diverse segments: QCT integrated circuits, QTL licensing, QSI investments
- Invests in early-stage technologies like 5G, AI, automotive, IoT
Lattice Semiconductor
- Smaller market cap with higher beta indicating more volatility
- Focused on field programmable gate arrays and video connectivity products
- Limited exposure, mainly licenses technology and sells semiconductor products
QUALCOMM vs Lattice Semiconductor Positioning
QUALCOMM operates with a diversified segment approach spanning product development, licensing, and strategic investments, providing multiple revenue streams. Lattice Semiconductor focuses on specialized FPGA products and licensing, offering a more concentrated business model with narrower market reach.
Which has the best competitive advantage?
QUALCOMM shows a slightly favorable moat by creating value despite declining profitability. Lattice Semiconductor has a very unfavorable moat, shedding value with decreasing returns and lower efficiency in capital use.
Stock Comparison
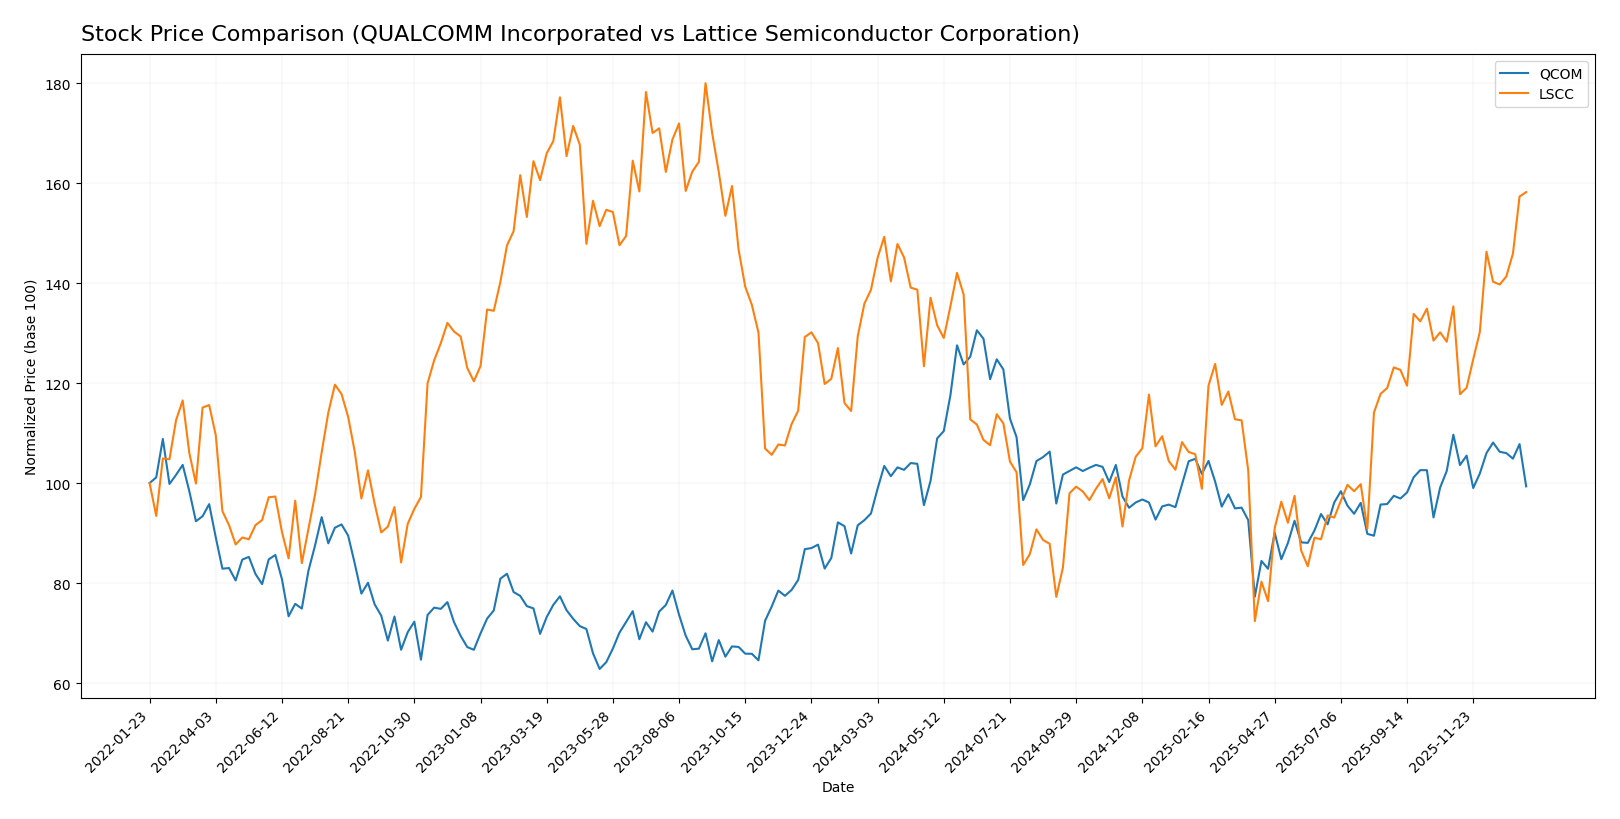
The stock price performance of QUALCOMM Incorporated (QCOM) and Lattice Semiconductor Corporation (LSCC) over the past 12 months shows distinct bullish trends with notable acceleration, despite recent divergences in short-term momentum.
Trend Analysis
QUALCOMM’s stock price increased by 5.76% over the past year, confirming a bullish trend with acceleration. The price ranged between 127.46 and 215.33, showing high volatility with a standard deviation of 16.08. However, recent months indicate a bearish short-term trend with a -9.43% decline.
Lattice Semiconductor posted a stronger bullish trend with a 14.08% gain over the same period and accelerating momentum. Its price fluctuated from 39.03 to 85.28, with moderate volatility (std dev 11.01). The recent trend remains bullish with a 16.88% increase, supported by strong buyer dominance.
Comparing both stocks, Lattice Semiconductor delivered higher market performance than QUALCOMM over the past year, driven by stronger price appreciation and sustained recent bullish momentum.
Target Prices
Analysts provide a clear target price range for both QUALCOMM Incorporated and Lattice Semiconductor Corporation, reflecting moderate upside potential.
| Company | Target High | Target Low | Consensus |
|---|---|---|---|
| QUALCOMM Incorporated | 210 | 165 | 185.71 |
| Lattice Semiconductor Corporation | 105 | 65 | 83 |
For QUALCOMM, the consensus target price of 185.71 suggests a potential price appreciation from the current 163.87 USD, indicating moderate optimism. Lattice Semiconductor’s target consensus at 83 USD is slightly below its current price of 85.06 USD, hinting at a cautious outlook from analysts.
Analyst Opinions Comparison
This section compares analysts’ ratings and financial scores for QUALCOMM Incorporated and Lattice Semiconductor Corporation:
Rating Comparison
QUALCOMM Incorporated Rating
- Rating: B+, considered very favorable by analysts.
- Discounted Cash Flow Score: 4, indicating favorable valuation.
- ROE Score: 5, a very favorable measure of profit generation.
- ROA Score: 5, showing very efficient asset utilization.
- Debt To Equity Score: 1, very unfavorable due to high financial risk.
- Overall Score: 3, moderate overall financial standing.
Lattice Semiconductor Corporation Rating
- Rating: B-, also regarded as very favorable.
- Discounted Cash Flow Score: 3, reflecting a moderate valuation.
- ROE Score: 2, seen as moderate profitability efficiency.
- ROA Score: 3, a moderate level of asset efficiency.
- Debt To Equity Score: 4, favorable, indicating stronger balance sheet.
- Overall Score: 2, moderate but lower than QUALCOMM’s.
Which one is the best rated?
QUALCOMM holds a higher rating (B+) and scores better in ROE and ROA, showing superior profitability and asset use. However, Lattice Semiconductor has a stronger debt to equity score, indicating lower financial risk. Overall, QUALCOMM is better rated based on these metrics.
Scores Comparison
The following table presents a comparison of the Altman Z-Score and Piotroski Score for QUALCOMM and Lattice Semiconductor:
QUALCOMM Scores
- Altman Z-Score: 6.37, indicating a safe zone with low bankruptcy risk.
- Piotroski Score: 7, reflecting strong financial health.
Lattice Semiconductor Scores
- Altman Z-Score: 52.69, indicating a safe zone with very low bankruptcy risk.
- Piotroski Score: 5, reflecting average financial health.
Which company has the best scores?
Lattice Semiconductor has a significantly higher Altman Z-Score, indicating stronger bankruptcy safety. QUALCOMM, however, has a better Piotroski Score, implying comparatively stronger overall financial health.
Grades Comparison
The following presents a comparison of recent grades and ratings for QUALCOMM Incorporated and Lattice Semiconductor Corporation:
QUALCOMM Incorporated Grades
This table summarizes recent grades assigned by reputable financial institutions for QUALCOMM:
| Grading Company | Action | New Grade | Date |
|---|---|---|---|
| Mizuho | Downgrade | Neutral | 2026-01-09 |
| Rosenblatt | Maintain | Buy | 2025-11-06 |
| B of A Securities | Maintain | Buy | 2025-11-06 |
| Mizuho | Maintain | Outperform | 2025-11-06 |
| Wells Fargo | Maintain | Underweight | 2025-11-06 |
| Piper Sandler | Maintain | Overweight | 2025-11-06 |
| UBS | Maintain | Neutral | 2025-11-06 |
| JP Morgan | Maintain | Overweight | 2025-11-04 |
| Citigroup | Maintain | Neutral | 2025-10-28 |
| Rosenblatt | Maintain | Buy | 2025-10-28 |
QUALCOMM’s grades show a mixed but predominantly positive outlook, with multiple firms maintaining Buy or Overweight ratings, though some neutrality and an Underweight rating are noted.
Lattice Semiconductor Corporation Grades
This table summarizes recent grades assigned by reputable financial institutions for Lattice Semiconductor:
| Grading Company | Action | New Grade | Date |
|---|---|---|---|
| Keybanc | Maintain | Overweight | 2026-01-13 |
| Stifel | Maintain | Buy | 2025-11-04 |
| Baird | Maintain | Outperform | 2025-11-04 |
| Needham | Maintain | Buy | 2025-11-04 |
| Rosenblatt | Maintain | Buy | 2025-11-04 |
| Benchmark | Maintain | Buy | 2025-11-04 |
| Susquehanna | Maintain | Positive | 2025-10-22 |
| Keybanc | Maintain | Overweight | 2025-09-30 |
| Needham | Maintain | Buy | 2025-09-22 |
| Benchmark | Maintain | Buy | 2025-09-11 |
Lattice Semiconductor’s grades are consistently positive, with a strong emphasis on Buy and Overweight ratings and no downgrades.
Which company has the best grades?
Both QUALCOMM and Lattice Semiconductor have a consensus Buy rating. However, Lattice Semiconductor displays a more uniformly positive grading trend, with multiple firms maintaining Buy or Outperform ratings and no downgrades. QUALCOMM’s ratings are more mixed, including some Neutral and Underweight grades. This suggests Lattice Semiconductor might be viewed with somewhat higher confidence by analysts, potentially influencing investor sentiment regarding risk and upside potential.
Strengths and Weaknesses
Below is a comparison of key strengths and weaknesses for QUALCOMM Incorporated (QCOM) and Lattice Semiconductor Corporation (LSCC) based on the most recent data available.
| Criterion | QUALCOMM Incorporated (QCOM) | Lattice Semiconductor Corporation (LSCC) |
|---|---|---|
| Diversification | Strong product segmentation with QCT (~38.4B) and QTL (~5.6B) revenues | Limited diversification; mainly License and Service (~17M) and product sales concentrated in distributors |
| Profitability | High ROIC (13.19%) and net margin (12.51%), creating value despite declining trend | Low ROIC (4.59%) and net margin (12.0%), shedding value with declining profitability |
| Innovation | Consistent investment in R&D with strong market presence in wireless tech | Smaller scale innovation with less broad product portfolio |
| Global presence | Extensive global footprint with widespread adoption of Qualcomm technologies | More niche market presence, focused on semiconductor licensing and distribution |
| Market Share | Leading position in mobile chipsets and licensing | Smaller market share, competing in specialized semiconductor segments |
Key takeaways: QUALCOMM remains a value-creating leader with strong profitability and diversified revenue streams despite some decline in ROIC. Lattice Semiconductor shows weaknesses in profitability and market scope, indicating higher risk for investors.
Risk Analysis
Below is a summary table highlighting key risks for QUALCOMM Incorporated (QCOM) and Lattice Semiconductor Corporation (LSCC) based on the most recent financial and market data:
| Metric | QUALCOMM Incorporated (QCOM) | Lattice Semiconductor Corporation (LSCC) |
|---|---|---|
| Market Risk | Beta 1.21 suggests moderate market volatility exposure | Higher beta 1.72 indicates elevated market sensitivity |
| Debt level | Moderate debt-to-equity 0.7; interest coverage very strong (20x) | Very low debt-to-equity 0.02; excellent interest coverage (228x) |
| Regulatory Risk | Exposure to wireless tech patents and licensing regulations globally | Moderate risk due to semiconductor export controls and IP licenses |
| Operational Risk | Large scale operations with 49K employees; supply chain complexity | Smaller scale with 1.1K employees; niche FPGA market focus |
| Environmental Risk | Industry pressure on sustainable manufacturing and energy use | Similar industry pressures; less diversified product base increases vulnerability |
| Geopolitical Risk | Significant global supply chain exposure and US government contracts | Moderate exposure due to international sales and semiconductor trade tensions |
The most impactful risks are market volatility—especially for LSCC with its higher beta—and regulatory challenges tied to intellectual property and trade controls that can hinder growth or increase costs. QUALCOMM’s moderate leverage with strong interest coverage and diversified segments helps mitigate financial distress risk, whereas LSCC’s low debt offers stability but comes with a higher valuation risk. Investors should weigh these factors carefully in their risk management strategy.
Which Stock to Choose?
QUALCOMM Incorporated (QCOM) shows a favorable income evolution with strong revenue growth and profitability metrics, supported by robust financial ratios including a high return on equity (26.13%) and a solid current ratio (2.82). Its debt levels are moderate, and the overall rating is very favorable (B+).
Lattice Semiconductor Corporation (LSCC) presents a mixed picture with favorable gross margin but a recent decline in revenue and profitability. Financial ratios reflect some weaknesses, especially in return on equity (8.6%) and return on invested capital (4.59%), despite low debt and a very favorable rating (B-).
Investors prioritizing value creation and stable profitability might find QCOM more aligned with their goals due to its favorable rating and consistent income statement performance. Conversely, those with a higher risk tolerance or growth focus might see potential in LSCC, given its recent price acceleration despite mixed financial ratios.
Disclaimer: Investment carries a risk of loss of initial capital. The past performance is not a reliable indicator of future results. Be sure to understand risks before making an investment decision.
Go Further
I encourage you to read the complete analyses of QUALCOMM Incorporated and Lattice Semiconductor Corporation to enhance your investment decisions: