Home > Comparison > Technology > LRCX vs QCOM
The strategic rivalry between Lam Research Corporation and QUALCOMM Incorporated shapes the semiconductor industry’s evolution. Lam Research, a capital-intensive equipment manufacturer, contrasts with QUALCOMM’s high-margin technology licensing and chip design model. This head-to-head highlights a battle between manufacturing innovation and intellectual property dominance. This analysis aims to identify which business model provides a superior risk-adjusted return, guiding investors seeking balanced exposure in the dynamic technology sector.
Table of contents
Companies Overview
Lam Research and QUALCOMM are pivotal players shaping the semiconductor industry’s evolution and wireless technology landscape.
Lam Research Corporation: Semiconductor Equipment Innovator
Lam Research Corporation leads in semiconductor processing equipment, enabling integrated circuit fabrication globally. It generates revenue by designing, manufacturing, and servicing advanced tools for film deposition, etching, and wafer cleaning. In 2026, the company focuses strategically on expanding its portfolio of plasma and atomic layer deposition systems to meet rising demand in chip manufacturing precision.
QUALCOMM Incorporated: Wireless Technology Pioneer
QUALCOMM dominates in wireless communication technologies, earning primarily through chipset sales and licensing its extensive patent portfolio. Its revenue streams span integrated circuits, system software, and intellectual property licensing for 3G to 5G standards. For 2026, QUALCOMM emphasizes innovation in 5G, AI, and IoT investments, aiming to strengthen its foothold in next-gen wireless connectivity and diverse technology applications.
Strategic Collision: Similarities & Divergences
Both companies operate at the semiconductor sector’s core but diverge sharply in approach. Lam Research adopts a hardware-driven model, focusing on precision manufacturing tools, while QUALCOMM leverages an intellectual property and chipset ecosystem. Their primary battleground is the semiconductor value chain—Lam in equipment supply, QUALCOMM in wireless technology integration. Investors face distinct profiles: Lam offers exposure to fabrication equipment demand; QUALCOMM provides a blend of licensing royalties and chipset growth potential.
Income Statement Comparison
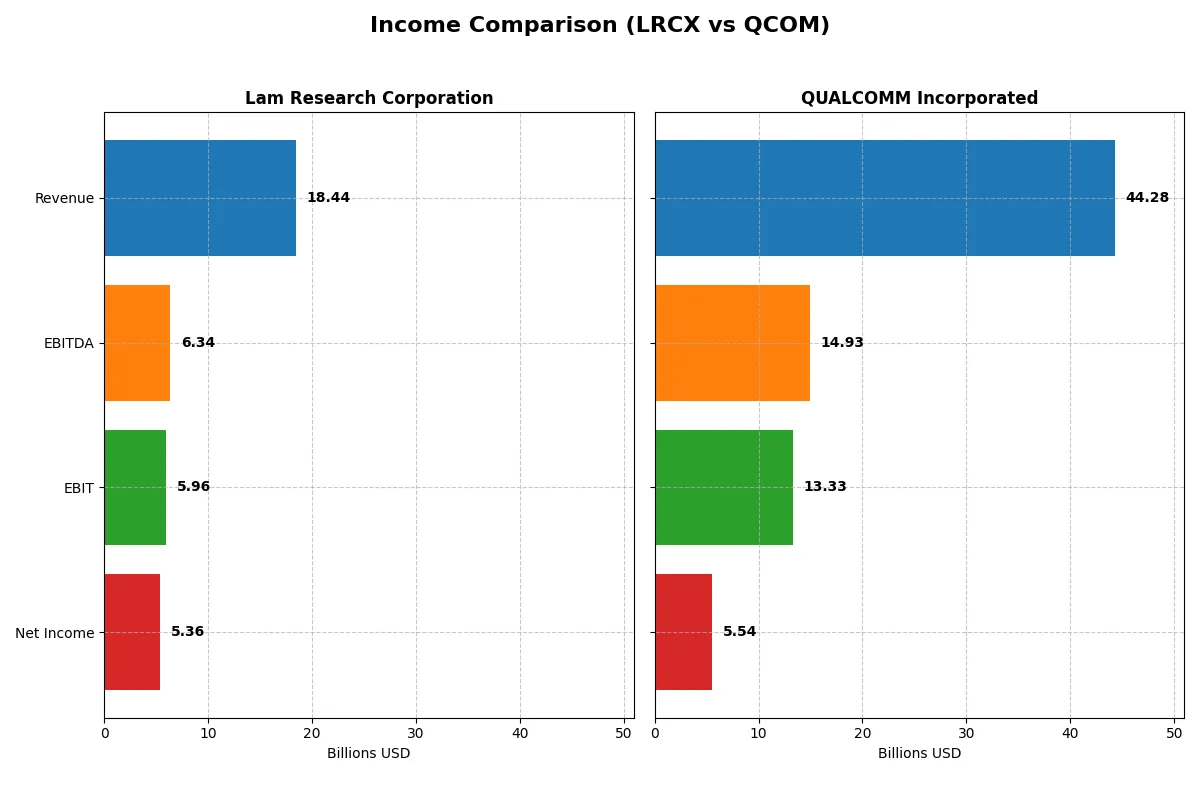
This data dissects the core profitability and scalability of both corporate engines to reveal who dominates the bottom line:
| Metric | Lam Research Corporation (LRCX) | QUALCOMM Incorporated (QCOM) |
|---|---|---|
| Revenue | 18.4B | 44.3B |
| Cost of Revenue | 9.5B | 19.7B |
| Operating Expenses | 3.1B | 12.2B |
| Gross Profit | 9.0B | 24.5B |
| EBITDA | 6.3B | 14.9B |
| EBIT | 6.0B | 13.3B |
| Interest Expense | 178M | 664M |
| Net Income | 5.4B | 5.5B |
| EPS | 4.17 | 5.06 |
| Fiscal Year | 2025 | 2025 |
Income Statement Analysis: The Bottom-Line Duel
This income statement comparison reveals how efficiently each company converts revenue into profit, showcasing their operational strength and financial discipline.
Lam Research Corporation Analysis
Lam Research’s revenue rose from $14.9B in 2024 to $18.4B in 2025, driving a strong net income growth from $3.8B to $5.4B. Its gross margin stands at a healthy 48.7%, with net margin at 29.1%, reflecting robust profitability. In 2025, operational efficiency surged, supported by a 31% EBIT growth and a 43% EPS increase, signaling solid momentum.
QUALCOMM Incorporated Analysis
QUALCOMM’s revenue climbed from $39B in 2024 to $44.3B in 2025, with gross margin improving to 55.4%. Despite top-line growth, net income fell sharply from $10.1B to $5.5B, halving net margin to 12.5%. The 2025 year showed operational gains with a 21% EBIT increase, but net margin and EPS declines highlight pressure on bottom-line efficiency.
Margin Power vs. Revenue Scale
Lam Research delivers superior net margin growth and profitability despite smaller revenue scale compared to QUALCOMM. QUALCOMM’s higher revenue and gross margin contrast with its deteriorating net margin and earnings decline. For investors prioritizing margin resilience and earnings growth, Lam Research’s profile currently appears more compelling.
Financial Ratios Comparison
These vital ratios act as a diagnostic tool to expose the underlying fiscal health, valuation premiums, and capital efficiency of the companies compared below:
| Ratios | Lam Research (LRCX) | QUALCOMM (QCOM) |
|---|---|---|
| ROE | 54.3% | 26.1% |
| ROIC | 34.0% | 13.2% |
| P/E | 23.4 | 32.7 |
| P/B | 12.7 | 8.5 |
| Current Ratio | 2.21 | 2.82 |
| Quick Ratio | 1.55 | 2.10 |
| D/E | 0.48 | 0.70 |
| Debt-to-Assets | 22.3% | 29.5% |
| Interest Coverage | 33.1 | 18.6 |
| Asset Turnover | 0.86 | 0.88 |
| Fixed Asset Turnover | 7.59 | 9.44 |
| Payout Ratio | 21.5% | 68.7% |
| Dividend Yield | 0.92% | 2.10% |
| Fiscal Year | 2025 | 2025 |
Efficiency & Valuation Duel: The Vital Signs
Financial ratios serve as a company’s DNA, uncovering hidden risks and operational strengths that numbers alone cannot reveal.
Lam Research Corporation
Lam Research delivers exceptional profitability with a 54.3% ROE and a strong 29.1% net margin. Its P/E of 23.4 signals a fairly valued stock, though a high P/B ratio of 12.7 flags rich equity pricing. Lam returns capital cautiously, offering a modest 0.9% dividend yield while reinvesting heavily in R&D for growth.
QUALCOMM Incorporated
QUALCOMM posts solid but lower profitability, with a 26.1% ROE and 12.5% net margin. Its P/E stands stretched at 32.7, reflecting premium valuation concerns. The company compensates shareholders well with a 2.1% dividend yield and maintains a robust R&D spend of over 20%, prioritizing innovation alongside steady returns.
Premium Valuation vs. Operational Safety
Lam Research balances stellar returns against moderate valuation, signaling efficient capital use with manageable risk. QUALCOMM commands a premium price but offers higher dividends and aggressive reinvestment. Investors seeking operational safety may prefer Lam’s profile, while those chasing income with growth exposure might lean toward QUALCOMM.
Which one offers the Superior Shareholder Reward?
I compare Lam Research (LRCX) and QUALCOMM (QCOM) on dividends, payout ratios, and buybacks. Lam Research yields ~0.9%, with a conservative 21.5% payout ratio, signaling strong free cash flow coverage. QUALCOMM pays twice that yield at 2.1%, but with a hefty 69% payout ratio, risking dividend sustainability. Both companies maintain robust buyback programs, though Lam’s capital discipline suggests steadier buybacks. QUALCOMM reinvests heavily but faces higher payout risk. I see Lam Research’s balanced dividend and buyback approach as more sustainable, offering a superior total shareholder return profile in 2026.
Comparative Score Analysis: The Strategic Profile
The radar chart reveals the fundamental DNA and trade-offs of Lam Research Corporation and QUALCOMM Incorporated:
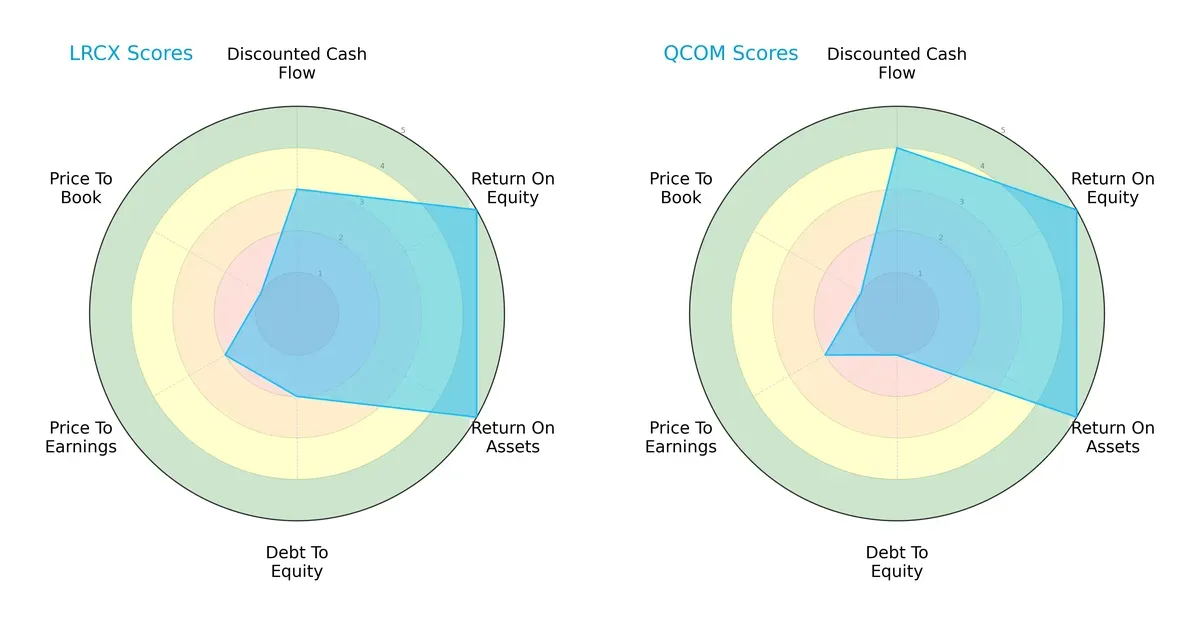
Lam Research leans on a balanced operational efficiency with top ROE and ROA scores of 5 each, but shows moderate financial risk with a debt-to-equity score of 2. QUALCOMM edges ahead on discounted cash flow with a 4, indicating better valuation prospects, yet it carries higher leverage risk, scoring only 1 on debt-to-equity. Both firms share moderate P/E and very unfavorable P/B valuations. Overall, Lam Research’s profile is more balanced, while QUALCOMM relies on a stronger cash flow valuation advantage but with higher financial risk.
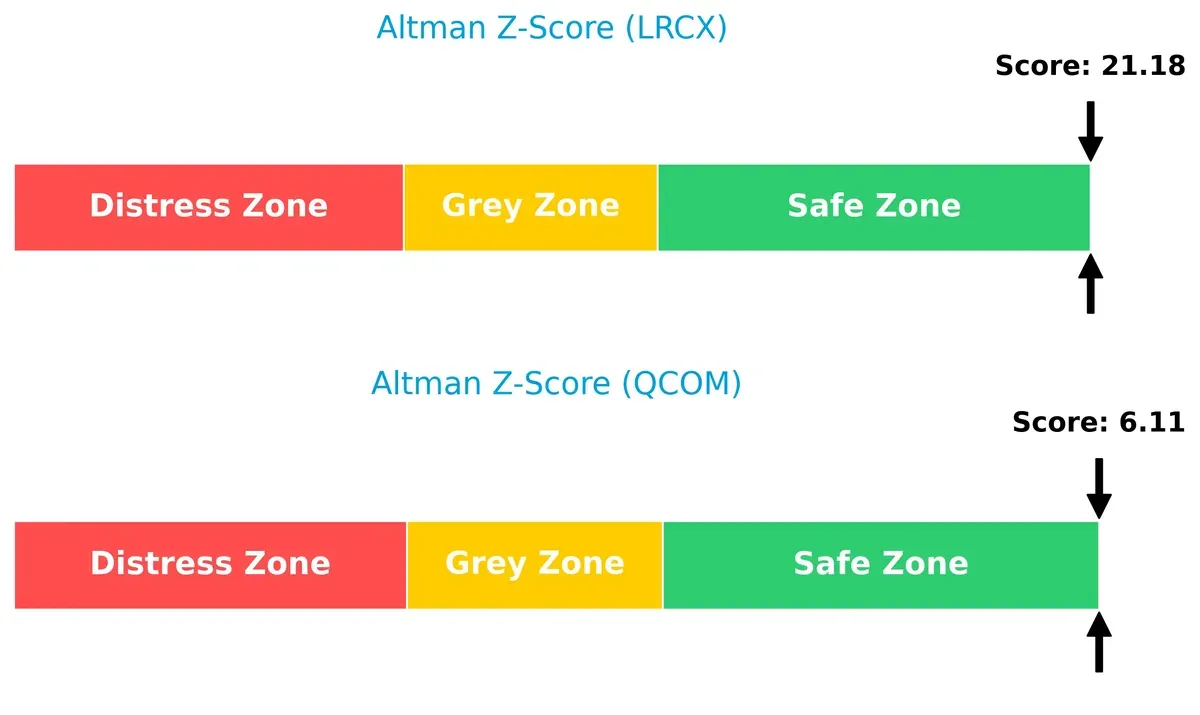
Bankruptcy Risk: Solvency Showdown
Lam Research’s Altman Z-Score of 21.18 far exceeds QUALCOMM’s 6.11, signaling a much stronger solvency position. Both are safely above the distress threshold, but Lam Research’s score suggests it is exceptionally well-positioned to withstand economic downturns and long-term financial stress:
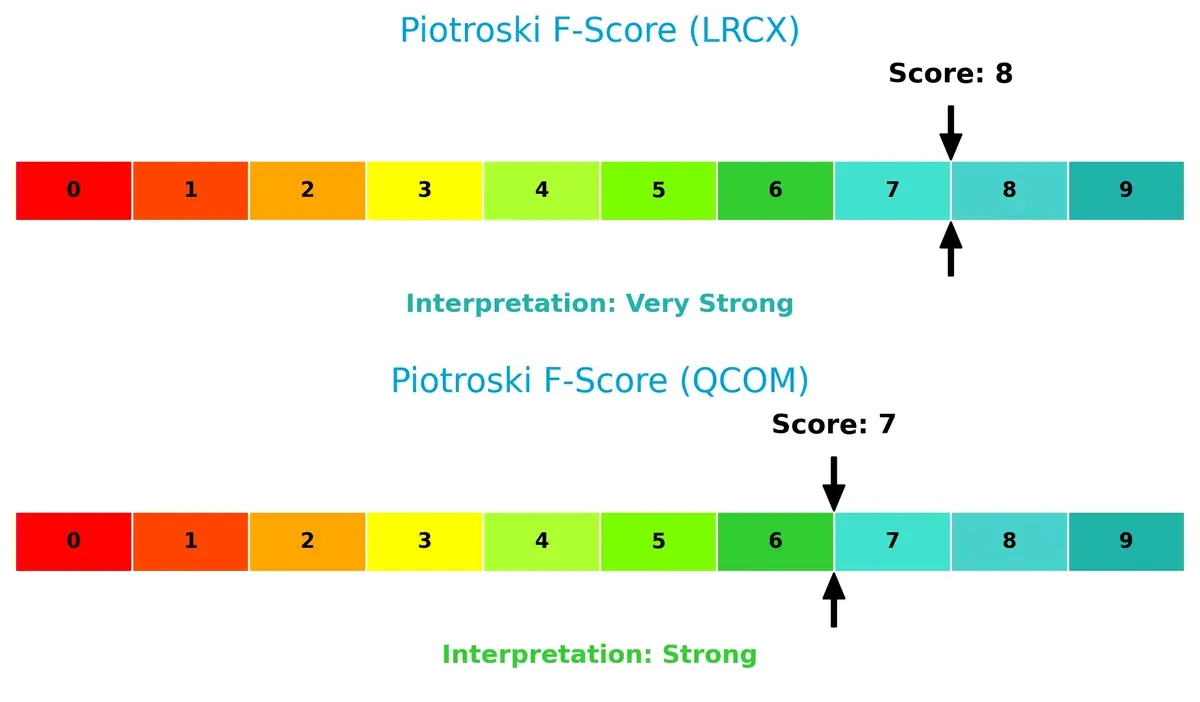
Financial Health: Quality of Operations
Lam Research posts a Piotroski F-Score of 8, indicating very strong internal financial health. QUALCOMM’s score of 7 is strong but slightly behind. This gap highlights Lam Research’s superior quality in profitability, liquidity, and operational efficiency, with no apparent red flags compared to QUALCOMM:
How are the two companies positioned?
This section dissects Lam Research and QUALCOMM’s operational DNA by comparing revenue distribution and internal dynamics. The goal is to confront their economic moats and reveal which model delivers the most resilient competitive advantage today.
Revenue Segmentation: The Strategic Mix
This visual comparison dissects how Lam Research Corporation and QUALCOMM Incorporated diversify their income streams and where their primary sector bets lie:
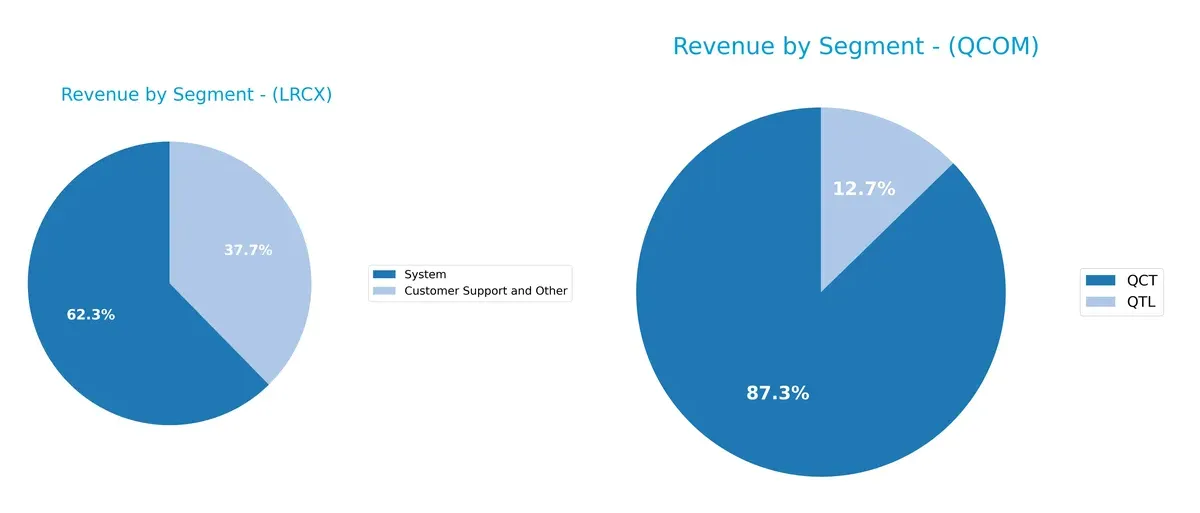
Lam Research anchors revenue in two segments: $11.5B from Systems and $6.9B from Customer Support. QUALCOMM dwarfs with $38.4B from QCT and $5.6B from QTL, showing a heavy reliance on QCT. Lam’s balanced mix reduces concentration risk, while QUALCOMM’s dominance in QCT signals ecosystem lock-in but exposes it to semiconductor cycle swings. This divergence shapes their strategic resilience and market positioning.
Strengths and Weaknesses Comparison
This table compares the Strengths and Weaknesses of Lam Research Corporation and QUALCOMM Incorporated:
Lam Research Corporation Strengths
- Strong profitability with 29.06% net margin
- High ROE at 54.33% and ROIC of 34.0%
- Solid liquidity: current ratio 2.21, quick ratio 1.55
- Low debt-to-assets at 22.28% with strong interest coverage
- Consistent global revenue from Asia and US markets
- Favorable fixed asset turnover at 7.59
QUALCOMM Incorporated Strengths
- Solid profitability with 12.51% net margin
- ROE of 26.13% and ROIC at 13.19% remain favorable
- Strong liquidity ratios: current 2.82, quick 2.1
- Higher dividend yield at 2.1% supports income investors
- Diversified revenue with large QCT segment and global presence
- Favorable fixed asset turnover at 9.44
Lam Research Corporation Weaknesses
- High WACC at 12.09% exceeds cost efficiency targets
- Unfavorable high PB ratio at 12.69 signals valuation risk
- Dividend yield low at 0.92%, less income focus
- Neutral PE ratio at 23.36 limits growth premium
- Moderate asset turnover at 0.86 signals asset utilization limits
QUALCOMM Incorporated Weaknesses
- Unfavorable high PE at 32.7 may pressure valuation
- Elevated PB at 8.54 suggests premium pricing risks
- Debt-to-equity ratio neutral at 0.7 indicates leverage caution
- Neutral WACC at 9.08 reflects cost of capital concerns
- Asset turnover neutral at 0.88 limits operational efficiency
Lam Research and QUALCOMM both show solid profitability and liquidity profiles, with strengths in global revenue diversity and asset management. However, valuation metrics and capital costs are notable risks, which may influence their strategic capital allocation and investor appeal going forward.
The Moat Duel: Analyzing Competitive Defensibility
A structural moat is the only barrier preventing long-term profits from competition’s relentless erosion. Let’s dissect how each firm defends its turf:
Lam Research Corporation: Precision Engineering Moat
Lam Research’s moat stems from its specialized semiconductor manufacturing equipment. This yields high ROIC above WACC by 22%, sustaining 30%+ EBIT margins. Innovations in atomic layer deposition deepen its competitive edge in 2026.
QUALCOMM Incorporated: Intellectual Property Moat
QUALCOMM’s moat relies on licensing key wireless patents, unlike Lam’s hardware focus. Despite generating value with a positive ROIC spread, its margin compression and declining ROIC signal vulnerability. Expansion into AI and 5G may stabilize profitability.
Moat Strength: Engineering Excellence vs. Patent Licensing
Lam’s widening moat and rising ROIC outmatch QUALCOMM’s shrinking patent moat and margin pressure. I see Lam Research better positioned to defend market share through operational innovation and margin resilience.
Which stock offers better returns?
Over the past year, Lam Research’s stock surged sharply with accelerating gains, while QUALCOMM’s shares experienced a steady decline marked by deceleration and lower trading volumes.
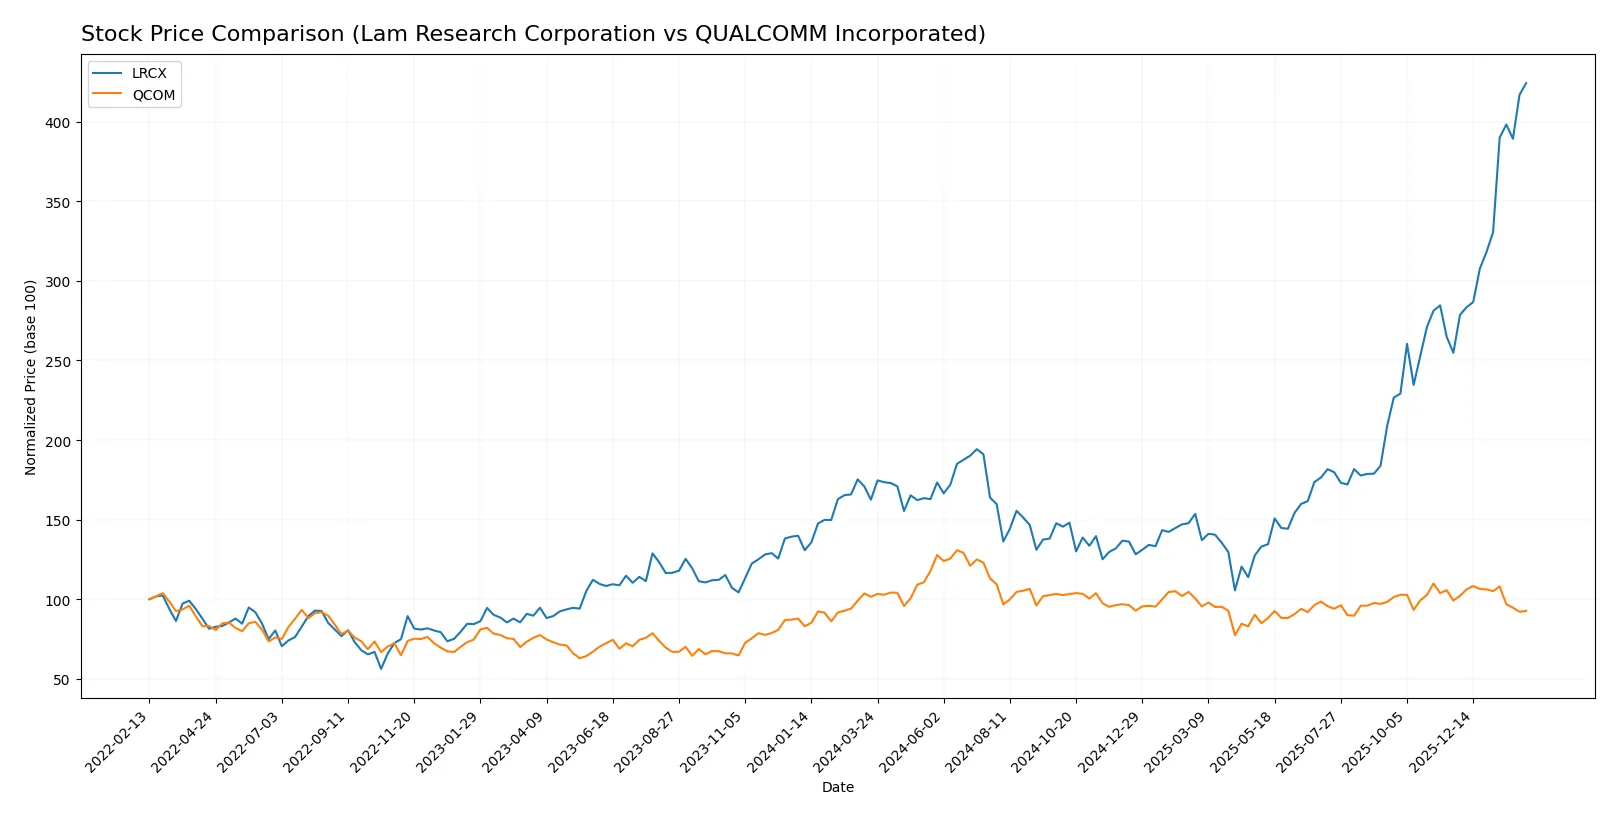
Trend Comparison
Lam Research’s stock price climbed 161% over the past 12 months, showing a bullish trend with accelerating momentum and a high volatility of 39.19. Prices ranged between 59.09 and 237.5.
QUALCOMM’s stock fell 8.7% during the same period, indicating a bearish trend with deceleration. Volatility stood at 16.21, with prices fluctuating between 127.46 and 215.33.
Lam Research outperformed QUALCOMM by delivering strong positive returns and accelerating price gains, while QUALCOMM showed a declining trend with seller-dominant volume behavior.
Target Prices
Analysts show a moderately bullish consensus for Lam Research Corporation and QUALCOMM Incorporated.
| Company | Target Low | Target High | Consensus |
|---|---|---|---|
| Lam Research Corporation | 127 | 325 | 266.76 |
| QUALCOMM Incorporated | 160 | 210 | 181.43 |
Lam Research’s target consensus of 267 significantly exceeds its current price of 238, indicating upside potential. QUALCOMM’s consensus of 181 also suggests a positive outlook versus its current 153 price.

Don’t Let Luck Decide Your Entry Point
Optimize your entry points with our advanced ProRealTime indicators. You’ll get efficient buy signals with precise price targets for maximum performance. Start outperforming now!
How do institutions grade them?
Lam Research Corporation Grades
The following table summarizes recent institutional grades for Lam Research Corporation:
| Grading Company | Action | New Grade | Date |
|---|---|---|---|
| UBS | Maintain | Buy | 2026-01-29 |
| Wells Fargo | Maintain | Overweight | 2026-01-29 |
| JP Morgan | Maintain | Overweight | 2026-01-29 |
| RBC Capital | Maintain | Outperform | 2026-01-29 |
| Citigroup | Maintain | Buy | 2026-01-29 |
| Stifel | Maintain | Buy | 2026-01-29 |
| Morgan Stanley | Maintain | Equal Weight | 2026-01-29 |
| Needham | Maintain | Buy | 2026-01-29 |
| Susquehanna | Maintain | Positive | 2026-01-29 |
| Goldman Sachs | Maintain | Buy | 2026-01-29 |
QUALCOMM Incorporated Grades
The following table summarizes recent institutional grades for QUALCOMM Incorporated:
| Grading Company | Action | New Grade | Date |
|---|---|---|---|
| UBS | Maintain | Neutral | 2026-01-26 |
| Mizuho | Maintain | Neutral | 2026-01-26 |
| Mizuho | Downgrade | Neutral | 2026-01-09 |
| B of A Securities | Maintain | Buy | 2025-11-06 |
| Rosenblatt | Maintain | Buy | 2025-11-06 |
| Wells Fargo | Maintain | Underweight | 2025-11-06 |
| Mizuho | Maintain | Outperform | 2025-11-06 |
| Piper Sandler | Maintain | Overweight | 2025-11-06 |
| UBS | Maintain | Neutral | 2025-11-06 |
| JP Morgan | Maintain | Overweight | 2025-11-04 |
Which company has the best grades?
Lam Research consistently earns buy and outperform ratings, reflecting broad institutional confidence. QUALCOMM’s ratings are more mixed, featuring several neutral and underweight grades. These differences may affect investor sentiment and portfolio positioning.
Risks specific to each company
The following categories identify critical pressure points and systemic threats facing Lam Research Corporation and QUALCOMM Incorporated in the 2026 market environment:
1. Market & Competition
Lam Research Corporation
- Faces intense rivalry in semiconductor equipment, requiring constant innovation to maintain technological edge.
QUALCOMM Incorporated
- Competes globally in wireless tech and licensing, challenged by rapid tech shifts and patent disputes.
2. Capital Structure & Debt
Lam Research Corporation
- Maintains moderate debt-to-equity (0.48) with strong interest coverage (33.4x), showing prudent leverage.
QUALCOMM Incorporated
- Higher debt-to-equity ratio (0.7) and lower interest coverage (20x) increase financial risk amid market uncertainty.
3. Stock Volatility
Lam Research Corporation
- Beta at 1.78 signals higher volatility than market, indicating sensitivity to tech sector swings.
QUALCOMM Incorporated
- Beta at 1.21 shows moderate volatility, reflecting steadier investor sentiment amid sector fluctuations.
4. Regulatory & Legal
Lam Research Corporation
- Subject to export controls and international trade policies impacting semiconductor equipment sales.
QUALCOMM Incorporated
- Faces ongoing patent litigations and scrutiny over licensing practices from regulators worldwide.
5. Supply Chain & Operations
Lam Research Corporation
- Relies on complex, global supply chains vulnerable to disruptions, especially in Asia-Pacific regions.
QUALCOMM Incorporated
- Supply chain risks mitigated somewhat by diversified product lines but still exposed to chip shortages.
6. ESG & Climate Transition
Lam Research Corporation
- Increasing pressure to reduce carbon footprint in manufacturing and address environmental regulations.
QUALCOMM Incorporated
- Faces scrutiny on responsible sourcing and energy use in wireless infrastructure and device components.
7. Geopolitical Exposure
Lam Research Corporation
- High exposure to US-China tensions affecting semiconductor equipment exports and market access.
QUALCOMM Incorporated
- Geopolitical risks from global wireless standards competition and US-China tech rivalry influence operations.
Which company shows a better risk-adjusted profile?
Lam Research’s most impactful risk is its high market volatility and geopolitical exposure, potentially destabilizing revenues. QUALCOMM’s principal risk comes from regulatory/legal challenges and higher leverage. Despite Lam’s volatility, its stronger balance sheet and superior interest coverage give it a better risk-adjusted profile. The widening gap in debt-to-equity and interest coverage metrics underscores this divergence in financial resilience.
Final Verdict: Which stock to choose?
Lam Research’s superpower lies in its exceptional capital efficiency and durable moat. It consistently delivers high returns well above its cost of capital, signaling strong value creation. The main point of vigilance is its premium valuation on book value, which may pressure future returns. It suits aggressive growth portfolios willing to pay for quality.
QUALCOMM boasts a strategic moat rooted in its dominant intellectual property and recurring revenue streams from licensing, offering steady cash flow. Though its profitability shows signs of pressure, it provides better safety with a solid dividend yield and balance sheet stability. It fits well within GARP portfolios seeking growth tempered by income.
If you prioritize dynamic capital allocation and long-term value creation, Lam Research outshines with its robust profitability and growth trajectory. However, if you seek income stability and a strategic moat in wireless technology, QUALCOMM offers better stability despite current operational headwinds. Each stock caters to distinct investor profiles with differing risk appetites.
Disclaimer: Investment carries a risk of loss of initial capital. The past performance is not a reliable indicator of future results. Be sure to understand risks before making an investment decision.
Go Further
I encourage you to read the complete analyses of Lam Research Corporation and QUALCOMM Incorporated to enhance your investment decisions: