Home > Comparison > Technology > QCOM vs KLAC
The strategic rivalry between QUALCOMM Incorporated and KLA Corporation shapes the semiconductor industry’s future. QUALCOMM, a technology giant, focuses on wireless communication and licensing intellectual property. KLA, a market leader, specializes in precision process control and yield management solutions. This analysis compares their distinct operational models to identify which offers superior risk-adjusted returns for a diversified portfolio amid evolving sector dynamics.

Table of contents
Companies Overview
QUALCOMM Incorporated and KLA Corporation are pivotal players shaping the semiconductor industry’s evolution.
QUALCOMM Incorporated: Wireless Technology Innovator
QUALCOMM dominates as a foundational technology provider for wireless communications. Its core revenue stems from licensing patents and selling integrated circuits for 3G to 5G technologies. In 2026, QUALCOMM focuses strategically on expanding its intellectual property portfolio and investing in emerging fields like AI and IoT through its strategic initiatives segment.
KLA Corporation: Semiconductor Process Control Leader
KLA specializes in process control and yield management solutions for semiconductor manufacturing. It generates revenue by selling inspection, metrology, and defect management systems critical for chip production. The company’s 2026 strategy emphasizes enhancing precision in advanced semiconductor and PCB manufacturing processes to drive quality and yield improvements.
Strategic Collision: Similarities & Divergences
Both companies anchor the semiconductor ecosystem but differ fundamentally: QUALCOMM controls wireless technology licensing and chip design, while KLA leads in manufacturing process optimization. They compete indirectly, with QUALCOMM pushing connectivity innovation and KLA advancing production efficiency. Their distinct investment profiles reflect QUALCOMM’s IP licensing strength versus KLA’s capital equipment specialization.
Income Statement Comparison
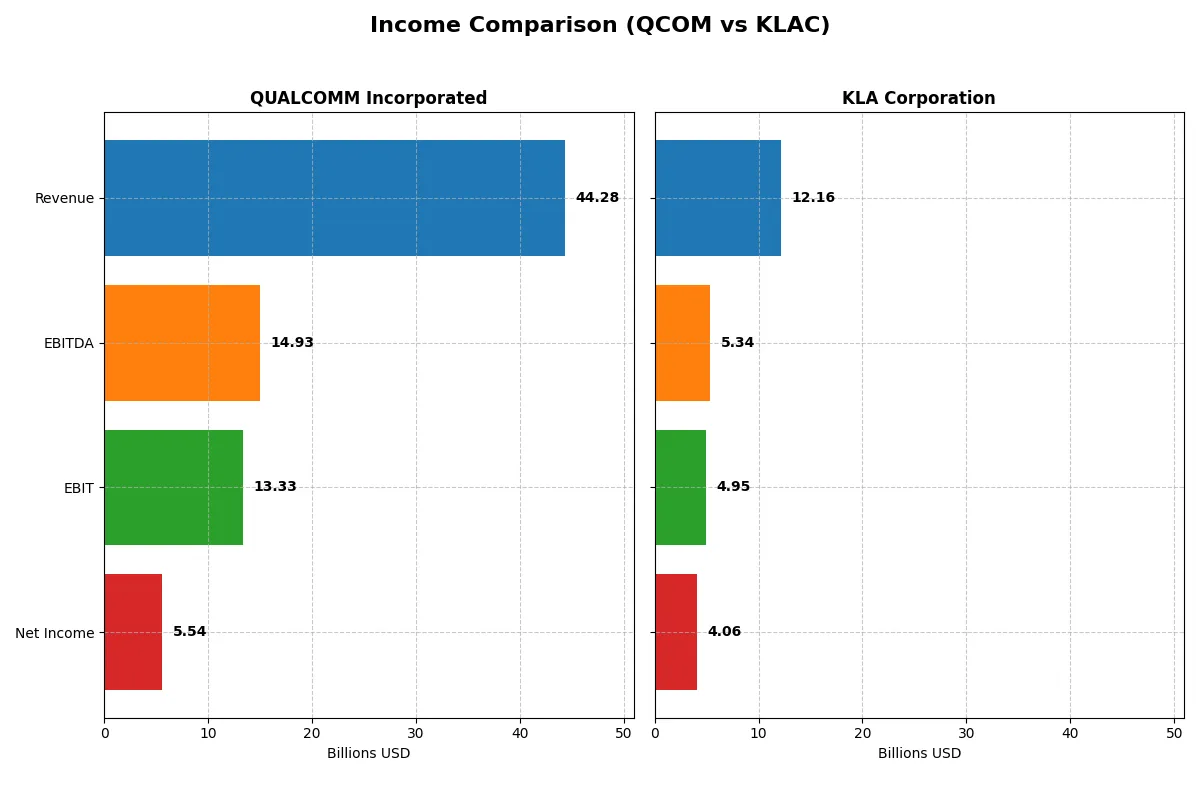
This data dissects the core profitability and scalability of both corporate engines to reveal who dominates the bottom line in their most recent fiscal year:
| Metric | QUALCOMM Incorporated (QCOM) | KLA Corporation (KLAC) |
|---|---|---|
| Revenue | 44.3B | 12.2B |
| Cost of Revenue | 19.7B | 4.6B |
| Operating Expenses | 12.2B | 2.3B |
| Gross Profit | 24.5B | 7.6B |
| EBITDA | 14.9B | 5.3B |
| EBIT | 13.3B | 4.9B |
| Interest Expense | 664M | 302M |
| Net Income | 5.5B | 4.1B |
| EPS | 5.06 | 30.53 |
| Fiscal Year | 2025 | 2025 |
Income Statement Analysis: The Bottom-Line Duel
This income statement comparison reveals the true efficiency and profitability dynamics of QUALCOMM Incorporated and KLA Corporation’s corporate engines.
QUALCOMM Incorporated Analysis
QUALCOMM’s revenue climbs steadily from $33.6B in 2021 to $44.3B in 2025, showing a 32% growth over five years. However, net income declines sharply from $9B in 2021 to $5.5B in 2025, indicating margin compression. Its gross margin remains solid around 55%, but net margin drops below 13%, reflecting rising costs and tax expenses. The latest year shows strong revenue and EBIT growth, yet net income and EPS falter, signaling efficiency challenges.
KLA Corporation Analysis
KLA exhibits robust revenue growth from $6.9B in 2021 to $12.2B in 2025, surging 76% over five years. Net income almost doubles from $2.1B to $4.1B, with net margins improving to 33%, showcasing excellent profitability. Gross margin stands at a high 62%, while EBIT margin exceeds 40%, highlighting operational efficiency. In 2025, KLA accelerates revenue and profit growth, supported by expanding margins and strong EPS gains, reflecting solid momentum and capital discipline.
Margin Strength vs. Growth Momentum
KLA outperforms QUALCOMM in both margin expansion and net income growth over the recent years. QUALCOMM’s revenue scale is larger, but margin erosion and net income decline raise concerns. KLA’s combination of accelerating top-line growth and rising profitability defines a cleaner fundamental winner. Investors favor KLA’s profile for its superior efficiency and consistent earnings momentum.
Financial Ratios Comparison
These vital ratios act as a diagnostic tool to expose the underlying fiscal health, valuation premiums, and capital efficiency of the companies analyzed:
| Ratios | QUALCOMM Incorporated (QCOM) | KLA Corporation (KLAC) |
|---|---|---|
| ROE | 26.1% | 86.6% |
| ROIC | 13.2% | 38.0% |
| P/E | 32.7 | 29.3 |
| P/B | 8.54 | 25.39 |
| Current Ratio | 2.82 | 2.62 |
| Quick Ratio | 2.10 | 1.83 |
| D/E | 0.70 | 1.30 |
| Debt-to-Assets | 29.5% | 37.9% |
| Interest Coverage | 18.6 | 17.3 |
| Asset Turnover | 0.88 | 0.76 |
| Fixed Asset Turnover | 9.44 | 9.70 |
| Payout Ratio | 68.7% | 22.3% |
| Dividend Yield | 2.10% | 0.76% |
| Fiscal Year | 2025 | 2025 |
Efficiency & Valuation Duel: The Vital Signs
Ratios act as a company’s DNA, exposing hidden risks and operational strength crucial for informed investment decisions.
QUALCOMM Incorporated
QUALCOMM posts a solid 26.1% ROE and a 12.5% net margin, signaling robust profitability. Its P/E of 32.7 and P/B of 8.54 suggest a stretched valuation relative to earnings and book value. The 2.1% dividend yield supports shareholder returns, balancing reinvestment in R&D with steady income.
KLA Corporation
KLA excels with an extraordinary 86.6% ROE and a 33.4% net margin, demonstrating exceptional efficiency. Despite a slightly lower P/E of 29.3, its P/B of 25.4 flags an expensive stock. Dividend yield at 0.76% is low, reflecting a preference for growth reinvestment over immediate payouts.
Premium Valuation vs. Operational Safety
KLA’s operational metrics shine but come with a premium valuation and higher leverage risk. QUALCOMM offers a more balanced risk-reward profile with favorable profitability and a stronger dividend. Growth-focused investors may prefer KLA, while those seeking steadier returns might lean toward QUALCOMM.
Which one offers the Superior Shareholder Reward?
I see QUALCOMM (QCOM) offers a 2.1% dividend yield with a payout ratio near 69%, supported by strong free cash flow coverage (2.8x). It balances dividends with consistent buybacks, fueling steady shareholder returns. KLA Corporation (KLAC) yields only 0.76% with a lower payout ratio (~22%) but invests heavily in buybacks and retains significant free cash flow for growth. Historically, QCOM’s higher yield and sustainable payout, combined with solid buybacks, deliver a more attractive total return profile in 2026. KLAC’s model suits growth-focused investors but lacks immediate income appeal. I conclude QCOM offers superior shareholder reward for income and total return seekers this year.
Comparative Score Analysis: The Strategic Profile
The radar chart reveals the fundamental DNA and trade-offs of QUALCOMM Incorporated and KLA Corporation, illustrating their financial strengths and vulnerabilities:
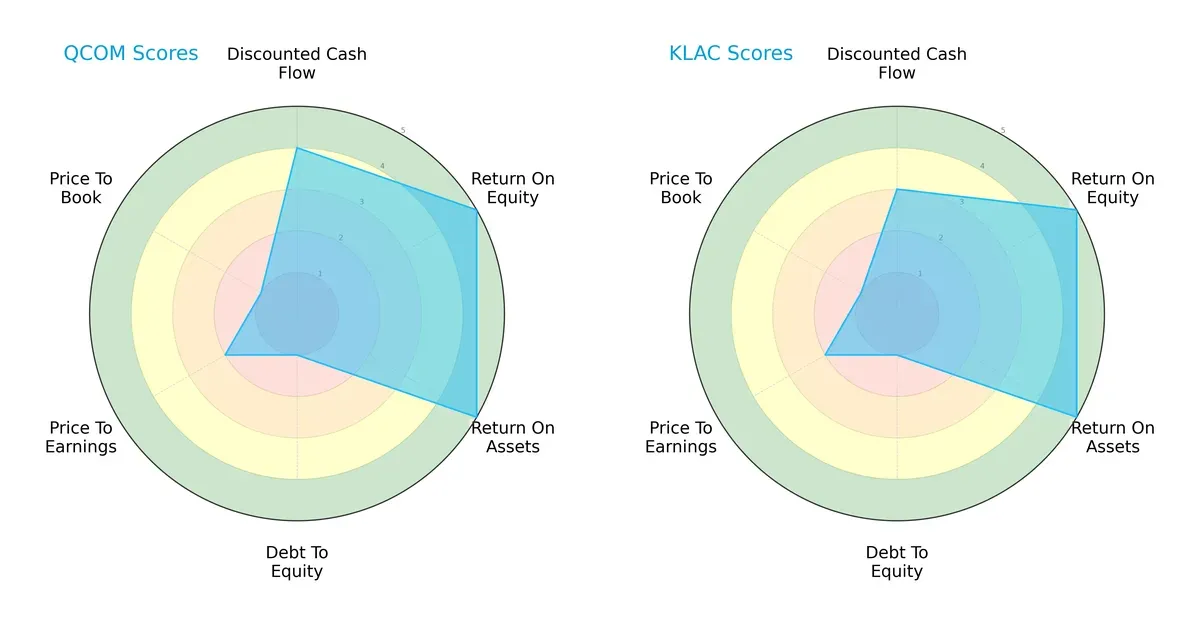
QUALCOMM and KLA show parity in overall scores, both scoring 3, but their profiles differ. QUALCOMM edges KLA in discounted cash flow (4 vs. 3), suggesting better future cash flow expectations. Both excel equally in ROE and ROA (5 each), indicating strong profitability and asset efficiency. Yet, both struggle with high debt-to-equity risk (score 1) and undervaluation risks (low P/E and P/B). QUALCOMM’s stronger DCF score hints at a growth advantage, while KLA maintains a more balanced but moderate valuation profile.
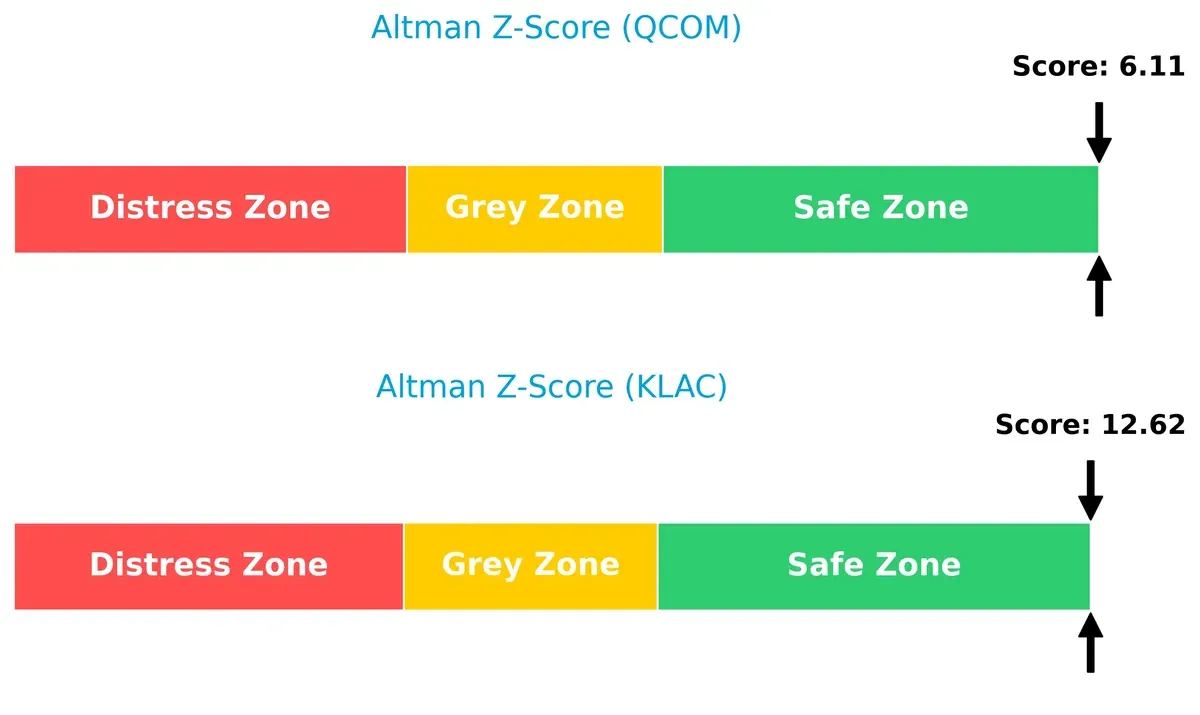
Bankruptcy Risk: Solvency Showdown
QUALCOMM’s Altman Z-Score of 6.11 versus KLA’s 12.62 places both comfortably in the safe zone, though KLA’s far superior score signals a stronger buffer against financial distress in this cycle:
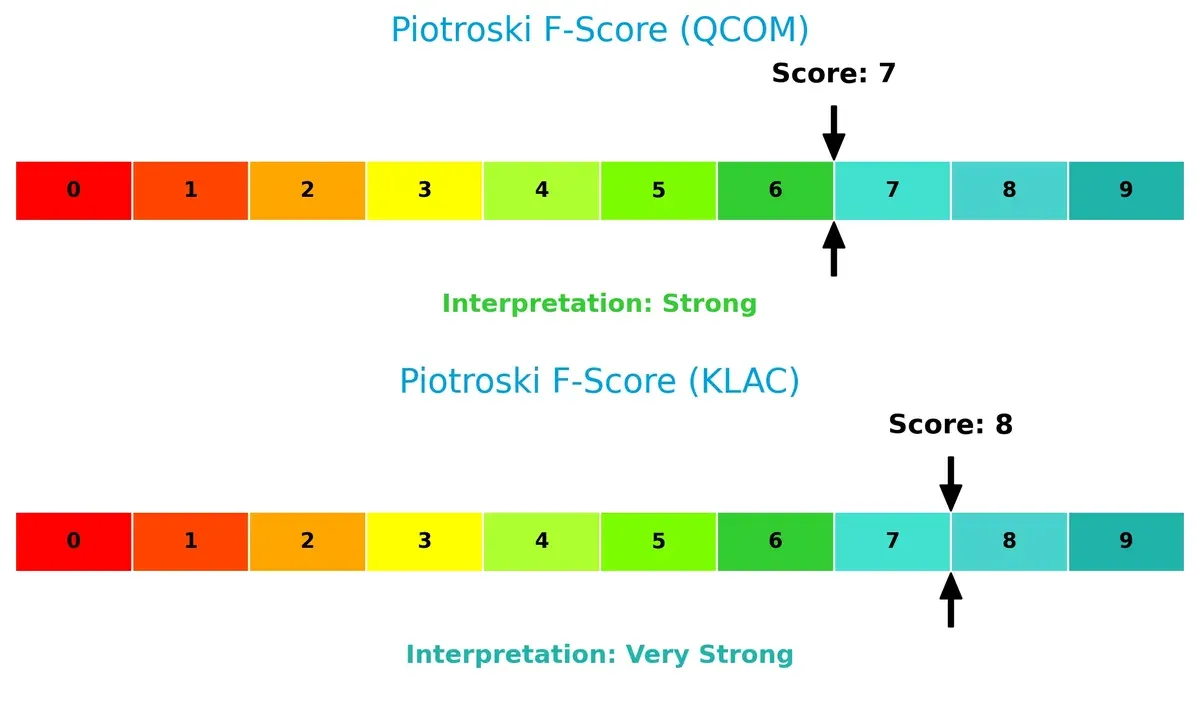
Financial Health: Quality of Operations
KLA’s Piotroski F-Score of 8 surpasses QUALCOMM’s 7, indicating KLA operates with slightly stronger internal financial health. This suggests KLA has fewer red flags in profitability, leverage, and efficiency metrics:
How are the two companies positioned?
This section dissects the operational DNA of QUALCOMM and KLA by comparing their revenue distribution by segment and internal dynamics. The final goal is to confront their economic moats to identify which business model offers the most resilient, sustainable competitive advantage today.
Revenue Segmentation: The Strategic Mix
This comparison dissects how QUALCOMM Incorporated and KLA Corporation diversify income streams and where their primary sector bets lie:
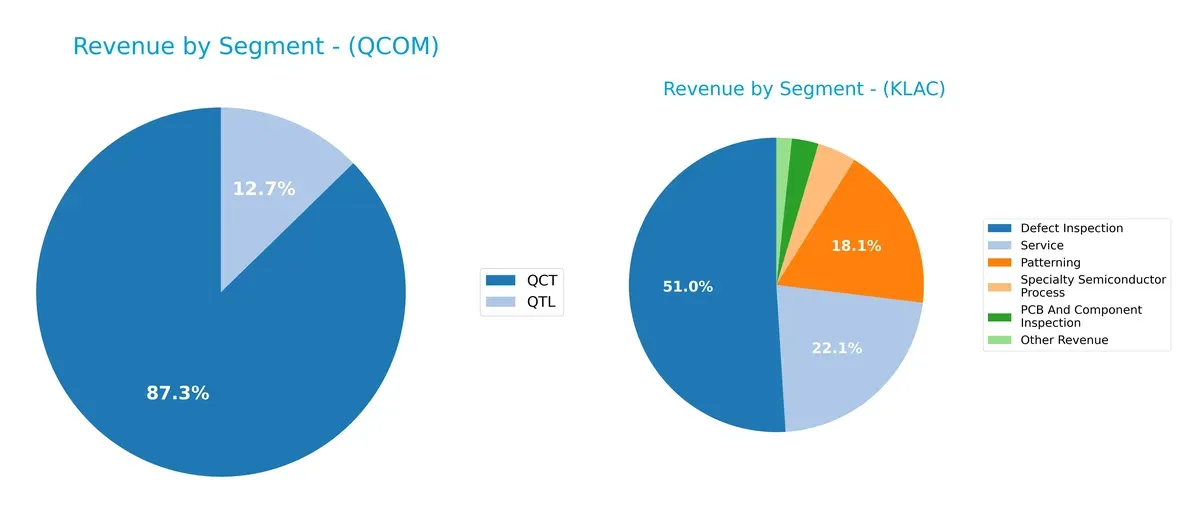
QUALCOMM anchors its revenue in QCT at $38.4B, with QTL contributing a smaller $5.6B, showing a strong concentration in chipset sales. KLA spreads revenue more evenly, with Defect Inspection at $6.2B and Service at $2.7B anchoring its mix, alongside Patterning and Specialty Semiconductor segments. KLA’s diversification reduces concentration risk, while QUALCOMM’s dominance in QCT signals dependency but also ecosystem lock-in.
Strengths and Weaknesses Comparison
This table compares the Strengths and Weaknesses of QUALCOMM and KLA Corporation based on diversification, profitability, financials, innovation, global presence, and market share:
QUALCOMM Strengths
- Strong profitability with favorable net margin and ROE
- Robust liquidity ratios support financial stability
- Diverse revenue streams including QCT and QTL segments
- Large global footprint, especially in China and Vietnam
- High fixed asset turnover indicates efficient capital use
KLA Strengths
- Exceptionally high profitability with excellent net margin, ROE, and ROIC
- Solid liquidity despite higher leverage
- Diversified product portfolio with strong Defect Inspection revenue
- Global presence across Asia, North America, and Europe
- Efficient capital allocation reflected in fixed asset turnover
QUALCOMM Weaknesses
- Elevated valuation multiples may pressure returns
- Moderate leverage with neutral debt-to-equity ratio
- Asset turnover is only neutral, limiting revenue efficiency
- Limited service segment revenue compared to peers
- Exposure concentration in China could pose geopolitical risk
KLA Weaknesses
- High debt-to-equity ratio increases financial risk
- Unfavorable WACC impacts cost of capital
- Low dividend yield may deter income investors
- Elevated valuation ratios suggest overvaluation risk
- Asset turnover is neutral, indicating room for efficiency gains
QUALCOMM exhibits balanced strengths in profitability and liquidity with a diversified global footprint. KLA delivers superior profitability but carries higher leverage and valuation risks. Each company’s profile suggests different strategic priorities in managing growth and financial risk.
The Moat Duel: Analyzing Competitive Defensibility
A structural moat is the only barrier protecting long-term profits from relentless competitive erosion. Let’s dissect how these two giants defend their turf:
QUALCOMM Incorporated: Intangible Asset Fortress
QUALCOMM’s patent portfolio creates a powerful intangible asset moat. This drives stable licensing revenues and a solid 30% EBIT margin. However, declining ROIC signals pressure from industry shifts in 2026.
KLA Corporation: Technological Process Edge
KLA’s moat stems from its specialized process control tech, delivering a superior 40% EBIT margin and rising ROIC. Its expanding footprint in advanced semiconductor inspection deepens its moat going into 2026.
Patent Licensing vs. Process Innovation: Which Moat Holds Stronger?
KLA’s growing ROIC and margin expansion reveal a wider, more durable moat than QUALCOMM’s shrinking profitability. KLA appears better positioned to defend and extend its market dominance.
Which stock offers better returns?
The stock prices of QUALCOMM Incorporated and KLA Corporation have diverged significantly over the past year, reflecting contrasting trading dynamics and momentum.
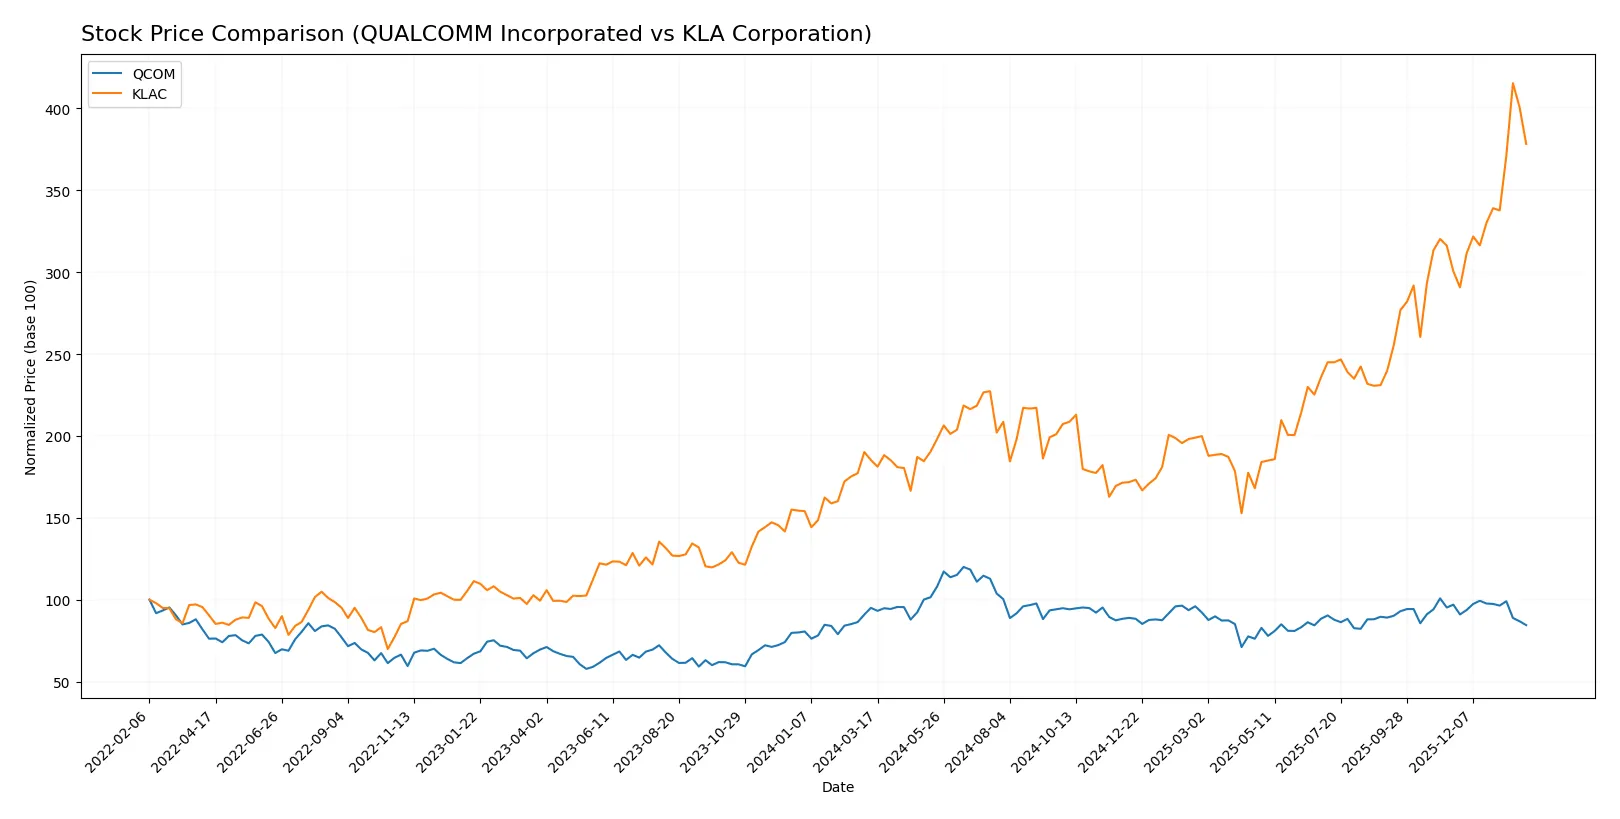
Trend Comparison
QUALCOMM’s stock declined by 11.13% over the past 12 months, indicating a bearish trend with deceleration. Its price ranged between 127.46 and 215.33, showing moderate volatility.
KLA’s stock surged 104.22% over the same period, marking a strong bullish trend with acceleration. Price volatility was high, swinging from 576.53 to 1567.82, reflecting rapid gains.
KLA outperformed QUALCOMM substantially, delivering the highest market returns with a robust upward trend compared to QUALCOMM’s bearish trajectory.
Target Prices
Analysts present a cautiously optimistic consensus for QUALCOMM Incorporated and KLA Corporation.
| Company | Target Low | Target High | Consensus |
|---|---|---|---|
| QUALCOMM Incorporated | 160 | 210 | 182.5 |
| KLA Corporation | 1400 | 1900 | 1672.25 |
The consensus target prices for QCOM and KLAC sit well above their current stock prices, signaling analyst confidence in significant upside potential.

Don’t Let Luck Decide Your Entry Point
Optimize your entry points with our advanced ProRealTime indicators. You’ll get efficient buy signals with precise price targets for maximum performance. Start outperforming now!
How do institutions grade them?
Here is a comparison of recent institutional grades for QUALCOMM Incorporated and KLA Corporation:
QUALCOMM Incorporated Grades
The table below summarizes recent grades from reputable institutions for QUALCOMM Incorporated.
| Grading Company | Action | New Grade | Date |
|---|---|---|---|
| UBS | Maintain | Neutral | 2026-01-26 |
| Mizuho | Maintain | Neutral | 2026-01-26 |
| Mizuho | Downgrade | Neutral | 2026-01-09 |
| B of A Securities | Maintain | Buy | 2025-11-06 |
| Rosenblatt | Maintain | Buy | 2025-11-06 |
| Wells Fargo | Maintain | Underweight | 2025-11-06 |
| Mizuho | Maintain | Outperform | 2025-11-06 |
| Piper Sandler | Maintain | Overweight | 2025-11-06 |
| UBS | Maintain | Neutral | 2025-11-06 |
| JP Morgan | Maintain | Overweight | 2025-11-04 |
KLA Corporation Grades
The table below shows recent grades from reliable institutions for KLA Corporation.
| Grading Company | Action | New Grade | Date |
|---|---|---|---|
| Oppenheimer | Maintain | Outperform | 2026-01-30 |
| Barclays | Maintain | Overweight | 2026-01-30 |
| Cantor Fitzgerald | Maintain | Overweight | 2026-01-30 |
| Jefferies | Maintain | Buy | 2026-01-30 |
| Stifel | Maintain | Buy | 2026-01-30 |
| Wells Fargo | Maintain | Overweight | 2026-01-30 |
| Needham | Maintain | Buy | 2026-01-30 |
| RBC Capital | Maintain | Sector Perform | 2026-01-30 |
| Deutsche Bank | Maintain | Hold | 2026-01-21 |
| Needham | Maintain | Buy | 2026-01-20 |
Which company has the best grades?
KLA Corporation consistently earns higher grades such as Outperform and Overweight, indicating stronger institutional confidence. QUALCOMM’s grades are more mixed, with several Neutral and Underweight ratings. Investors may view KLA’s superior grades as a sign of relatively better market sentiment.
Risks specific to each company
The following categories identify the critical pressure points and systemic threats facing both firms in the 2026 market environment:
1. Market & Competition
QUALCOMM Incorporated
- Faces intense competition in wireless tech licensing and chip markets, pressuring margins.
KLA Corporation
- Dominates semiconductor process control but vulnerable to cyclical semiconductor capital spending.
2. Capital Structure & Debt
QUALCOMM Incorporated
- Moderate leverage (D/E 0.7), strong interest coverage eases refinancing risks.
KLA Corporation
- Higher leverage (D/E 1.3) raises financial risk despite solid interest coverage.
3. Stock Volatility
QUALCOMM Incorporated
- Beta 1.21 suggests moderate sensitivity to market swings.
KLA Corporation
- Beta 1.44 indicates higher stock price volatility and investor risk.
4. Regulatory & Legal
QUALCOMM Incorporated
- Faces ongoing licensing and antitrust scrutiny affecting revenue predictability.
KLA Corporation
- Regulatory risks lower, mainly focused on product compliance and export controls.
5. Supply Chain & Operations
QUALCOMM Incorporated
- Dependent on global semiconductor foundries; supply disruptions could impact output.
KLA Corporation
- Sensitive to supply chain bottlenecks in semiconductor manufacturing equipment components.
6. ESG & Climate Transition
QUALCOMM Incorporated
- Increasing pressure to reduce carbon footprint in wireless infrastructure.
KLA Corporation
- Actively improving energy efficiency in manufacturing equipment, but transition risks remain.
7. Geopolitical Exposure
QUALCOMM Incorporated
- Significant exposure to US-China tech tensions impacting licensing and sales.
KLA Corporation
- Also exposed to geopolitical risks affecting semiconductor supply chains, but less licensing risk.
Which company shows a better risk-adjusted profile?
QUALCOMM’s most impactful risk is regulatory and legal uncertainty around its licensing business, which could disrupt revenue streams. KLA’s largest risk lies in its elevated leverage combined with cyclical industry exposure affecting stock volatility. Despite QUALCOMM’s regulatory headwinds, it presents a more balanced risk profile with moderate debt and stable liquidity. KLA’s higher debt and stock volatility increase risk, despite superior profitability metrics. Recent sharp share price decline for KLA (-15%) underscores market concerns over its capital structure and cyclicality. Therefore, I view QUALCOMM as having a better risk-adjusted profile in 2026.
Final Verdict: Which stock to choose?
QUALCOMM’s superpower lies in its resilient cash generation and efficient capital use, underpinning a solid value-creation track record. Its declining ROIC trend is a point of vigilance, suggesting caution on sustained profitability. It suits portfolios seeking steady income with moderate growth exposure.
KLA stands out with a robust strategic moat driven by escalating ROIC and expanding profitability, reflecting durable competitive advantage. It offers a more dynamic growth profile with stronger margin expansion but carries a higher valuation premium and leverage risk. This fits well with Growth at a Reasonable Price (GARP) investors.
If you prioritize consistent cash flow and a defensive stance, QUALCOMM is the compelling choice due to its stable value creation and healthy liquidity. However, if you seek accelerated growth backed by a durable moat and can tolerate valuation and leverage premiums, KLA offers better upside potential and superior profitability momentum.
Disclaimer: Investment carries a risk of loss of initial capital. The past performance is not a reliable indicator of future results. Be sure to understand risks before making an investment decision.
Go Further
I encourage you to read the complete analyses of QUALCOMM Incorporated and KLA Corporation to enhance your investment decisions: