In the fast-evolving technology sector, QUALCOMM Incorporated and IPG Photonics Corporation stand out as leaders in semiconductors but with distinct innovation paths. QUALCOMM drives wireless communication technologies globally, while IPG Photonics excels in high-performance fiber lasers for industrial and medical applications. Comparing these companies reveals insights into their market focus and growth potential. Join me as we explore which stock offers the most compelling opportunity for your investment portfolio.
Table of contents
Companies Overview
I will begin the comparison between QUALCOMM and IPG Photonics by providing an overview of these two companies and their main differences.
QUALCOMM Overview
QUALCOMM Incorporated, headquartered in San Diego, CA, focuses on developing and commercializing foundational technologies for the wireless industry worldwide. The company operates through three segments: Qualcomm CDMA Technologies (QCT), Qualcomm Technology Licensing (QTL), and Qualcomm Strategic Initiatives (QSI). It supplies integrated circuits and system software for wireless communications and licenses intellectual property related to various wireless standards including 5G.
IPG Photonics Overview
IPG Photonics Corporation, based in Marlborough, MA, develops, manufactures, and sells high-performance fiber lasers, amplifiers, and diode lasers mainly for materials processing and other advanced applications. The company’s product portfolio includes fiber lasers, amplifiers, integrated laser systems, and optical communication modules, serving original equipment manufacturers, system integrators, and end users globally.
Key similarities and differences
Both QUALCOMM and IPG Photonics operate in the technology sector with a focus on semiconductor-related products. QUALCOMM emphasizes wireless communication technologies and intellectual property licensing, while IPG specializes in fiber laser technologies and materials processing applications. QUALCOMM’s broader market reach and diversified business segments contrast with IPG’s more specialized laser and amplifier product offerings.
Income Statement Comparison
The table below presents the key income statement metrics for QUALCOMM Incorporated and IPG Photonics Corporation for their most recent fiscal years, facilitating a straightforward financial comparison.

| Metric | QUALCOMM Incorporated | IPG Photonics Corporation |
|---|---|---|
| Market Cap | 175.3B | 3.39B |
| Revenue | 44.3B | 977M |
| EBITDA | 14.9B | 76M |
| EBIT | 13.3B | 14M |
| Net Income | 5.54B | -182M |
| EPS | 5.06 | -4.09 |
| Fiscal Year | 2025 | 2024 |
Income Statement Interpretations
QUALCOMM Incorporated
QUALCOMM’s revenue showed a steady upward trend from $33.6B in 2021 to $44.3B in 2025, reflecting a favorable 31.9% growth over five years. Gross and EBIT margins remained strong and favorable, above 55% and 30% respectively. However, net income declined sharply in 2025 to $5.54B from over $10B in 2024, causing net margin and EPS to drop significantly.
IPG Photonics Corporation
IPG Photonics experienced declining revenues from $1.46B in 2021 to $977M in 2024, a negative 18.6% trend. Gross margin remained favorable at 34.6%, but EBIT margin was neutral at about 1.48%. The company posted a net loss of $181M in 2024, sharply down from a net income of $219M in 2023, with net margin and EPS deteriorating significantly over the period.
Which one has the stronger fundamentals?
QUALCOMM demonstrates stronger fundamentals overall, with consistent revenue growth, favorable margins, and positive EBITDA and EBIT trends. Despite recent net income pressure, its income statement remains largely favorable. In contrast, IPG Photonics shows declining revenues, weak profitability, and sustained net losses, resulting in an unfavorable income statement evaluation.
Financial Ratios Comparison
The table below presents a side-by-side comparison of key financial ratios for QUALCOMM Incorporated and IPG Photonics Corporation based on their most recent fiscal year data.
| Ratios | QUALCOMM Incorporated (2025) | IPG Photonics Corporation (2024) |
|---|---|---|
| ROE | 26.13% | -8.97% |
| ROIC | 13.19% | -9.97% |
| P/E | 32.70 | -17.76 |
| P/B | 8.54 | 1.59 |
| Current Ratio | 2.82 | 6.98 |
| Quick Ratio | 2.10 | 5.59 |
| D/E | 0.70 | 0.01 |
| Debt-to-Assets | 29.54% | 0.78% |
| Interest Coverage | 18.61 | 0 |
| Asset Turnover | 0.88 | 0.43 |
| Fixed Asset Turnover | 9.44 | 1.66 |
| Payout Ratio | 68.67% | 0% |
| Dividend Yield | 2.10% | 0% |
Interpretation of the Ratios
QUALCOMM Incorporated
QUALCOMM shows strong profitability with a net margin of 12.51% and a return on equity of 26.13%, both favorable. The company maintains a solid liquidity position with a current ratio of 2.82 and low debt-to-assets at 29.54%, indicating financial stability. However, valuation ratios like P/E at 32.7 and P/B at 8.54 are less attractive. QUALCOMM pays dividends with a 2.1% yield, supported by healthy free cash flow coverage and balanced buyback programs.
IPG Photonics Corporation
IPG Photonics displays weak profitability metrics, including a negative net margin of -18.58% and return on equity of -8.97%, reflecting operating challenges. Liquidity is strong with a current ratio near 7, but asset turnover is low at 0.43, suggesting inefficiency. The company does not pay dividends, likely due to losses and a focus on reinvestment. Its low debt levels and favorable interest coverage indicate limited financial risk despite operating difficulties.
Which one has the best ratios?
QUALCOMM’s ratios are predominantly favorable, highlighting profitability, liquidity, and shareholder returns, despite some high valuation multiples. IPG Photonics struggles with profitability and efficiency but maintains strong liquidity and low leverage. Overall, QUALCOMM presents a more robust financial profile, while IPG Photonics shows areas needing improvement with mixed ratio outcomes.
Strategic Positioning
This section compares the strategic positioning of QUALCOMM Incorporated and IPG Photonics Corporation, including market position, key segments, and exposure to technological disruption:
QUALCOMM Incorporated
- Leading semiconductor company with significant market cap and competitive pressure in wireless technology.
- Operates three segments: integrated circuits, technology licensing, and strategic initiatives across industries.
- Exposed to rapid wireless technology evolutions including 3G to 5G and AI-driven innovations via investments.
IPG Photonics Corporation
- Smaller semiconductor firm focused on high-performance fiber lasers and amplifiers for materials processing.
- Focuses on laser products for materials processing, communications, medical, and advanced applications globally.
- Faces disruption risks in laser technology but primarily targets specialized industrial and communication fields.
QUALCOMM vs IPG Photonics Positioning
QUALCOMM shows a diversified approach with multiple business segments spanning wireless technologies and strategic investments, providing broad industry exposure. IPG Photonics is more concentrated on fiber laser systems and related applications, focusing on niche markets with specialized products.
Which has the best competitive advantage?
QUALCOMM holds a slightly favorable economic moat by creating value despite declining profitability, while IPG Photonics has a very unfavorable moat, shedding value with decreasing returns, indicating a weaker competitive advantage.
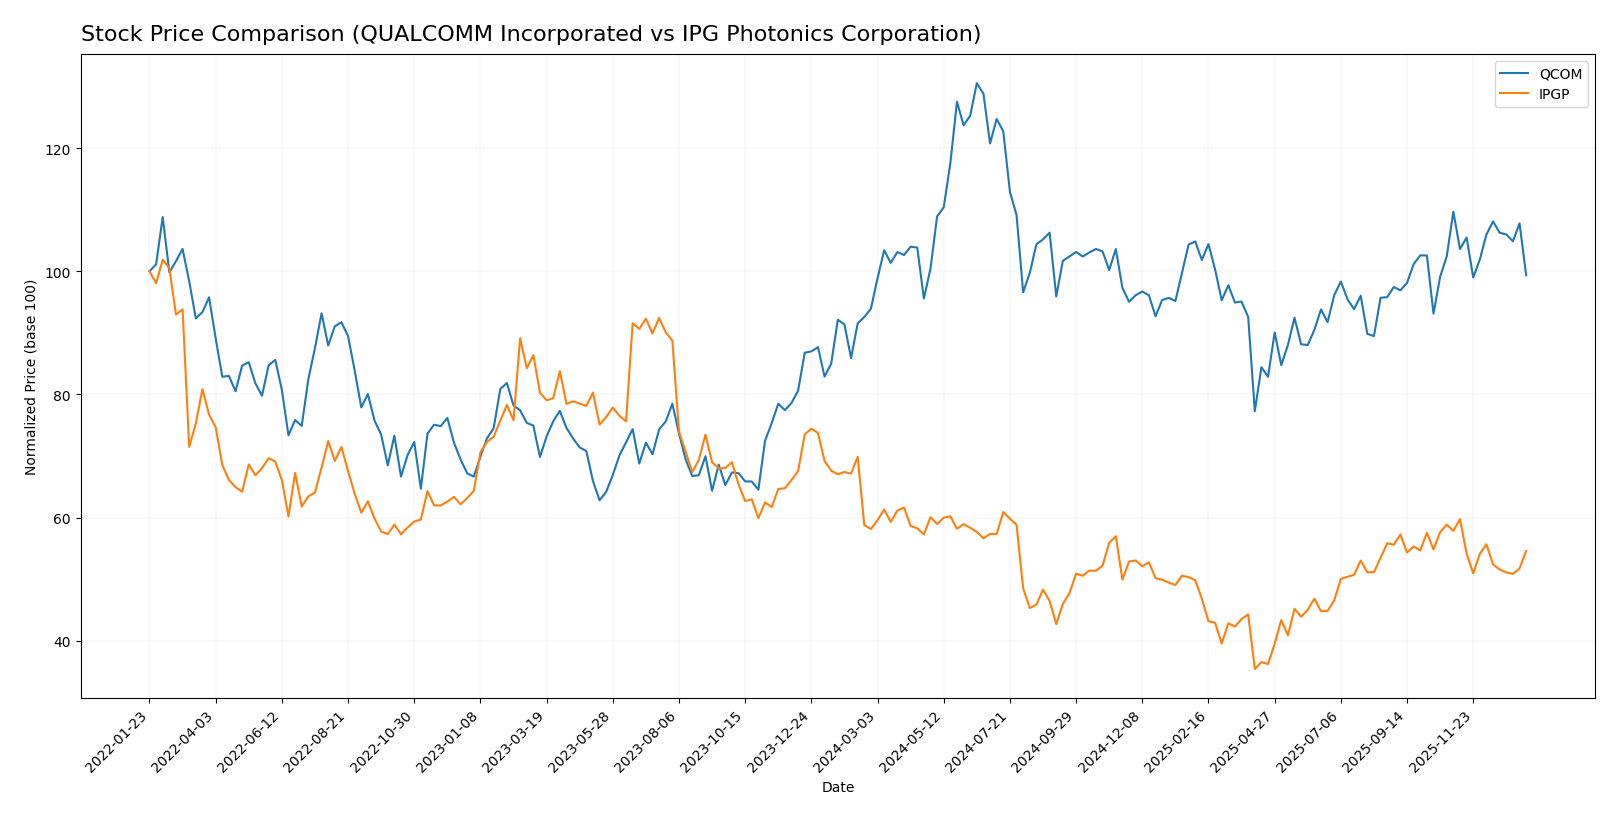
Stock Comparison
The stock price movements of QUALCOMM Incorporated and IPG Photonics Corporation over the past year reveal contrasting trends, with QUALCOMM showing a bullish trajectory with acceleration, while IPG Photonics experiences a decelerating bearish trend.
Trend Analysis
QUALCOMM’s stock posted a 5.79% increase over the past 12 months, indicating a bullish trend with accelerating momentum. The price ranged between 127.46 and 215.33, with a high volatility reflected by a 16.08 standard deviation.
IPG Photonics saw a 6.1% decline over the same period, reflecting a bearish trend with deceleration. Its stock price fluctuated between 52.12 and 90.69, exhibiting moderate volatility with a 9.27 standard deviation.
Comparatively, QUALCOMM delivered the highest market performance with positive growth and acceleration, whereas IPG Photonics showed a negative return and decelerating bearish momentum.
Target Prices
The current analyst consensus for target prices suggests potential upside for both QUALCOMM Incorporated and IPG Photonics Corporation.
| Company | Target High | Target Low | Consensus |
|---|---|---|---|
| QUALCOMM Incorporated | 210 | 165 | 185.71 |
| IPG Photonics Corporation | 96 | 92 | 94 |
Analysts expect QUALCOMM’s stock to trade notably above its current price of $163.71, indicating moderate upside potential. IPG Photonics shows a tighter target range with a consensus well above its current price of $80.41, signaling positive market sentiment.
Analyst Opinions Comparison
This section compares analysts’ ratings and grades for QUALCOMM Incorporated and IPG Photonics Corporation:
Rating Comparison
QCOM Rating
- Rating: B+ with a very favorable status, indicating strong overall analyst confidence.
- Discounted Cash Flow Score: 4, favorable outlook on future cash flow projections.
- ROE Score: 5, very favorable, showing excellent profit generation from equity.
- ROA Score: 5, very favorable, indicating highly effective asset utilization.
- Debt To Equity Score: 1, very unfavorable, suggests higher financial risk.
- Overall Score: 3, moderate rating summarizing financial standing.
IPGP Rating
- Rating: B+ with a very favorable status, reflecting solid analyst approval.
- Discounted Cash Flow Score: 4, also favorable regarding future cash flow.
- ROE Score: 2, moderate efficiency in generating profit from shareholders’ equity.
- ROA Score: 3, moderate effectiveness in using assets to generate earnings.
- Debt To Equity Score: 4, favorable, indicating lower reliance on debt financing.
- Overall Score: 3, moderate overall financial assessment.
Which one is the best rated?
Both QCOM and IPGP share the same overall rating of B+ and a moderate overall score of 3. QCOM scores higher on ROE and ROA but has a weaker debt-to-equity position, while IPGP shows better debt management but lower profitability metrics.
Scores Comparison
Here is a comparison of the Altman Z-Score and Piotroski Score for both companies:
QCOM Scores
- Altman Z-Score: 6.37, indicating a safe zone with low bankruptcy risk.
- Piotroski Score: 7, reflecting strong financial health and value.
IPGP Scores
- Altman Z-Score: 9.65, indicating a safe zone with very low bankruptcy risk.
- Piotroski Score: 7, reflecting strong financial health and value.
Which company has the best scores?
Both QCOM and IPGP have strong Piotroski Scores of 7, indicating solid financial health. However, IPGP’s higher Altman Z-Score of 9.65 suggests a comparatively lower bankruptcy risk than QCOM’s 6.37.
Grades Comparison
Here is the comparison of recent stock grades assigned to QUALCOMM Incorporated and IPG Photonics Corporation:
QUALCOMM Incorporated Grades
The following table shows recent grades from multiple reputable grading firms for QUALCOMM Incorporated:
| Grading Company | Action | New Grade | Date |
|---|---|---|---|
| Mizuho | Downgrade | Neutral | 2026-01-09 |
| Rosenblatt | Maintain | Buy | 2025-11-06 |
| B of A Securities | Maintain | Buy | 2025-11-06 |
| Mizuho | Maintain | Outperform | 2025-11-06 |
| Wells Fargo | Maintain | Underweight | 2025-11-06 |
| Piper Sandler | Maintain | Overweight | 2025-11-06 |
| UBS | Maintain | Neutral | 2025-11-06 |
| JP Morgan | Maintain | Overweight | 2025-11-04 |
| Citigroup | Maintain | Neutral | 2025-10-28 |
| Rosenblatt | Maintain | Buy | 2025-10-28 |
QUALCOMM’s grades show a mixed but generally positive outlook, with multiple “Buy” and “Outperform” ratings balanced by some “Neutral” and “Underweight” opinions.
IPG Photonics Corporation Grades
The following table displays recent grades from recognized grading companies for IPG Photonics Corporation:
| Grading Company | Action | New Grade | Date |
|---|---|---|---|
| Citigroup | Upgrade | Buy | 2025-11-05 |
| Bernstein | Upgrade | Outperform | 2025-08-07 |
| Raymond James | Maintain | Strong Buy | 2025-05-07 |
| CL King | Upgrade | Buy | 2025-03-18 |
| Citigroup | Maintain | Sell | 2025-02-18 |
| Stifel | Maintain | Buy | 2025-02-12 |
| Needham | Maintain | Hold | 2025-02-12 |
| Seaport Global | Downgrade | Neutral | 2024-08-01 |
| Stifel | Maintain | Buy | 2024-07-31 |
| Raymond James | Maintain | Strong Buy | 2024-07-31 |
IPG Photonics exhibits a varied rating profile, ranging from “Strong Buy” to “Sell,” with recent upgrades indicating improving sentiment.
Which company has the best grades?
Both QUALCOMM and IPG Photonics have a consensus “Buy” rating, but QUALCOMM shows a stronger concentration of consistent “Buy” and “Outperform” grades across multiple firms. IPG Photonics has a wider spread between “Strong Buy” and “Sell” ratings, which may imply higher analyst disagreement and potential volatility for investors.
Strengths and Weaknesses
Below is a comparative overview of the key strengths and weaknesses of QUALCOMM Incorporated (QCOM) and IPG Photonics Corporation (IPGP) based on their latest financial and operational data.
| Criterion | QUALCOMM Incorporated (QCOM) | IPG Photonics Corporation (IPGP) |
|---|---|---|
| Diversification | Strong product segmentation: dominant in chipset (QCT $38.4B) and licensing (QTL $5.6B) | More concentrated in laser and amplifier systems, less diversified product line |
| Profitability | Favorable net margin (12.5%), ROE (26.1%), ROIC (13.2%), creating value but with declining ROIC trend | Negative net margin (-18.6%), ROE (-9.0%), ROIC (-10%), shedding value with sharply declining profitability |
| Innovation | Consistent investments in chipset technology and licensing; recognized for strong IP portfolio | Technological leader in fiber lasers but struggles with profitability and market challenges |
| Global presence | Established global footprint with diversified revenue streams across geographies | Global niche player with growing but limited market reach |
| Market Share | Leading position in mobile chipset market, strong licensing agreements | Niche leader in fiber laser market but faces intense competition and margin pressure |
Key takeaways: QUALCOMM maintains a strong competitive position with diversified revenues and solid profitability, though its return on invested capital is declining. IPG Photonics shows innovation leadership in lasers but suffers from negative profitability and value destruction, indicating higher investment risk. Investors should weigh QUALCOMM’s stable value creation against IPG’s operational challenges.
Risk Analysis
Below is a comparison table outlining key risks for QUALCOMM Incorporated (QCOM) and IPG Photonics Corporation (IPGP) based on the most recent data available:
| Metric | QUALCOMM Incorporated (QCOM) | IPG Photonics Corporation (IPGP) |
|---|---|---|
| Market Risk | Beta 1.21 indicates moderate volatility; semiconductor sector cyclical | Beta 1.02 suggests moderate volatility; niche market exposure |
| Debt level | Moderate debt-to-equity 0.7, debt/assets 29.5% | Very low debt-to-equity 0.01, minimal leverage |
| Regulatory Risk | Exposure to global wireless patent licensing regulations and US government contracts | Moderate, with global sales but less regulatory complexity |
| Operational Risk | Complex supply chains in semiconductor manufacturing; reliance on 5G tech | Manufacturing and tech innovation risks in fiber lasers |
| Environmental Risk | Moderate, industry pressure on energy use and e-waste | Moderate, laser manufacturing environmental standards |
| Geopolitical Risk | High, due to global patent licensing and US-China tech tensions | Moderate, with international sales but less political exposure |
The most impactful risks for QUALCOMM are geopolitical tensions affecting global 5G licensing and moderate market volatility. For IPG Photonics, operational risks tied to innovation and market demand shifts are critical, despite its strong balance sheet and low debt. Both companies are in the technology sector but face distinct risk profiles that investors should weigh carefully.
Which Stock to Choose?
QUALCOMM Incorporated (QCOM) shows a favorable income evolution with 13.66% revenue growth in 2025, strong profitability metrics including a 12.51% net margin, and a solid financial structure supported by a 2.82 current ratio and moderate debt levels. The company holds a very favorable overall rating of B+ and demonstrates a slightly favorable economic moat despite declining ROIC.
IPG Photonics Corporation (IPGP) exhibits an unfavorable income evolution marked by a -24.1% revenue decline in 2024 and negative profitability with an -18.58% net margin. Its financial ratios are slightly unfavorable overall, although it benefits from low debt and a safe zone Altman Z-Score. The rating is also B+ but with more moderate scores and a very unfavorable economic moat due to value destruction.
Considering the ratings and comprehensive financial evaluations, QCOM could appear more favorable for investors seeking a company with stable income growth, profitability, and value creation. Conversely, IPGP might be viewed as a higher-risk option suitable for risk-tolerant investors who focus on potential turnaround opportunities despite recent unfavorable trends.
Disclaimer: Investment carries a risk of loss of initial capital. The past performance is not a reliable indicator of future results. Be sure to understand risks before making an investment decision.
Go Further
I encourage you to read the complete analyses of QUALCOMM Incorporated and IPG Photonics Corporation to enhance your investment decisions: